[Preprint]. 2024 Jun 11:2024.06.05.597539.
doi: 10.1101/2024.06.05.597539.

Neurogliaform Cells Exhibit Laminar-specific Responses in the Visual Cortex and Modulate Behavioral State-dependent Cortical Activity

Affiliations

Neurogliaform Cells Exhibit Laminar-specific Responses in the Visual Cortex and Modulate Behavioral State-dependent Cortical Activity

Shuhan Huang et al. bioRxiv. .

Abstract

Neurogliaform cells are a distinct type of GABAergic cortical interneurons known for their "volume transmission" output property. However, their activity and function within cortical circuits remain unclear. Here, we developed two genetic tools to target these neurons and examine their function in the primary visual cortex. We found that the spontaneous activity of neurogliaform cells positively correlated with locomotion. Silencing these neurons increased spontaneous activity during locomotion and impaired visual responses in L2/3 pyramidal neurons. Furthermore, the contrast-dependent visual response of neurogliaform cells varies with their laminar location and is constrained by their morphology and input connectivity. These findings demonstrate the importance of neurogliaform cells in regulating cortical behavioral state-dependent spontaneous activity and indicate that their functional engagement during visual stimuli is influenced by their laminar positioning and connectivity.


Figures

Figure 1.
Figure 1.. DLX-Cre; LAMP5-FlpO targets all LAMP5+ cINs.
(a) Schematic illustration of the distribution of LAMP5+ cINs in V1, indicating their various subtypes. (b) Example image of DLX-Cre; LAMP5-FlpO; Ai65(RCFL-tdT) genetic labeling in V1 showing the distribution of LAMP5+ cINs (left) and segmented cell bodies (right). Scale bar = 100 μm. (c) Quantification for the number of labeled cells per 103 μm2 and (d) the intensity of labeled neurites in 103 arbitrary units (A.U.) across cortical layers. Gray indicates L2/3 and L5. The 40 μm thick coronal V1 sections were divided into 50 μm vertical bands for cell density measurement. Each gray line represents data from an individual animal. (e-h) Representative RNAscope assays images in V1 taken with confocal microscopy and bar plots quantifying the ratio of marker gene-positive cells to all tdTom labeled cells in each cortical layer. Each panel displays an overlay figure (left) with nuclei dye DAPI (in blue), tdTom-labeled cells from DLX-Cre; LAMP5-FlpO; Ai65(RCFL-tdT) (middle, in red), and the marker gene expression detected by RNAscope assay (right, in green). Scale bar = 20 μm. Each dot represents data from one coronal V1 section. Arrow indicates tdTom and marker gene co-localized cells. (e1-e2) NPY; (f1-f2) SV2C; (g1-g2) LSP1; (h1-h2) NDNF. While NPY is a classical marker for identifying neurogliaform cells in rodents, it is not exclusively restricted to LAMP5+ cINs. Moreover, although LSP1 serves as a specific marker gene for the Lamp5/Lsp1 cluster, it is expressed in only half of the neurons within this population. Data from N = 3 animals. Error bar represents SEM. Repeated measures ANOVA (c-d, g2-h2) or mixed-effects model (e2) followed by uncorrected Fisher’s LSD were used for testing statistical significance. See supplementary data 1 - Table 1 for statistics.
Figure 2.
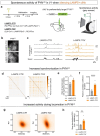
Figure 2.. LAMP5+ cIN silencing results in increased spontaneous activity of PYNL23 in V1.
(a) (left) The experimental animals (LAMP5::TOX) were generated by crossing the DLX-Cre; LAMP5-FlpO mouse model with RC:PFtox, specifically, DLX-Cre(Tg); LAMP5-FlpO(+/−); RC:PFtox(Flox/+, Frt/+). Controls (LAMP5::CTR) were mice lacking Cre and/or FlpO (either one or both negative) while still carrying the RC:PFtox(Flox/+, Frt/+) genotype. No notable differences were observed among different control genotypes. (middle) To visualize PYNL23 activity, AAV9.CaMKII.GCaMP6f.WPRE.SV40 was injected into V1 during the cranial window implantation surgery to express GCaMP6f preferentially in PYNL23. Intrinsic imaging (refer to Methods) was used to confirm the V1 location in each animal before proceeding with in vivo two-photon calcium imaging experiments. (right) Illustration of the experimental setup during the spontaneous activity recordings. The animal was presented with a gray screen (uniform mean luminance) during two-photon imaging of the GCaMP signal. (b) Example images from the maximum intensity projection of the two-photon imaging experiments, showing GCaMP6f expression within L2/3 of V1 in LAMP5::CTR (upper) and LAMP5::TOX (bottom). Scale bar = 100 μm. (c) Example traces from spontaneous activity recordings in both LAMP5::CTR (left) and LAMP5::TOX (right). The top four traces in each set (gray for LAMP5::CTR and orange for LAMP5::TOX) represent the smoothed standardized dF/F0 activity of four randomly chosen neurons during a randomly selected time interval for representation. The bottom trace (in black) in each set shows the corresponding locomotion speed of the animal (measured in cm/s). (d) Example heatmap showing Pearson’s correlation coefficient of neuron pairs from a single imaging session using LAMP5::CTR (left) or LAMP5::TOX (right). (e) Bar plot showing ratio of significantly (p < 0.05) correlated pairs out of all neuron pairs with shuffling (refer to Methods) in LAMP5::CTR (gray) and LAMP5::TOX (orange). (f) Bar plot showing Pearson’s correlation coefficient of all neuron pairs in LAMP5::CTR (gray) and LAMP5::TOX (orange). (g) Averaged spontaneous standardized dF/F0 activity for each neuron during either stationary (speed ≤ 1 cm/s) or running (speed > 1 cm/s) period for LAMP5::CTR (left) and LAMP5::TOX (right) groups. The data are fit with a Gaussian kernel for visualization. (h) Bar plot showing the differences in mean standardized dF/F0 activity between running and stationary period, obtained by subtracting the latter from the former, for LAMP5::CTR (gray) and LAMP5::TOX (orange). Error bar represents SEM. Each dot represents the (averaged) result from an individual animal. Mann-Whitney test (e) and hierarchical bootstrap (f,h-i) were used for testing statistical significance. See supplementary data 1 - Table 2 for statistics.
Figure 3 -
Figure 3 -. LAMP5+ cIN silencing results in impaired visual response properties of PYNL23 in V1.
(a) Illustration of the experimental setup during the recording of visual responses. The animal was presented with moving gratings on the screen, while the GCaMP signal in PYNL23 was imaged with two-photon microscopy. Each trial was 6s, consisting of 2s full-field moving gratings with orientations displayed randomly, a fixed contrast (80%), spatial frequency (0.04 cpd) and temporal frequency (1 Hz). 4s inter-stimulus-intervals of gray screen (mean luminance) was presented. 12 orientations were examined: 0°, 30°, 60°, 90°, 120°, 150°, 180°, 210°, 240°, 270°, 300°, 330°. (b) Example traces of PYNL23 responses from the LAMP5::CTR (gray) or LAMP5::TOX (orange) mice. The top four traces in each set represent the standardized dF/F0 activity (smoothed for representation) of four randomly chosen neurons during a randomly selected time interval. The bottom trace (in black) in each set showed the corresponding locomotion speed of the animal (measured in cm/s). Colored fill (gray or orange) indicates the presence of moving gratings. (c) Heatmap showing averaged visual responses to various tested orientations (columns) of all recorded neurons (rows) sorted by their preferred orientation for LAMP5::CTR (left) and LAMP5::TOX (right). (d) Averaged visual responses to orientations (pseudo-90° indicates the preferred orientation for a neuron) in LAMP5::CTR (gray) and LAMP5::TOX (orange). (e) Cumulative ratio of signal-noise-ratio (SNR) for LAMP5::CTR (gray) and LAMP5::TOX (orange). (f) Cumulative ratio of signal correlation of visual responses for LAMP5::CTR (gray) and LAMP5::TOX (orange). (g) Cumulative ratio of global orientation selective index (gOSI) for LAMP5::CTR (gray) and LAMP5::TOX (orange). Error bar represents SEM. Hierarchical bootstrap was used for testing statistical significance. See supplementary data 1 - Table 3 for statistics.
Figure 4.
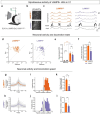
Figure 4.. Spontaneous activity of LAMP5+ cINs is correlated with locomotion speed.
(a) Illustration of the experimental setup during the spontaneous activity recordings. The animal was presented with a gray screen (mean luminance) while the GCaMP signal was imaged with two-photon microscopy. (b) A representative mean projection image from a two-photon recording session in L2/3 (upper) or L1 (bottom) LAMP5+ cINs in V1 of DLX-Cre; LAMP5-FlpO; Ai195jGCaMP7s. (c) Example traces from spontaneous activity recordings in LAMP5L23 (left, in orange) and LAMP5L1 (right, in purple). The top four traces represent the standardized dF/F0 activity of four randomly chosen neurons during a randomly selected time interval. The activity traces shown here are smoothed for representation. The black trace indicates the animal’s locomotion speed (in cm/s), and the gray trace shows the z-scored pupil size, both measured concurrently. (d) Scatter plot showing the mean standardized dF/F0 during stationary and running periods for LAMP5L23 (left, in orange) and LAMP5L1 (right, in purple). Each dot represents a neuron. (e) Bar plot showing the mean standardized dF/F0 during stationary (white bar) and run (color filled bar) periods for LAMP5L23 (orange) and LAMP5L1 (purple). (f) Bar plot showing ratio of neurons with increased activity during running periods. (g-h) Zero-time cross-correlation analysis of neuronal activity between (g) LAMP5L23 (orange) or (h) LAMP5L1 (purple), and locomotion speed. (i-j) Histogram of Pearson’s correlation coefficient (same as cross-correlation value at zero-time) of (i) LAMP5L23 (orange) or (j) LAMP5L1 (purple) activity and locomotion speed. Gray bars represent pairs with no significant correlation and colored bars represent pairs with significant correlation, determined by comparing against shuffled time series for each pair for 1000 times (refer to Methods). (k) Bar plot showing ratio of neurons with significant correlation between the spontaneous activity and locomotion speed for LAMP5L23 (orange) or LAMP5L1 (purple). (l) Bar plot showing Pearson’s correlation coefficient of the spontaneous activity and locomotion speed for LAMP5L23 (orange) or LAMP5L1 (purple). Error bar represents SEM. Each dot in the bar plots represents data from an individual mouse. Mann-Whitney test (f,k), mixed linear model regression (e) and hierarchical bootstrap (l) were used for testing statistical significance. See supplementary data 1 - Table 4 for statistics.
Figure 5.
Figure 5.. Visual responses and their modulation by locomotion are distinct in LAMP5L23 and LAMP5L1.
(a) Illustration of the experimental trial design. After a baseline of 10 s with the gray screen, mice were presented with random 3s visual stimuli trials which each had 2s of full-screen moving gratings with variable contrast and orientations in each trial. 1s of inter-stimulus-interval was used with the gray screen. Six contrast levels (5%, 10%, 20%, 40%, 60% and 80%) and eight orientations (every 45°) were included in the task and each combination was randomly repeated for 15 trials. In addition, we included blank trials (0% contrast) randomly. Each blank trial consisted of 3s of gray screen. (b) Ratio of high (60–80%) or low (5–10%) contrast preferring neurons in LAMP5L23 (orange), LAMP5L1 (purple), VIPL23 (green), SSTL23 (blue) and PYNL23 (gray). Each dot represents data from an individual animal. VIPL23/SSTL23 results were from Germline-Cre; VIP-FlpO/SST-FlpO; Ai195 mice (Ai195 is an intersectional reporter and this converts them into a Flp-reporter). PYNL23 results were from TOX-control animals with AAV.GCaMP6f. (c) Cumulative ratio of the center of mass in contrast response for each neuron in LAMP5L23 (orange), LAMP5L1 (purple), VIPL23 (green), SSTL23 (blue) and PYNL23 (gray). (d) Visual responses at various contrast levels in LAMP5L23 population. (e) Averaged response trace in (left) low (5–10%) or (right) high (60–80%) contrasts for LAMP5L23. (f) Visual responses at various contrast levels in LAMP5L1 population. (g) Averaged response trace in (left) low (5–10%) or (right) high (60–80%) contrasts for LAMP5L1. (h) Visual responses at various contrast levels in LAMP5L23 population during running (orange) or stationary (black) trials. (i) Averaged response trace in (left) low (5–10%) or (right) high (60–80%) contrasts for LAMP5L23 during running (orange) or stationary (black) trials. (j) Visual responses at various contrast levels in LAMP5L1 population during running (purple) or stationary (black) trials. (k) Averaged response trace in (left) low (5–10%) or (right) high (60–80%) contrasts for LAMP5L1 during running (purple) or stationary (black) trials. In (d,f,h,j), each gray line and dot represent averaged data from an animal, while color line represents mean and SEM from all neurons. Responses at 0% contrast (‘blank trial’) were indicated by dot. In (e,g,i,k), moving gratings were presented between 0–2 s indicated by dashed gray vertical lines. The color lines represent mean and SEM from all animals. Mann Whitney test (b) and mixed linear model regression (d,f,h,j) were u sed for testing statistical significance. See supplementary data 1 - Table 5 for statistics.
Figure 6.
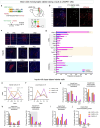
Figure 6.. Brain-wide monosynaptic inputs to LAMP5+ cINs in V1 reveal layer-dependent circuit connectivity of LAMP5+ cINs.
(a) Experimental design of rabies retrograde tracing from LAMP5+ cINs in V1. Helper AAVs, AAV1.Dlx.DIO.TVA and AAV1.DLX.DIO.GFP.N2cG (green), were co-injected with EnVA-pseudotyped CVS-N2c(ΔG)-FlpO-mCherry rabies virus (red) into V1 of JAM2-Cre mice. Rabies tracing patterns were analyzed 13 days post-infection. GFP+ cells represent N2cG protein expression, while mCherry+ cells indicate presynaptically traced neurons. Cells positive for both GFP and mCherry were identified as starter cells. (b) Example images showing starter cells in V1 (write arrow). Scale bar = 100 μm. (c) Example images showing brain regions with significant inputs. Scale bar = 100 μm. (d) Presynaptic inputs to LAMP5+ cINs in V1 were quantified as the percentage of rabies traced cells in each region out of the total number of cells labeled in the brain. Regions with >1% of inputs are included in the plot. Inputs from the ipsilateral side are colored in magenta, while those from the contralateral side are in blue. (e) Starter cell layer distribution for 3 experimental repeats, Ms#1 (gray) had starter cells biased to deep layers L5-6, Ms#2 (orange) had starter cells biased to middle layers L2-5, while Ms#3 (purple) had starter cells biased to L1. (f) Local inputs across cortical layers normalized to total local inputs (mCherry+, GFP- cells in V1) in V1 for 3 experimental repeats. (g-j) Inputs from ipsilateral visual areas, contralateral visual areas, ipsilateral non-visual sensory areas, ipsilateral motor and frontal areas, ipsilateral visual thalamus, and putative neuromodulatory areas, such as PAL (putative cholinergic projection neurons in pallidum), MB (RAmb) (putative serotonergic neurons) and HB (putative noradrenergic neurons) for 3 experimental repeats. The error bars represent SEM. Data was collected from N=3 animals. Abbreviations: ACA: anterior cingulate area, AUD: auditory areas, cV1: contralateral primary visual area, cHVAs: contralatera l higher-order visual areas, ECT: ectorhinal area, HB: hindbrain, HVAs: higher-order visual areas, LD: lateral dorsal nucleus of thalamus, LGd: dorsal part of the lateral geniculate complex, LP: lateral posterior nucleus of the thalamus, MB: midbrain, MOs: secondary motor area, ORB: orbital area, PAL: pallidum, PO: posterior complex of the thalamus, RAmb: midbrain raphe nuclei, RSP: retrosplenial area, SSs: supplemental somatosensory area, SSp: primary somatosensory area, TEa: temporal association area, VISa: anterior area, VISal: anterolateral visual area, VISl: lateral visual area, VISli: laterointermediate area, VISpm: posteromedial visual area, VISp(V1): primary visual area, VISrl: rostrolateral visual area.

Similar articles

References

    1. Tremblay R., Lee S. & Rudy B. GABAergic Interneurons in the Neocortex: From Cellular Properties to Circuits. Neuron 91, 260–292 (2016). - PMC - PubMed
    1. Fishell G. & Kepecs A. Interneuron Types as Attractors and Controllers. Annu. Rev. Neurosci. 43, 1–30 (2020). - PMC - PubMed
    1. Kepecs A. & Fishell G. Interneuron cell types are fit to function. Nature 505, 318–326 (2014). - PMC - PubMed
    1. Zeng H. What is a cell type and how to define it? Cell 185, 2739–2755 (2022). - PMC - PubMed
    1. Rudy B., Fishell G., Lee S. & Hjerling-Leffler J. Three groups of interneurons account for nearly 100% of neocortical GABAergic neurons. Dev. Neurobiol. 71, 45–61 (2011). - PMC - PubMed

Publication types