[Preprint]. 2024 Jun 9:2024.06.09.597974.
doi: 10.1101/2024.06.09.597974.

Three-dimensional chromatin mapping of sensory neurons reveals that cohesin-dependent genomic domains are required for axonal regeneration

Affiliations

Three-dimensional chromatin mapping of sensory neurons reveals that cohesin-dependent genomic domains are required for axonal regeneration

Ilaria Palmisano et al. bioRxiv. .

Update in

Abstract

The in vivo three-dimensional genomic architecture of adult mature neurons at homeostasis and after medically relevant perturbations such as axonal injury remains elusive. Here we address this knowledge gap by mapping the three-dimensional chromatin architecture and gene expression programme at homeostasis and after sciatic nerve injury in wild-type and cohesin-deficient mouse sensory dorsal root ganglia neurons via combinatorial Hi-C and RNA-seq. We find that cohesin is required for the full induction of the regenerative transcriptional program, by organising 3D genomic domains required for the activation of regenerative genes. Importantly, loss of cohesin results in disruption of chromatin architecture at regenerative genes and severely impaired nerve regeneration. Together, these data provide an original three-dimensional chromatin map of adult sensory neurons in vivo and demonstrate a role for cohesin-dependent chromatin interactions in neuronal regeneration.

Keywords: 3D chromatin architecture; Axon Regeneration; Epigenetics; Hi-C; cohesion.


Conflict of interest statement

COMPETING INTEREST All the authors declare no competing interests

Figures

Figure 1.
Figure 1.. Loss of cohesin impairs nerve regeneration.
(A-B) Representative micrographs and quantification of SCG10 intensity at the indicated distances from the lesion site in sciatic nerves from AAV-GFP or AAV-Cre-GFP injected Scc1flox/flox mice at 7 days following SNC. Asterisk marks the lesion site; scale bar, 1mm. (mean±s.e.m of n=5 nerves from 4 AAV-GFP mice and n=6 nerves from 4 AAV-Cre-GFP mice; **P<0.05, ****P<0.0001, 2-way Anova, Sidak’s multiple comparisons test). (C) Bar charts of the regeneration index in AAV-GFP or AAV-Cre-GFP injected Scc1flox/flox mice at 7 days after SNC (mean±s.e.m of n=5 nerves from 4 AAV-GFP mice and n=6 nerves from 4 AAV-Cre-GFP mice; two-sided unpaired Student’s t-test). (D) Micrographs showing GFP (green) and CTB (magenta) signal in DRG 4 days after injection of CTB in the tibialis anterioris and gastrocnemius muscle 14 days after SNC. Arrowheads mark GFP positive neurons. Scale bar, 100 μm. (E) Bar graphs of the CTB positive neurons as percentage of GFP expressing neurons (mean±s.e.m of n=4 mice; two-sided unpaired Student’s t-test). (F) Representative micrographs of PGP9.5 immunostaining with 4′,6-diamidino-2-phenylindole (DAPI) counterstaining in the interdigital hind-paw skin from AAV-GFP or AAV-Cre-GFP injected Scc1flox/flox mice 18 days after SNC. The dashed lines indicate the boundary between the epidermis and dermis; scale bar, 100 μm. (G-H) Quantification of the number of intra-epidermal fibres (IEDF) per millimeter of interdigital skin and the percentage of IEDF versus dermal fibres (DF) (mean±s.e.m of n=5 skins from 4 AAV-GFP mice; n=7 skins from 4 AAV-Cre-GFP mice; two-sided unpaired Student’s t-test).
Figure 2.
Figure 2.. Cohesin-dependent and independent genes.
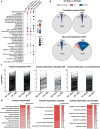
(A) Dot plot of the semantically clustered gene ontology (GO) biological process categories of the upregulated (red) and downregulated (blue) genes in the indicated conditions. Color code reflects the P-value (modified Fisher’s exact P ≤ 0.005) and the size of the dot the gene count in each category (gene count>6). (B) Pie charts of the expression of constitutive (top) and injury-activated (bottom) genes in Rad21 KO neurons in naïve and injured conditions (n=3 independent samples; FDR<0.05). (C) Line plots of the expression in the indicated conditions of the cohesin-independent and dependent (inducible and non-inducible) genes (TPM=transcripts per million). (D) Heatmaps of the semantically clustered GO biological process categories of the cohesin-dependent and independent genes. Color code reflects the P-value (modified Fisher’s exact P ≤ 0.001).
Figure 3.
Figure 3.. Loss of cohesin leads to a decrease in chromatin interactions.
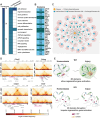
(A) Genome-wide plot of the averaged insulation scores around strong boundaries (the size of flanks around each strong boundary is 400 Kb) in the indicated conditions. (B) P(s) curve (contact probability vs genomic distance) within and between genomic domains of length 300–500 Kb for the indicated conditions. (C) Average Hi-C contact matrices at 10-Kb resolution of the indicated number of 3D chromatin domains of length 300–400 Kb in the indicated conditions. (D) Bar charts of the number of 3D chromatin domains showing an average increased, decreased, and unchanged frequency of contacts (n=3 independent samples; FDR<0.05). (E) Odds ratios analysis of the association between up- and down-regulated genes and differentially expressed genes present in increased, decreased, or unchanged domains; the numbers in red represent the P-value given by two-sided Fisher’s exact test.
Figure 4.
Figure 4.. Regenerative genes reside within cohesin-dependent chromatin domains.
(A) Heatmap of the semantically clustered gene ontology (GO) biological process categories of the downregulated genes in Rad21 KO injured neurons residing within domains that were either lost or showed a decreased contact frequency and unchanged domains. Color code reflects the P value (modified Fisher’s exact P ≤ 0.001). (B) Heatmap showing the residence of RAGs within genomic domains that were either lost or showed a decreased interaction frequency in Rad21 KO neurons. (C) Network visualization of the injury-activated, cohesin-dependent genes (red) (cohesin is depicted in orange). Cohesin-dependent genes are preferentially associated with lost domains (blue=314) and domains with decreased frequency (green=188) with respect to unchanged domains (gray=84). Edges connecting the genes to their genomic domains define the fold change of Hi-C interactions in SNC_KO vs SNC_WT. For a better visualization, all the domains on each chromosome are visualized as a unique circle. (D) Example of Hi-C maps of the contact frequency in the indicated conditions within 3D genomic domains. The contacts between the three successive bins (the one containing TSS and its two neighbors) and bins within a genomic distance of 500 Kb are extracted from 5-Kb Hi-C contact matrices. (E) Cohesin facilitates the formation of 3D genomic domains where regenerative genes are co-regulated. Loss of cohesin disrupts the architecture of 3D genomic domains impairing the activation of the regenerative program.
Figure 5.
Figure 5.. Cohesin-dependent genes engage in longer and more frequent chromatin loops in cortical neurons.
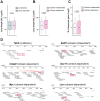
(A) Box plot of the chromatin loop length for injury-activated and constitutive genes in cortical neurons. P-values are computed from a two-sided unpaired Student’s t-test. (B) Box plot of the chromatin loop length for cohesin-dependent and independent genes in cortical neurons. P-values are computed from a two-sided unpaired Student’s t-test. (C) Box plot of the number of chromatin loops for cohesin-dependent and independent genes in cortical neurons. P-values are computed from a two-sided unpaired Student’s t-test. (D) Examples of loops at constitutive, cohesin-dependent and independent genes.
Figure 6.
Figure 6.. Injury-responsive genes display a more immature chromatin looping signature after injury.
(A) Odds ratios analysis of the association between up-, down-regulated genes, cohesin-dependent and independent genes, constitutive genes, versus genes associated to foetal cortical plate and adult neuron E-P loops; the numbers in red represent the P-value given by two-sided Fisher’s exact test. (B) Heatmap of the semantically clustered gene ontology (GO) biological process categories of the upregulated genes associated with foetal cortical plate and downregulated genes associated with adult neuron E-P loops. Color code reflects the P-value (modified Fisher’s exact P ≤ 0.001).

References

    1. Hansen A. S., Cattoglio C., Darzacq X., Tjian R., Recent evidence that TADs and chromatin loops are dynamic structures. Nucleus 9, 20–32 (2018). - PMC - PubMed
    1. Dixon J. R. et al., Topological domains in mammalian genomes identified by analysis of chromatin interactions. Nature 485, 376–380 (2012). - PMC - PubMed
    1. Nora E. P. et al., Spatial partitioning of the regulatory landscape of the X-inactivation centre. Nature 485, 381–385 (2012). - PMC - PubMed
    1. Rao S. S. et al., A 3D map of the human genome at kilobase resolution reveals principles of chromatin looping. Cell 159, 1665–1680 (2014). - PMC - PubMed
    1. Beagrie R. A., Pombo A., Gene activation by metazoan enhancers: Diverse mechanisms stimulate distinct steps of transcription. BioEssays : news and reviews in molecular, cellular and developmental biology 38, 881–893 (2016). - PubMed

Publication types