[Preprint]. 2024 Jun 5:2024.06.04.597473.
doi: 10.1101/2024.06.04.597473.

AGS3-based optogenetic GDI induces GPCR-independent Gβγ signaling and macrophage migration

Affiliations

AGS3-based optogenetic GDI induces GPCR-independent Gβγ signaling and macrophage migration

Waruna Thotamune et al. bioRxiv. .

Update in

Abstract

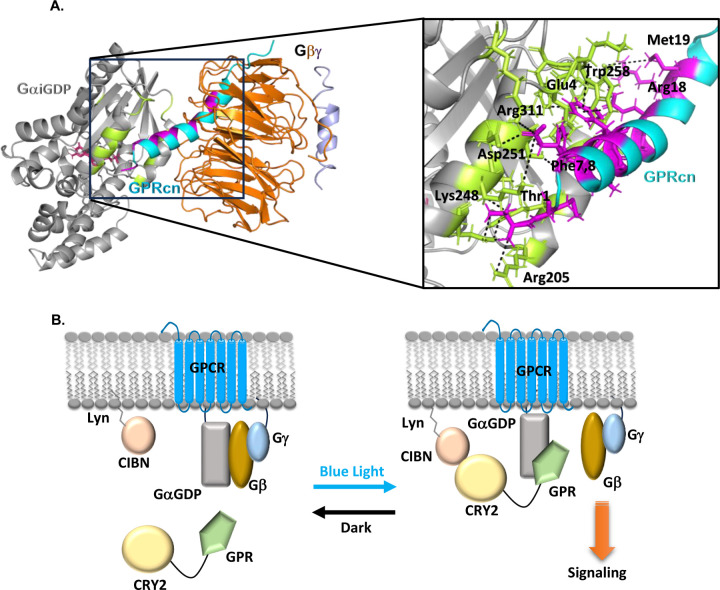
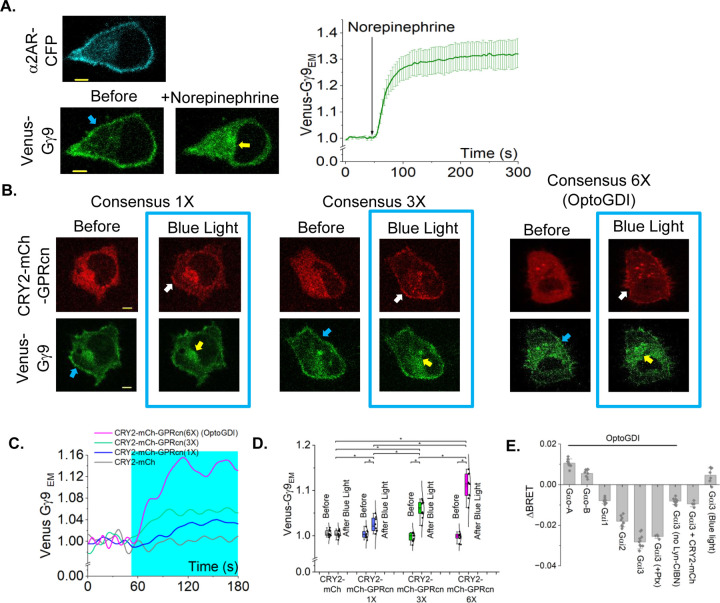
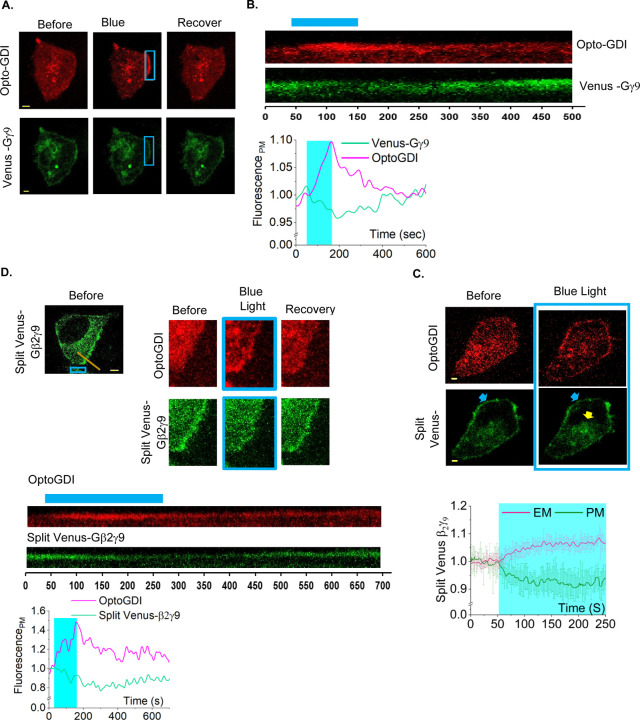
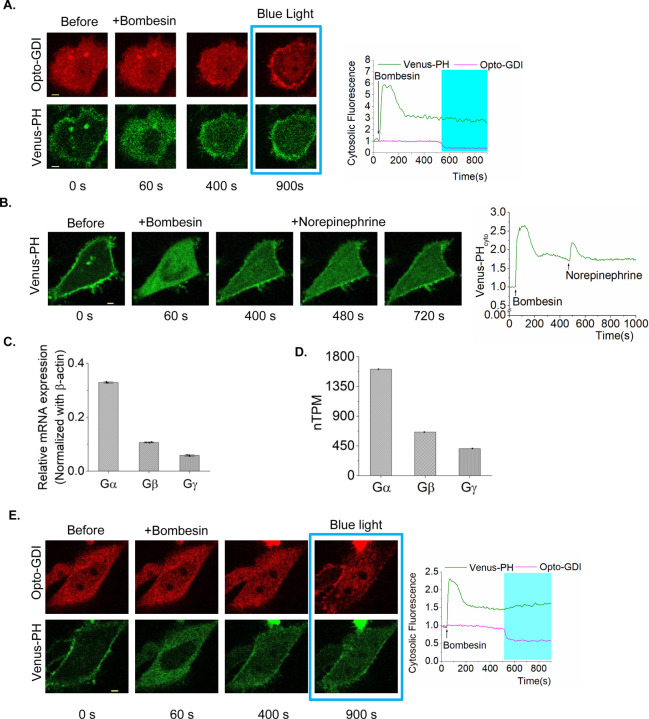
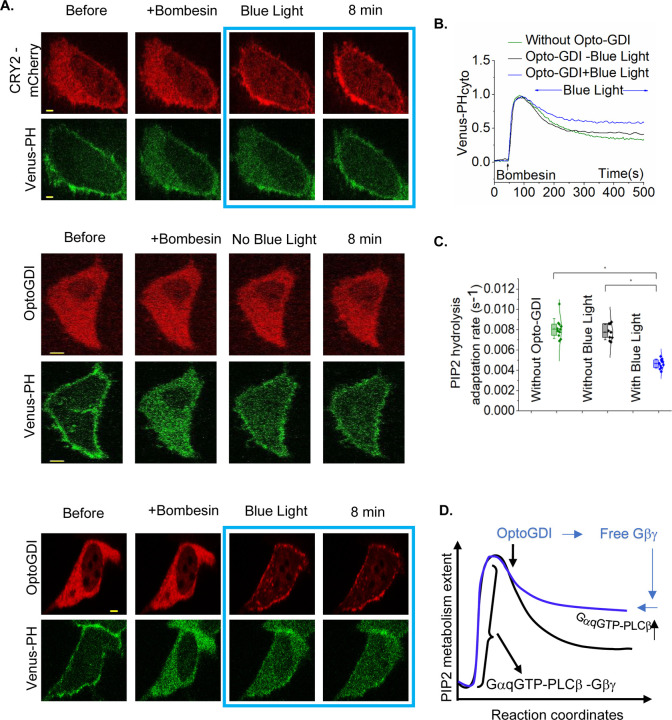
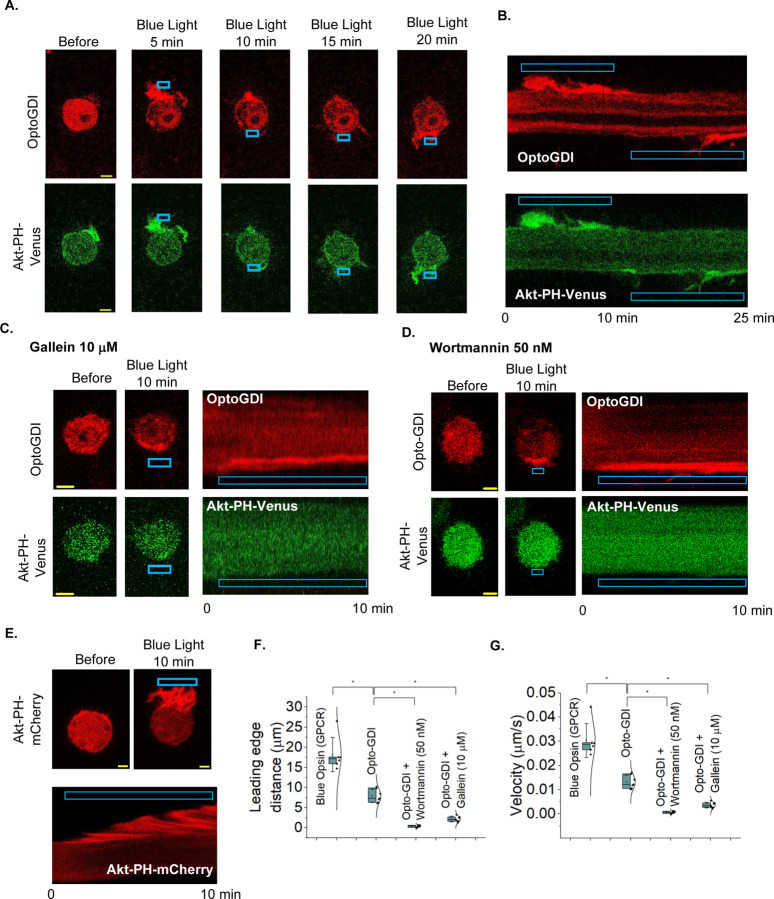
G protein-coupled receptors (GPCRs) are efficient Guanine nucleotide exchange factors (GEFs) and exchange GDP to GTP on the Gα subunit of G protein heterotrimers in response to various extracellular stimuli, including neurotransmitters and light. GPCRs primarily broadcast signals through activated G proteins, GαGTP, and free Gβγ, and are major disease drivers. Evidence shows that the ambient low threshold signaling required for cells is likely supplemented by signaling regulators such as non-GPCR GEFs and Guanine nucleotide Dissociation Inhibitors (GDIs). Activators of G protein Signaling 3 (AGS3) are recognized as a GDI involved in multiple health and disease-related processes. Nevertheless, understanding of AGS3 is limited, and no significant information is available on its structure-function relationship or signaling regulation in living cells. Here, we employed in silico structure-guided engineering of a novel optogenetic GDI, based on the AGS3's G protein regulatory (GPR) motif, to understand its GDI activity and induce standalone Gβγ signaling in living cells on optical command. Our results demonstrate that plasma membrane recruitment of OptoGDI efficiently releases Gβγ, and its subcellular targeting generated localized PIP3 and triggered macrophage migration. Therefore, we propose OptoGDI as a powerful tool for optically dissecting GDI-mediated signaling pathways and triggering GPCR-independent Gβγ signaling in cells and in vivo.

Keywords: Activators of G protein Signaling 3; G proteins; GDI; GPCR; Macrophage migration; Optogenetics.


Conflict of interest statement

Conflict of Interest The authors declare that they have no conflicts of interest concerning the contents of this article.

Figures

Fig. 1:
Fig. 1:. AGS3-GPR consensus peptide interacts with Gai subunit.
(A) Diagram depicting the interactions between GαiGDP- Gβγ and GαiGDP-GPR consensus peptide. GαiGDP- gray, Gβ – orange, Gγ – light blue, GPR motif- cyan. GαiGDP residues that interact with GPR peptide are shown in green. GPR residues that interacts with GαiGDP are shown in pink. (PDB ID 7E9H and 2V4Z) (B) Scheme for optical recruitment of Cryptochrome 2 based GPR peptide to the plasma membrane.
Fig. 2:
Fig. 2:. OptoGDI induces Gβγ translocation upon blue light exposure.
(A) HeLa cells expressing α2AR-CFP and Venus-Gγ9 show robust Gβγ translocation upon 100 mM norepinephrine addition. The plot shows the baseline normalized Venus fluorescence in endomembranes over time. The accumulation of Gγ9 in internal membranes is indicated by yellow arrows. The Venus-Gγ9 loss from the plasma membrane is indicated by the blue arrow (n=10). (B) HeLa cells expressing Venus-Gγ9, Lyn-CIBN, and CRY2- mCh- GPRcn (1X), CRY2- mCh- GPRcn (3X), or CRY2- mCh- GPRcn (6X) (OptoGDI) show different extents of Venus-Gγ9 translocation to the endomembranes, upon blue light exposure. Yellow arrows indicate the accumulation of Gγ9 in internal membranes. The white arrow indicates the plasma membrane recruitment of CRY2-mCherry-GPRcn variants. The Venus-Gγ9 loss from the plasma membrane is indicated by the blue arrow. (C) The plot shows the baseline normalized Venus fluorescence in endomembranes over time. (n= 15 for 1X, n= 14 for 3X, n=17 for Opto-GDI). (D) The whisker box plot compares Gγ9 translocation extents to the basal Gγ9 fluorescence at endomembranes. Blue box indicates the blue light exposure. Average curves were plotted using cells from ≥3 independent experiments. (E) The bar chart showing ∆BRET between Rluc8 tagged Gα and GFP2 tagged γ9 under different experimental conditions. OptoGDI with Gα0-A (n=8), OptoGDI with Gα0-B (n=8) ), OptoGDI with Gαi1 (n=8), OptoGDI with Gαi2 (n=8), OptoGDI with Gαi3 (n=8), OptoGDI with Gαi3 and Ptx (n=4), OptoGDI with Gαi3 but no Lyn-CIBN (n=8), OptoGDI with CRY2-mCh (n=4), and Gαi3 with blue light (n=8). The error bars represent SD (standard deviation). The scale bar = 5 µm. CFP: cyan fluorescent protein; mCh: mCherry; EM: endomembranes; Ptx: Pertussis toxin.
Fig. 3:
Fig. 3:. OptoGDI induces subcellular free Gβγ generation upon blue light exposure.
(A) confined membrane region of a HeLa cell expressing OptoGDI, Lyn-CIBN, and Venus-Gγ9 was exposed to blue light. The cell exhibited a OptoGDI recruitment and Gγ9 translocation only on the blue light exposed region of the cell (n=12). (B) The kymographs and the plot showing the blue light induced OptoGDI recruitment and the Gγ9 loss and the recovery on the plasma membrane. (C) HeLa cells expressing Opto-GDI, Lyn-CIBN, and Split Venus-Gβ2γ9 show detectable free Gβγ translocation upon blue light exposure. The white arrow at the membrane indicates the OptoGDI recruitment after blue light stimulation. The blue arrow indicates Split Venus-Gβ2γ9 fluorescence loss from the plasma membrane. The plot shows the baseline normalized Venus fluorescence in endomembranes and the plasma membrane over time (n=8). (D) HeLa cells expressing OptoGDI, Lyn-CIBN, and Split Venus-Gβ2γ9 show subcellular free Gβγ generation upon blue light exposure to a confined membrane region. Kymographic view of the respective region of the cell shows OptoGDI and Split Venus-Gβ2γ9 dynamics at the plasma membrane over time. The orange line on the cell image indicates the membrane region used to create the kymograph. (n=12). Yellow arrows indicate the Venus Fluorescence increase on the plasma membrane when Opto-GDI is cytosolic. Average curves were plotted using cells from ≥3 independent experiments. The blue box indicates blue light exposure. The error bars represent SD (standard deviation of mean). The scale bar = 5 µm.
Fig. 4:
Fig. 4:. OptoGDI induces secondary PIP2 hydrolysis in Gq-GPCR activated cells.
(A) HeLa cells expressing GRPR, Venus-PH, OptoGDI and Lyn-CIBN exhibited robust PIP2 hydrolysis upon 1 μM bombesin addition. OptoGDI was then recruited to the plasma membrane after the PIP2 hydrolysis reached equilibrium. The cells didn’t exhibit a rescue of PIP2 hydrolysis (n=15). (B) GRPR in HeLa cells expressing α2AR-CFP and Venus-PH was activated using 1 μM bombesin and the cells exhibited robust PIP2 hydrolysis. α2AR was then activated using 100 μM norepinephrine after the PIP2 hydrolysis reached the equilibrium. The cells exhibited robust secondary PIP2 hydrolysis indicating the PIP2 hydrolysis rescue (n=10). (C) Normalized relative mRNA expression level from RNAseq data of HeLa cells showing elevated expression of endogenous G-protein α compared to G-protein β and γ, normalized to the mRNA expression level of β-actin. (n=3) (D) Normalized transcripts per million (nTPM) levels of human G-protein α, β and γ levels from Human protein Atlas showing the elevated level of G-protein α, compared to the G-protein β and γ. (E) HeLa cells expressing GRPR, Venus-PH, Gβ1, Lyn-CIBN and OptoGDI were exposed to 1 μM bombesin. OptoGDI was then recruited to the plasma membrane of the cell after the PIP2 hydrolysis reached equilibrium. The cell showed detectable secondary PIP2 hydrolysis as indicated by the Venus-PH translocation to the cytosol. (n=12). The scale bar = 5 µm. Blue box indicates the blue light exposure. GRPR: Gastrin Releasing Peptide receptor; PIP2: Phosphatidylinositol 4,5-bisphosphate; PM: plasma membrane; PH: Pleckstrin Homology; Cyto: cytosolic fluorescence.
Fig. 5:
Fig. 5:. OptoGDI modulates PLCβ-induced PIP2 hydrolysis.
(A) Top panel- GRPR, Venus-PH, Lyn-CIBN and CRY2-mCh were expressed in HeLa cells and cells were exposed to bombesin first and then exposed to blue light after the PIP2 hydrolysis reached the maximum. CRY2-mCh membrane recruited cells exhibited the typical PIP2 hydrolysis response followed by a PIP2 hydrolysis attenuation (n =11). Middle panel- HeLa cells expressing GRPR, Venus –PH, Lyn-CIBN, and OptoGDI showed robust PIP2 hydrolysis upon bombesin addition. The PIP2 hydrolysis attenuation rates were also similar to the previous condition (n=9). Bottom panel- HeLa cells expressing GRPR, Venus-PH, Lyn-CIBN and OptoGDI were first exposed to bombesin and then exposed to blue light and Opto-GDI was recruited to the plasma membrane when the PIP2 hydrolysis reached the maximum. The cells showed a robust PIP2 hydrolysis upon bombesin addition. The PIP2 hydrolysis attenuation rates were significantly lower than the control cells (n=11). (B) The corresponding plot shows the PIP2 sensor dynamics in the cytosol of the cells. (C) The whisker box plot shows the statistical differences in PIP2 hydrolysis attenuation rates between the control cells and OptoGDI recruited cells. (D) The schematic representation shows the mechanism of PIP2 hydrolysis attenuation. The scale bar = 5 µm. Blue box indicates the blue light exposure. GRPR: Gastrin Releasing Peptide receptor; mCh: mCherry fluorescent protein; PIP2: Phosphatidylinositol 4,5-bisphosphate; Cyto: cytosolic fluorescence; PH: Pleckstrin Homology.
Fig. 6:
Fig. 6:. OptoGDI-triggered subcellular Gβγ induced PIP3 generation, and macrophage migration.
(A) RAW cells expressing OptoGDI, Lyn-CIBN, and AKT-PH-Venus were optically activated to recruit OptoGDI to a confined region (top). The cell shows localized PIP3 production (bottom panel images) and the optogenetic activation of PIP3 production resulted in a detectable cell migration response towards the blue light. The blue box indicates the photoactivation (n=10). (B) Kymographs of the same cell show the accumulation of OptoGDI (red) and Akt-PH-Venus (green) in the leading edge of the migrating cell. (C) RAW 264.7 cells transfected with OptoGDI, Lyn-CIBN, and Akt-PH-Venus were subjected to localized optical activation in the presence of 10 μM gallein (Gβγ inhibitor). Cells were incubated with the inhibitor for 30 min at 37 °C before imaging and optical activation. The cells did not show a detectable migration or PIP3 generation. Kymographs of the same cell show the accumulation of OptoGDI (red) in the leading edge of a cell but no Akt-PH-Venus (green) accumulation (n=10). The blue box indicates photoactivation. (D) RAW 264.7 cells transfected with OptoGDI, Lyn-CIBN, and Akt-PH-Venus were subjected to localized optical activation in the presence of 50 nM wortmannin (PI3K inhibitor). Cells were incubated with the inhibitor for 30 min at 37 °C before imaging and optical activation. The cells did not show a detectable migration or PIP3 generation. Kymographs of the same cell show the accumulation of OptoGDI (red) in the leading edge of the cell but no detectable accumulation of the Akt-PH-Venus (green). The blue box indicates the photoactivation (n=12). (E) RAW 264.7 cells transfected with Blue Opsin and AKT-PH-mCherry were subjected to localized optical activation with confined blue light (Blue box), after the 50 mM 11-cis-retinal treatment. The cell showed an optogenetic activation induced localized PIP3 production and robust migration response towards the blue light. The kymograph of the same cell shows the accumulation of Akt-PH-mCherry (red) at the leading edge of the cell, indicating the PIP3 generation (n=9). (F)The whisker plot shows the extent of movement of the peripheries of the leading edge of control and pharmacologically perturbed RAW 264.7 cells in C-D. (G) The whisker plot shows the extent of migration velocities of the peripheries of the leading edge of the RAW cells in A-E. Average curves were plotted using cells from ≥3 independent experiments. The error bars represent SD (standard deviation of the mean). The scale bar = 5 µm.

Similar articles

References

    1. Tuteja N. Signaling through G protein coupled receptors. Plant Signal Behav. 2009;4(10):942–7. - PMC - PubMed
    1. Zhang Y, Devries ME, Skolnick J. Structure modeling of all identified G protein-coupled receptors in the human genome. PLoS Comput Biol. 2006;2(2):e13. - PMC - PubMed
    1. Yang D, Zhou Q, Labroska V, Qin S, Darbalaei S, Wu Y, et al. G protein-coupled receptors: structure- and function-based drug discovery. Signal Transduct Target Ther. 2021;6(1):7. - PMC - PubMed
    1. Saggu S, Chen Y, Cottingham C, Rehman H, Wang H, Zhang S, et al. Activation of a novel alpha(2A)AR-spinophilin-cofilin axis determines the effect of alpha(2) adrenergic drugs on fear memory reconsolidation. Mol Psychiatry. 2023;28(2):588–600. - PMC - PubMed
    1. Roux BT, Cottrell GS. G protein-coupled receptors: what a difference a ‘partner’ makes. Int J Mol Sci. 2014;15(1):1112–42. - PMC - PubMed

Publication types