[Preprint]. 2024 Jun 3:2024.06.03.597159.
doi: 10.1101/2024.06.03.597159.

Mechanism of how the universal module XMAP215 γ-TuRC nucleates microtubules

Affiliations

Mechanism of how the universal module XMAP215 γ-TuRC nucleates microtubules

Collin T McManus et al. bioRxiv. .

Abstract

It has become increasingly evident in recent years that nucleation of microtubules from a diverse set of MTOCs requires both the γ-tubulin ring complex (γ-TuRC) and the microtubule polymerase XMAP215. Despite their essentiality, little is known about how these nucleation factors interact and work together to generate microtubules. Using biochemical domain analysis of XMAP215 and structural approaches, we find that a sixth TOG domain in XMAP215 binds γ-TuRC via γ-tubulin as part of a broader interaction involving the C-terminal region. Moreover, TOG6 is required for XMAP215 to promote nucleation from γ-TuRC to its full extent. Interestingly, we find that XMAP215 also depends strongly on TOG5 for microtubule lattice binding and nucleation. Accordingly, we report a cryo-EM structure of TOG5 bound to the microtubule lattice that reveals promotion of lateral interactions between tubulin dimers. Finally, we find that while XMAP215 constructs' effects on nucleation are generally proportional to their effects on polymerization, formation of a direct complex with γ-TuRC allows cooperative nucleation activity. Thus, we propose that XMAP215's C-terminal TOGs 5 and 6 play key roles in promoting nucleation by promoting formation of longitudinal and lateral bonds in γ-TuRC templated nascent microtubules at cellular MTOCs.


Figures

Fig. 1.
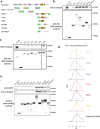
Fig. 1.. A unique TOG6 domain exists in the C-terminal region of XMAP215.
a) AlphaFold2 prediction of the XMAP215 C-terminal region including all residues after TOG5 (aa1463–2065). TOG6 and the four helix bundle “ext” domain are shown in orange. Other residues are gray. b) TOG6 AlphaFold2 prediction superimposed on the electron density map derived by X-ray crystallography using molecular replacement. Resolution about 5.7Å. c) Schematics of XMAP215 orthologs from Homo sapiens (H.s.), Mus musculus (M.m), Xenopus laevis (X.l.), Drosophila melanogaster (D.m), Caenorhabditis elegans (C.e.), Saccharomyces cerevisiae (S.c.), and Saccharomyces pombe (S.p.) “+++” indicates positively changed linker domains. Created with Biorender.com d) Percent identity matrix from Clustal Omega alignment of TOG6 homologous domains from the higher order eukaryotic orthologs in C and superimposition of those domains. e) Percent identity matrix from Clustal Omega alignment of four helix bundle “ext” homologous domains from the higher order eukaryotic orthologs in C and superimposition of those domains. f) TOG domains 1, 2, 3, 4, 5, and 6 extracted from the AlphaFold2 prediction for full length X. laevis XMAP215 and superimposed for comparison. N-termini are positioned to the left, and C-termini to the right. In the images to the left of the arrow, the canonical tubulin binding surfaces are positioned downwards. In the rotated images to the right of the arrow, the non-tubulin binding surface is shown. Colored lines illustrate the kink or lack thereof which occurs between heat repeats C and D.
Fig. 2.
Fig. 2.. TOG6 specifically binds γ-tubulin and is sufficient to bind γ-TuRC
a) Schematic of full length XMAP215 and GFP-tagged constructs used in B-E. Created with Biorender.com b-c) Western blot analysis of bead samples from 1μM human γ-tubulin pulldowns using saturated anti-GFP resin. This is representative of three replicates performed. d) Chromatograms from gel filtration of 5μM TOG domain constructs mixed with 5μM bovine brain tubulin. The theoretical peak (black) was created by first averaging the traces from all TOG domain control runs and adding this average to the trace of the tubulin-alone control (Fig. S2a). Colored peaks represent observed shifts of each TOG+Tubulin binding reaction from individually calculated theoretical peaks (Fig. S2a). e) Western blot analysis of bead samples from a X. laevis γ-TuRC pulldown using 10ul of peak sucrose gradient fractions (Fig. S2c) and saturated anti-GFP resin. This is representative of three replicates performed, except for TOGs 1, 2, 3, and 4 for which two replicates were performed.
Fig. 3.
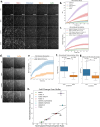
Fig. 3.. TOG6 and the ext domain promote microtubule nucleation by localizing XMAP215 to γ-TuRC
a) Schematic illustrating the setup of our single filament nucleation assays. Passivated biotin-PEG coverslips are used to make flow channels (left), and biotinylated γ-TuRCs are tethered to the coverslips via neutravidin (right). Reaction mixes including 7% Alexa Fluor 568 labeled tubulin and XMAP215-GFP constructs or control buffer are flowed in and imaged using time-lapse TIRF microscopy. b) Time-lapse images from single filament microtubule nucleation reactions described in A, using 7μM tubulin and 20nM XMAP215-GFP constructs. Microtubules are white against a dark background. c) Plot of microtubule intensity over time for the reactions in B. The averages of at least three reactions are plotted with the shaded region representing the corresponding SEM. d) Plot of cumulative γ-TuRC nucleated microtubules over time in the reactions from B. The averages of at least three reactions are plotted with the shaded region representing the corresponding SEM. Nmax is the calculated maximum number of microtubules nucleated and k is the calculated nucleation rate (see methods). e) Kymographs representing the various microtubule minus-end binding behaviors observed for XMAP215-GFP constructs in the reactions in B. Alexa568-Tubulin is red and XMAP215-GFP is green. f-g) Bar plots illustrating the percentage of kymographs exhibiting XMAP215-GFP construct localization at the microtubule minus end before and after microtubule nucleation, respectively, from reactions in B. A proportions Z-test was performed. n.s. represents p≥0.05, * represents 0.05>p>0.01, ** represents 0.01>p>0.001, and *** represents 0.001>p.
Fig. 4.
Fig. 4.. TOG5 promotes microtubule nucleation as part of larger XMAP215 constructs and on its own
a) Time-lapse images from single filament microtubule nucleation reactions using 7μM tubulin and 20nM XMAP215-GFP constructs. Microtubules are white against a dark background. b) Plot of microtubule intensity over time for the reactions in A. The averages of at least three reactions are plotted with the shaded region representing the corresponding SEM. c) Plot of cumulative γ-TuRC nucleated microtubules over time in the reactions from A. The averages of at least three reactions are plotted with the shaded region representing the corresponding SEM. Nmax is the calculated maximum number of microtubules nucleated and k is the calculated nucleation rate (see methods). d) Time-lapse images from single filament microtubule nucleation reactions using 10μM tubulin and 1μM TOG5-GFP and a Buffer control. Microtubules are white against a dark background. e) Cumulative γ-TuRC nucleated microtubule plot comparable to that in C for TOG5-GFP and buffer reactions from D. f) Box and whisker plots of microtubules polymerization rate and g) maximum microtubule length for the reactions in D. Plots represent data from at least three reactions. Student’s t-test was performed to compare the mean values calculated from each individual reaction for each condition. μ represents the overall average. n.s. represents p≥0.05, * represents 0.05>p>0.01, ** represents 0.01>p>0.001, and *** represents 0.001>p. h) Plot of measured polymerization rates and calculated nucleation rates from single filament γ-TuRC nucleation reactions in the presence of the various XMAP215-GFP constructs normalized to the buffer control. Values from constructs used in Fig. 3 were further normalized according to the full-length XMAP215. Error bars represent one standard deviation derived for each construct from the average polymerization rates in its constituent reactions, and from the fits of the best fit lines in S3B, S5A, and S5E (see methods). The dashed line is a best fit calculated from all constructs except full-length XMAP215, which was excluded as an extreme outlier, y = 4.7478x - 3.9778, R2 = 0.9788.
Fig. 5.
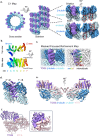
Fig. 5.. Structure of TOG5 bound to the GMPCPP microtubule
a) C1 reconstruction of the TOG5 decorated GMPCPP microtubule. TOG5 density is in purple, ɑ-tubulin in light blue, and β-tubulin in dark blue. Leftmost is a cross section of the reconstruction, the face of which is shown immediately to the right with the microtubule seam centered and the plus end pointed upwards. Dashed lines point towards cropped portions of the C1 map from the Β-lattice (top right) and seam (bottom right). Here, the s9-s10 loops are circled in dashed red. b) AlphaFold2 prediction of XMAP215 TOG5 colored from N-terminus (blue) to C-terminus (red). The top view shows the non-tubulin binding surface. Constituent HEAT repeats (HRs) labels are colored correspondingly with the model. c) A focused refinement map generated using a mask around two tubulin dimers and the TOG5 density at a location opposite the microtubule seam. Left, density is colored by constituent monomer, right TOG5 density is purple, microtubule density is in light gray, and the rainbow AlphaFold2 TOG5 model is docked into the corresponding density. d) Model of TOG5 bound to two GMPCPP lattice incorporated tubulin dimers. The primary and neighboring secondary tubulin dimers bound are indicated 1° αβ and 2° αβ respectively. e) Model from D, secondary tubulin dimer not shown, superimposed with Stu2 TOG1 bound to curved tubulin shown in pink (PDB 4FFB). Models are aligned on the β-tubulin subunit. Pink arrows show displacement of the 4FFB ɑ-tubulin subunit relative to that from our model. The purple arrow shows displacement of TOG5 helices relative to those of TOG1. N- and C-termini of TOG5 are labeled N and C. f) Licorice model of TOG5 and 4FFB αβ-tubulin from E, with clashing residues shown as spheres. Inset shows magnification of clashing residues.
Fig. 6.
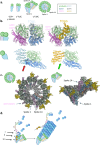
Fig. 6.. XMAP215 may recognize specific spokes of γ-TuRC to promote microtubule nucleation
All panels of this figure were at least in part created with Biorender.com. a) Schematic of γ-TuRC and some of its constituent sub-complexes. b) Models of how XMAP215 TOG1 and TOG6 may interact with γ-tubulin as part of the γ-TuSC sub-complex. Top depicts a ribbon model of the TOGs’ modeled interaction with the γ-TuSC from a perspective outside the γ-TuRC ring. Bottom depicts a side view of licorice model with each TOG and GCP2. Clashing residues are shown as spheres and indicated by a red arrow, and the absence of such a clash is indicated by a green arrow. c) Models of how XMAP215 could interact with γ-TuRC spokes 9–12 by TOG6 interaction with γ-tubulin. d) Schematic representing a model for the activity of the XMAP215/γ-TuRC nucleation module. i) TOG5 binds tubulin assembling on γ-TuRC, ii) TOG6 binds γ-tubulin, and iii) an additional interaction between the XMAP215 C-terminal region and γ-TuRC occurs. TOG domains are labeled on the left with numbers, and the C-terminal four helix bundle is likewise labeled “ext.”

Similar articles

References

    1. Petry S. & Vale R. D. Microtubule nucleation at the centrosome and beyond. Nat. Cell Biol. 17, 1089–1093 (2015). - PubMed
    1. Wu J. & Akhmanova A. Microtubule-Organizing Centers. (2017). - PubMed
    1. Travis S. M., Mahon B. P. & Petry S. How Microtubules Build the Spindle Branch by Branch. Annu. Rev. Cell Dev. Biol. 38, 1–23 (2022). - PMC - PubMed
    1. Thawani A., Kadzik R. S. & Petry S. XMAP215 is a microtubule nucleation factor that functions synergistically with the γ-tubulin ring complex. Nat. Cell Biol. 20, 575–585 (2018). - PMC - PubMed
    1. Ali A., Vineethakumari C., Lacasa C. & Lüders J. Microtubule nucleation and γ-TuRC centrosome localization in interphase cells require ch-TOG. Nat. Commun. 14, 289 (2023). - PMC - PubMed

Publication types