[Preprint]. 2024 Jun 8:2024.06.06.597594.
doi: 10.1101/2024.06.06.597594.

LRRK2 mediates haloperidol-induced changes in indirect pathway striatal projection neurons

Affiliations

LRRK2 mediates haloperidol-induced changes in indirect pathway striatal projection neurons

Chuyu Chen et al. bioRxiv. .

Update in

Abstract

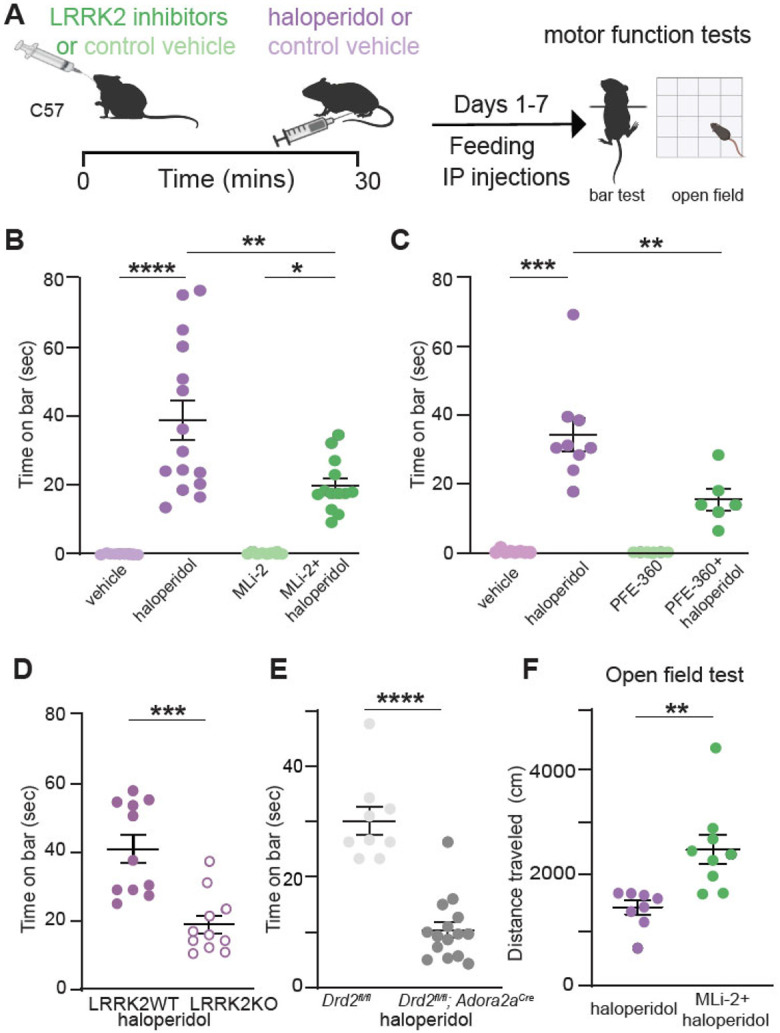
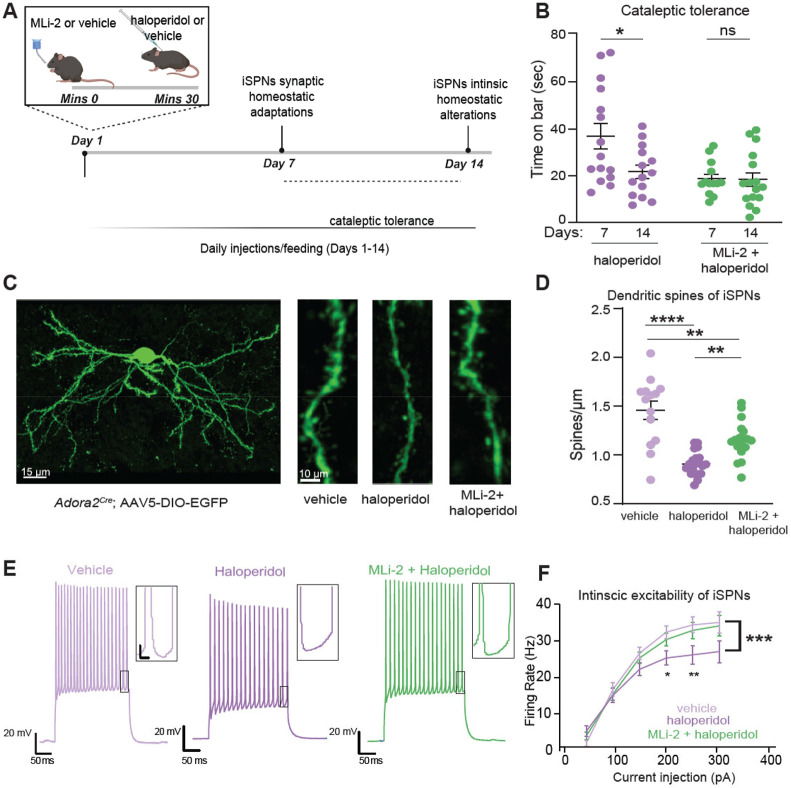
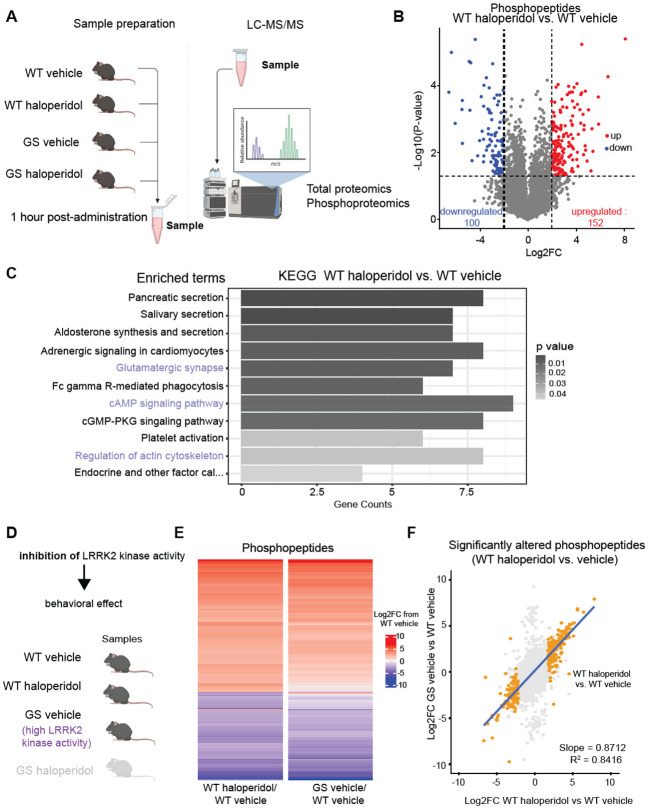
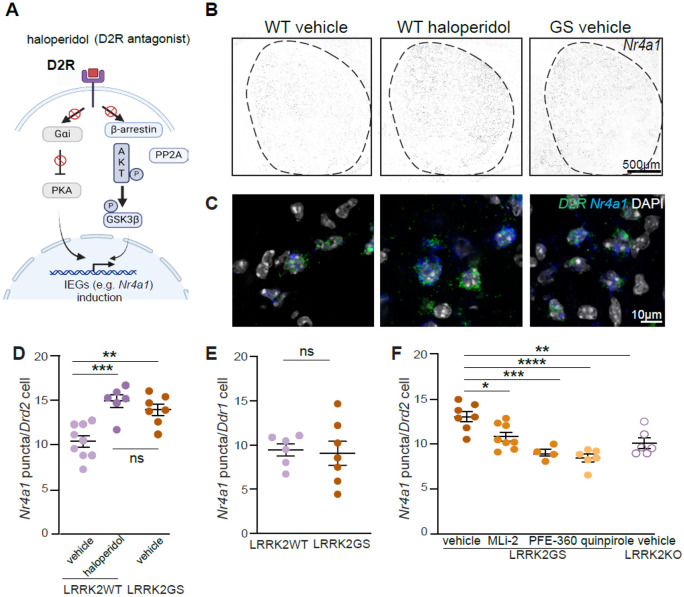
Haloperidol is used to manage psychotic symptoms in several neurological disorders through mechanisms that involve antagonism of dopamine D2 receptors that are highly expressed in the striatum. Significant side effects of haloperidol, known as extrapyramidal symptoms, lead to motor deficits similar to those seen in Parkinson's disease and present a major challenge in clinical settings. The underlying molecular mechanisms responsible for these side effects remain poorly understood. Parkinson's disease-associated LRRK2 kinase has an important role in striatal physiology and a known link to dopamine D2 receptor signaling. Here, we systematically explore convergent signaling of haloperidol and LRRK2 through pharmacological or genetic inhibition of LRRK2 kinase, as well as knock-in mouse models expressing pathogenic mutant LRRK2 with increased kinase activity. Behavioral assays show that LRRK2 kinase inhibition ameliorates haloperidol-induced motor changes in mice. A combination of electrophysiological and anatomical approaches reveals that LRRK2 kinase inhibition interferes with haloperidol-induced changes, specifically in striatal neurons of the indirect pathway. Proteomic studies and targeted intracellular pathway analyses demonstrate that haloperidol induces a similar pattern of intracellular signaling as increased LRRK2 kinase activity. Our study suggests that LRRK2 kinase plays a key role in striatal dopamine D2 receptor signaling underlying the undesirable motor side effects of haloperidol. This work opens up new therapeutic avenues for dopamine-related disorders, such as psychosis, also furthering our understanding of Parkinson's disease pathophysiology.


Conflict of interest statement

Declaration of interests The authors declare no competing interests.

Figures

Figure 1:
Figure 1:. LRRK2 mediates the effects of haloperidol on movement disruption.
A. Schematic of the experiment and treatment schedule. Catalepsy was assessed with the bar test, and distance traveled was recorded in an open-field arena; both were performed 1 hr after the final treatment administration. Treatment conditions: Vehicle for MLi-2, 40% 2-hydroxypropyl-β-cyclodextrin; MLi2, 10 mg/kg; vehicle for PFE-360, 1.25% hydroxypropyl cellulose + 0.5% docusate sodium; PFE-360, 5 mg/kg; vehicle for haloperidol, saline (0.9% NaCl); haloperidol, 1 mg/kg. Some schematics were created with BioRender.com. X axis: vehicle = vehicle for MLi-2+ vehicle for haloperidol; haloperidol = vehicle for MLi-2+haloperidol; MLi-2 or PFE-360 = MLi-2 or PFE-360+vehicle for haloperidol; MLi-2 or PFE-360+haloperidol, as indicated. All drugs were administered intraperitoneally (i.p.) except MLi-2, PFE-360, and their vehicles, which were given orally. B. Cataleptic response of WT mice receiving haloperidol, MLi-2, their combination, and vehicle controls for 7 days. N=9, 15, 8, 13 mice, in order of groups presented. C. Same as B, but using PFE-360, and its corresponding vehicle. N=8, 9, 6, 6 mice, in order of groups presented. D. Cataleptic response of LRRK2-WT and LRRK2-KO mice receiving haloperidol or control vehicle for 7 days. N=11 mice for both genotypes. E. Cataleptic response of Drd2fl/fl and Drd2fl/fl; Adora2acre mice receiving haloperidol for 7 days. N=9 and 15 mice, respectively. F. Distance traveled in the open-field test for WT mice receiving haloperidol or haloperidol + MLi-2. N=8 and 9 mice, respectively. Data are represented as mean±SEM. Asterisks in B-C show statistical significance for Tukey's multiple comparison tests after one-way ANOVA; *p < 0.05, **p< 0.01, ***p < 0.001, ****p < 0.0001. Asterisks in D-F show statistical significance for unpaired t-test comparison; **p< 0.01,***p < 0.001, ****p < 0.0001.
Figure 2.
Figure 2.. LRRK2 interferes with haloperidol induced adaptations in indirect pathway SPNs.
A. Schematic of the proposed timeline for synaptic and cell-intrinsic adaptations with haloperidol treatment, based on a synthesis of current and prior findings. Some of the schematics were created with BioRender.com. B. Cataleptic response of WT mice receiving haloperidol, or haloperidol + MLi-2, at 7 and 14 days following treatments. Haloperidol-treated mice develop tolerance to catalepsy after 14 but not 7 days of haloperidol administration. N=15, 14, 13, 16 mice, in order of groups presented. Data for 7- and 14-day regimens are from panels 1B and Suppl. Fig. 1G, respectively. C. Left, Example of confocal maximum projection image of an Adora2aCre SPN expressing AAV5/DIO-EGFP. Scale bar=15 μm. Right, Examples of dendritic segments in different treatment conditions. Scale bar=10 μm. D. Summary graph of dendritic spine density in iSPNs across treatments. N=14-20 cells, 3 mice/group. E. Example current clamp recording traces in response to a 150 pA current injection in iSPNs of WT mice after 14 days of treatment, as noted. Recordings were performed 24-48 hours after the final injection. Insets: scale 4 mV, 20 ms. F. Summary data show decreased cellular excitability with haloperidol, rescued to control levels by LRRK2 inhibition. Scale, as noted. N=14-29 cells, 4-6 mice/condition. Data are represented as mean±SEM. Asterisks in B show statistical significance for Tukey's multiple comparison tests after two-way ANOVA; *p< 0.05. D shows statistical significance for Tukey's multiple comparison tests after one-way ANOVA**p< 0.01, ****, p<0.0001. Asterisks in F show statistical significance after two-way ANOVA with multiple comparisons. Large asterisk, interaction between treatment and current steps. Small asterisks, significance at specific current steps, determined by Sidak multiple comparisons. *p<0.05.
Figure 3:
Figure 3:. Haloperidol treatment induces similar changes in the striatal phosphoproteome as increased LRRK2 kinase activity.
A. Schematic of experimental procedures. WT and GS mutant mice were treated with haloperidol or vehicle, and striatal samples were harvested after 1 hour. LC-MS/MS analyses for total proteins and phosphopeptides were conducted on the same striatal samples. N=3 mice/group. Parts of the schematic were created with BioRender.com. B. Volcano plot comparing the phosphopeptides between haloperidol and vehicle-treated WT mice. Phosphopeptides that are significantly differentially regulated (∣Log2FC∣ > 2 and unadjusted p-value ≤ 0.05 by multiple unpaired t-tests) are colored red and blue for up- and down-regulated, respectively. C. Results of Gene Set Enrichment Analysis (GSEA) of the KEGG gene set for genes with at least one differentially regulated phosphopeptide in WT haloperidol vs vehicle-treated comparison. Pathways displayed are significantly differently regulated (adjusted p-value ≤ 0.05 by Fisher's test). The length of bars reflects the number of genes in the pathway whose phosphostate is differentially regulated; bars are shaded by adjusted p-value. Highlighted pathways are related to established LRRK2 functions. D. Diagram of genetic and pharmacological conditions for groups analyzed in E. Created with BioRender.com. E. Heatmap of effect size (Log2FC) of either haloperidol treatment or LRRK2-GS for all differentially abundant phosphopeptides in the WT haloperidol-treated vs vehicle-treated comparison (∣Log2FC∣ > 2 and unadjusted p-value ≤ 0.05 by multiple unpaired t-tests). Each bar represents a phosphopeptide. Color reflects Log2FC difference from WT saline condition. F. Correlation plot for E, comparing GS vehicle/WT vehicle to WT haloperidol-vehicle effect size. All detected phosphopeptides were mapped, and phosphopeptides significantly altered between WT haloperidol vs. vehicle are highlighted. Only highlighted values are used for correlation calculation. Blue line represents the line of best fit.
Figure 4.
Figure 4.. LRRK2 regulates the D2R mediated increase of Nr4a1 in indirect pathway SPNs.
A. Signaling cascades leading to IEGs upregulation in iSPNs. D2R antagonist (haloperidol) releases the inhibition of cAMP and activates PKA, leading to upregulation of IEGs (canonical pathway). D2R blockade prevents the reduction of AKT activity, increasing GSK3β phosphorylation/inactivation. Inhibition of GSK3β elicits IEG expression. Created with BioRender.com. B. Example confocal images of Nr4a1 gene expression in the striatum of LRRK2-WT mice treated with haloperidol (1 mg/kg, for 1 hour) or vehicle and LRRK2-GS mice treated with vehicle. Scale bar=500 μm. C. Same as B, but high-magnification images depicting Nr4a1 expression. Scale bar=10 μm D. Comparison of mean puncta/cell of Nra41 in Drd2-positive nuclei of LRRK2-WT mice treated with haloperidol or vehicle and LRRK2-GS mice treated with vehicle. Each dot represents the average number of Nra41 positive cells from one striatal section, n=6-9 sections/3-4 mice. The number of Nr4a1+/Drd2+positive cells across WT and GS mice does not differ (Tukey's multiple comparison tests after two-way ANOVA). E. Comparison of mean puncta/cell of Nra41 in Drd1-positive nuclei of LRRK2-WT mice and LRRK2-GS mice treated with vehicle. Each dot represents the average number of Nra41 positive cells from one striatal section, n=6-7 sections/3 mice. The number of Nr4a1+/Drd1+ positive cells across WT and GS mice does not differ (unpaired t-test). F. Quantification of Nra41-positive Drd2 nuclei in LRRK2-GS mice administered vehicle, MLi2 (10 mg/kg), PFE-360 (5 mg/kg), D2R agonist quinpirole (1 mg/kg), as well as LRRK2-KO mice treated with vehicle for 2 hours. N=4-8 sections/2-4 mice Data are represented as mean±SEM. Asterisks in F reflect statistical significance for Tukey post-hoc comparisons after one-way ANOVA. * p<0.05, *p < 0.01, **p< 0.001 ****p < 0.0001.

Similar articles

References

    1. Beaulieu J. M. & Gainetdinov R. R. The physiology, signaling, and pharmacology of dopamine receptors. Pharmacological Reviews 63, 182–217 (2011). 10.1124/pr.110.002642 - DOI - PubMed
    1. Neve K. A., Seamans J. K. & Trantham-Davidson H. Dopamine receptor signaling. in Journal of Receptors and Signal Transduction 24, 165–205 (2004). 10.1081/rrs-00029981 - DOI - PubMed
    1. Gerfen C. R. & Surmeier D. J. Modulation of striatal projection systems by dopamine. Annu Rev Neurosci 34, 441–466 (2011). 10.1146/annrev-neuro-061010-113641 - DOI - PMC - PubMed
    1. Kreitzer A. C. & Malenka R. C. Striatal Plasticity and Basal Ganglia Circuit Function. Neuron 60, 543–554 (2008). 10.1016/j.neuron.2008.11.005 - DOI - PMC - PubMed
    1. Delong M. R. Primate Models of Movement Disorders of Basal Ganglia Origin. Trends Neurosci 13, 281–285 (1990). 10.1016/0166-2236(90)90110-v - DOI - PubMed

Publication types