[Preprint]. 2024 Jun 28:2024.06.04.596633.
doi: 10.1101/2024.06.04.596633.

Comparative connectomics of the descending and ascending neurons of the Drosophila nervous system: stereotypy and sexual dimorphism

Affiliations

Comparative connectomics of the descending and ascending neurons of the Drosophila nervous system: stereotypy and sexual dimorphism

Tomke Stürner et al. bioRxiv. .

Abstract

In most complex nervous systems there is a clear anatomical separation between the nerve cord, which contains most of the final motor outputs necessary for behaviour, and the brain. In insects, the neck connective is both a physical and information bottleneck connecting the brain and the ventral nerve cord (VNC, spinal cord analogue) and comprises diverse populations of descending (DN), ascending (AN) and sensory ascending neurons, which are crucial for sensorimotor signalling and control. Integrating three separate EM datasets, we now provide a complete connectomic description of the ascending and descending neurons of the female nervous system of Drosophila and compare them with neurons of the male nerve cord. Proofread neuronal reconstructions have been matched across hemispheres, datasets and sexes. Crucially, we have also matched 51% of DN cell types to light level data defining specific driver lines as well as classifying all ascending populations. We use these results to reveal the general architecture, tracts, neuropil innervation and connectivity of neck connective neurons. We observe connected chains of descending and ascending neurons spanning the neck, which may subserve motor sequences. We provide a complete description of sexually dimorphic DN and AN populations, with detailed analysis of circuits implicated in sex-related behaviours, including female ovipositor extrusion (DNp13), male courtship (DNa12/aSP22) and song production (AN hemilineage 08B). Our work represents the first EM-level circuit analyses spanning the entire central nervous system of an adult animal.


Figures

Extended Data Fig. 1
Extended Data Fig. 1. Cross section (frontal) of the neck connective in the three datasets.
a, All neurons in the neck connective colour coded by their longitudinal tract, soma location or predicted neurotransmitter (Eckstein et al., 2020). b, Number of neurons by longitudinal tract, soma location or neurotransmitter in the three datasets. Neurotransmitter predictions are not yet available in FANC
Extended Data Fig. 2
Extended Data Fig. 2. Sensory ascending neurons.
a, Morphology of sensory ascending neurons identified in the three EM volumes. In black the EM morphology of DNs from female datasets (FAFB, FANC), in red from the male dataset (MANC). Next to them the LM images that allowed a grouping into sensory subclasses. b, Tract-based analysis of sensory ascending neurons in MANC. None of the SAs project along the MTD, or VLT tract. c, Number of SAs in each tract. d, Number of SA grouped into pairs or populations. e, Correlation of entry nerve to tract membership for MANC SAs (Marin et al. 2023).
Extended Data Fig. 3
Extended Data Fig. 3. Morphology matched across the neck - soma.
Morphology of LM matched DNs across the three datasets colour coded by cell body location according to (Namiki et al. 2018). a, DNa neurons have an anterior dorsal soma; b, DNb an anterior ventral soma; c, DNc a soma in the pars intercerebralis; d, DNd a soma in an anterior outside cell cluster; e, DNp are on the posterior surface; f, DNg are located in the GNG and g, DNx are outside the brain. In each panel the top images show reconstruction in FAFB in anterior and lateral view; the two bottom left images show MANC and two bottom right FANC in ventral and lateral view, respectively. The bar charts represent the distribution of the VNC characteristics longitudinal tract and neuropil innervation for the neurons in each category - see colour legend.
Extended Data Fig. 4
Extended Data Fig. 4. Morphology matched across the neck - brain neuropil.
Morphology of LM matched DNs across the three datasets colour coded by their brain neuropil innervation. DNs with input neuropil. a, superior medial protocerebrum and superior lateral protocerebrum (SMP_SLP); b, vest (VES); c, ocellar ganglion and lobular (OC_LO, vision related); d, posterior lateral protocerebrum (PLP); e, prow and flange (PRW_FLA); f, posterior slope and lateral accessory lobe (IPS_SPS_LAL); g, antennal mechanosensory and motor centre and wedge (AMMC_WED, auditory related); h, gnathal ganglia (GNG) and i, multiple innervations of neuropils across the brain (multi). In each panel the top images show reconstruction in FAFB in anterior and lateral view; the two bottom left images show MANC and two bottom right FANC in ventral and lateral view, respectively. The bar charts represent the distribution of the VNC characteristics longitudinal tract and neuropil innervation for the neurons in each category - see colour legend.
Extended Data Fig. 5
Extended Data Fig. 5. Morphology matched across the neck - VNC neuropil.
Morphology of LM matched DNs across the three datasets colour coded by VNC neuropil innervation. DNs with output neuropil. a, front leg (fl); b, hind leg (hl); c, multiple innervation in leg compartments (xl); d, neck tectulum (nt); e, wing tectulum (wt); f, multiple innerveration into upper tectulum neuropils of the neck, wings and halteres (ut); g, intermediate tectulum (it); h, lower tectulum (lt); i, abdomen (ad) and j, multiple innervations of neuropils across the VNC (xn). In each panel the top images show reconstruction in FAFB in anterior and lateral view; the two bottom left images show MANC and two bottom right FANC in ventral and lateral view, respectively. The bar charts represent the distribution of the brain characteristics soma location and neuropil innervation for the neurons in each category - see colour legend.
Extended Data Fig. 6
Extended Data Fig. 6. Morphology matched across the neck - tract.
Morphology of LM matched DNs across the three datasets colour coded by longitudinal tract membership in the VNC. DNs in the tract. a, dorsal lateral tract (DLT); b, median dorsal abdominal tract (MDA); c, ventral route of the mediate tract of dorsal cervical fasciculus (MTD-I); d, dorsal route of the mediate tract of dorsal cervical fasciculus (MTD-II); e, lateral route of the mediate tract of dorsal cervical fasciculus (MTD-III); f, dorsal median tract (DMT); g, intermediate tract of dorsal cervical fasciculus (ITD); h, ventral lateral tract (VLT); i, dorsal lateral tract of ventral cervical fasciculus (DLV); j, ventral median tract of ventral cervical fasciculus (VTV); h, curved ventral lateral tract (CVL) and i, no tract membership (none). In each panel the top images show reconstruction in FAFB in anterior and lateral view; the two bottom left images show MANC and two bottom right FANC in ventral and lateral view, respectively. The bar charts represent the distribution of the brain characteristics soma location and neuropil innervation for the neurons in each category - see colour legend.
Extended Data Fig. 7
Extended Data Fig. 7. DN matching to Namiki et al. 2018.
Morphology of identified DNs across all three datasets with nomenclature as described in (Namiki et al. 2018). Two DN types could not be identified (DNd01, DNg25) in any of the three EM datasets and one DN type (DNg28) is only identifiable in the brain. See supplementary table DN_identification for slide codes and for DN synonyms from the literature. In black the morphology of DNs from the female datasets (FAFB, FANC) in red from the male dataset (MANC). This figure is also provided in high resolution and DNs can be viewed in 3D at https://tinyurl.com/NeckConnective.
Extended Data Fig. 8
Extended Data Fig. 8. Brain neuropil groups.
Morphology of DNs and ANs by primary brain neuropil. a, All DNs in FAFB were assigned one or two input neuropils. DNs that receive input from more than two neuropils are referred to as multi. b, All ANs in FAFB were assigned one or two output neuropils. ANs that output to more than two neuropils are referred to as multi. Morphologies are coloured by broader neuropil groups: auditory related neuropils (AVLP_AMMC_WED), higher order multimodal sensory integration 1 (SMP_SLP), vision related (OC_LO), multimodal sensory integration 2 (PVLP, PLP), sensory modalities from the GNG (GNG, SAD), multimodal sensory integration and steering (IPS_SPS_LAL), vest related (VES) and flange/prow (PRW_FLA).
Extended Data Fig. 9
Extended Data Fig. 9. Neuropil-based analysis of descending neurons in FANC.
a, Primary neuropil assignment of DNs in the FANC dataset to compare to previously published one in the MANC dataset (H. S. J. *. Cheong et al., 2024). b, Synaptic output in % by VNC neuropil of matched DNs in MANC and FANC. Each row represents one DN type, order is conserved between the two datasets. Left bar indicates the previously assigned neuropil based subclasses from the MANC dataset (H. S. J. *. Cheong et al., 2024).
Extended Data Fig. 10
Extended Data Fig. 10. Tract-based analysis of descending neurons in FANC and ascending neurons in MANC.
a, Tract assignment of all left side DNs in the FANC dataset to compare to previously published tract assignment in the MANC dataset (H. S. J. *. Cheong et al., 2024). b, Number of DNs for each tract in comparison to MANC DNs (dotted line). c, DNs grouped into pairs or populations comparing FANC to MANC. d, Correlation of soma location and tract membership for identified FANC DN types based on LM data (Namiki et al. 2018). e, Tract assignment of all left side ANs in the MANC dataset. None of the ANs project along the MTD-II or MTD-III tract. A small additional tract was observed for ANs, referred to as AN-specific dorsal medial tract (ADM). f, Number of ANs in each tract. g, ANs grouped into pairs or populations comparing MANC to FANC. h, Correlation of hemilineage and neuromere to tract membership for MANC ANs (Marin et al., 2023).
Extended Data Fig. 11
Extended Data Fig. 11. Potentially sexually dimorphic or sex-specific ANs in the VNC.
a, Morphology of all the potentially male specific ANs by type. b, Morphology of the potentially female specific ANs by newly assigned types. c, Morphology of the potentially sexually dimorphic ANs by MANC type names. In black the EM morphology from the female dataset (FANC) in red from the male dataset (MANC). Stars indicate ANs with missing soma in FANC due to missing EM image data.
Fig. 1:
Fig. 1:. Reconstruction and identification of three neuronal classes across three datasets.
a, Schematic of the central nervous system with the three neuronal classes that pass through the neck connective: descending neurons (DNs), ascending neurons (ANs) and sensory ascending neurons (SAs). FANC neurons are shown in MANC space here and in all following figures. b, Number of neurons in each class and dataset. c, Transects through the neck of the three datasets: Female Adult Fly Brain (FAFB), Male Adult Nerve Cord (MANC) and Female Adult Nerve Cord (FANC). These neck connective transects were used as seedplanes to find and reconstruct the three classes of neurons shown in different colours. d, Number of DNs and ANs that have been left-right matched into pairs or groups in the three datasets. e, Number of DNs and ANs that have a match across the two VNC datasets. f, SAs were assigned modalities by matching to light microscopy (LM) images. Left, an example of a LM image of Femoral chordotonal organ club. Right, the EM reconstructions that were matched to the image. g, DNs were identified in all three EM datasets by matching the EM reconstructions to LM level descriptions (mainly (Namiki et al. 2018), see supplemental file 2 - DN_identification). Left, an example of a LM image of DNa01 in the brain and VNC and next to it the FAFB, FANC and MANC EM reconstructions that were matched to those images. Right, the quantification of DNs identified in all three datasets. h, Identified DNs that can be matched across all three datasets coloured by soma location, brain neuropil, longitudinal tract and VNC neuropil. Please see attached files for a high resolution version of this figure.
Fig. 2:
Fig. 2:. DN matching to Namiki et al. 2024 in prep.
Morphology of identified DNs across all three datasets with nomenclature as described in Namiki et al. 2024 in prep. One DN type could not be found as it was duplicated (DNp61) and five could only be found in the brain (DNp52, DNp66, DNg58, DNg101, DNg102). See Extended Data Fig. 7 for matching to DNs previously characterised at light level by Namiki et al. (2018). See supplementary file 2 DN_identification for details. DN morphologies from the female datasets (FAFB, FANC) are in black, male dataset (MANC) is in red. This figure is also provided in high resolution and DNs can be viewed in 3D at https://tinyurl.com/NeckConnective. Please see attached files for a high resolution version of this figure.
Fig. 3:
Fig. 3:. Sensory ranking of descending neurons.
a, Pie charts show the neuron class composition of input and output partners of all DNs in the brain (corresponds to FlyWire super_class). Total synapse numbers shown below. b, Clustering of FAFB DNs by their sensory input rank (all apart from sensory DNs: DNx01, DNx02, LN-DNs). The ranks, ranging from 1 to 12, taken from (Dorkenwald et al. 2023), are defined as the traversal distances from a given sensory modality to each DN and then averaged by type. Low rank indicates a more direct connection from sensory modality to DN type. A cut height of 5 (dotted line in dendrogram in b) produces 16 clusters. c, Clusters shown in b by the brain neuropil assigned to DN types as a percentage of all types in that cluster. d, DN morphologies of clusters that are close in rank to several sensory modalities in the brain. e-i, DN morphologies of clusters that are close in rank to one particular sensory modality. Plots on the left show the average rank of the clusters defined in b for the different sensory modalities. Arrows point to specific DN types that stand out. DN morphologies are plotted in their brain neuropil colours.Please see attached files for a high resolution version of this figure.
Fig. 4:
Fig. 4:. Direct descending and ascending neuron connections.
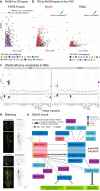
Connectivity of AN/SAs to DNs and vice versa. a, Direct connectivity of AN/SAs onto DNs in the brain. DN and AN/SAs connections are averaged by type and plotted by mean weight in percent to mean weight. Arrows point to the two strongest connections in weight from AN/SAs onto DNs. b, Direct connectivity of DNs in the VNC onto ANs and SAs. Connections are averaged by type, like in a. Arrows point to the one connection that stands out in both MANC and FANC. The weight in a and b are the number of pre synapses. c, The effective connectivity to motor neuron targets ipsilateral and contralateral to the root side of DNx02. d, Morphology of DNx02 and AN06B025 in the brain and VNC. In black the EM morphology from female datasets (FAFB, FANC); in red from the male dataset (MANC). e, DNx02 circuit in the brain (FAFB-Flywire) and in the VNC (MANC). Connections in both datasets are averaged by type and shown in the percent input to the receiving neuron. Please see attached files for a high resolution version of this figure.
Fig. 5:
Fig. 5:. Across VNC dataset comparisons.
a, Number of DNs/ANs assigned to a tract in MANC and FANC. b, Number of DNs/ANs assigned a VNC output/input neuropil in MANC and FANC. c, Example of a stereotyped circuit in the VNC. DNa02 in MANC and FANC in percent connect onto 3 sets of serial leg restricted neurons (IN08A006, IN19A003, IN13B001), the w-cHIN and a bilaterally projecting neuron (IN07B006). The types were matched across the two datasets and given the MANC type names accordingly. Downstream targets were selected by receiving more than 2% of DNa02 output. Arrow thickness corresponds to the percent input to the receiving neuron and only values above 1% are shown. d, EM morphologies of the neurons shown in the connectivity graphs in c. In black reconstructions from FANC, in red from MANC. e, MANC leg premotor circuit neurons published in (H. S. J. *. Cheong et al., 2024) matched to FANC. All leg restricted serial sets were found, although some are missing on one or the other side in FANC. All apart from 4 types of leg coordination neurons were matched to FANC. EM morphologies of those 4 unmatched types are shown on the right as potentially male specific neurons. Please see attached files for a high resolution version of this figure.
Fig. 6:
Fig. 6:. Sex-specific or sexually dimorphic (sex. dimorphic) neurons.
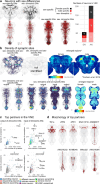
a, Morphology of DNs in three datasets and ANs in the two VNC datasets that are sexually dimorphic or sexually specific (sex-specific) as described in the literature or predicted by the matching. In black the EM morphology from female datasets (FAFB, FANC), in red from the male dataset (MANC). b, Density of pre- or postsynapses of the DNs and ANs shown in a compared to previously published images of enlarged regions in the female and male central nervous system. c, Downstream or upstream partners of sexually dimorphic or sex-specific DNs or ANs respectively in FANC and MANC. Arrows point to the strongest partners by number of synaptic connections and number of neurons connecting onto them. d, Reconstructions of partner neurons in MANC (c top row) or in FANC that were matched to MANC neurons of that type. Please see attached files for a high resolution version of this figure.
Fig. 7:
Fig. 7:. Sexually dimorphic and sex-specific descending neurons.
a, Proportion of DNs that are sex-specific or sexually dimorphic by dataset and primary input neuropil. b, Morphology of DNs in the three datasets belonging to the oviDN hemilineage. c, EM morphologies identified within the LM images from female and male of the oviDN-SS2 line. d, EM morphologies of previously LM characterised male specific DNs and new potentially male specific DNs. e, EM morphology of the female specific DN, vpoDN (DNp37). f, EM morphologies of LM characterised sexually dimorphic DNs and new potentially sexually dimorphic DNs. g,h, Connectivity downstream of the sexually dimorphic DNp13 in MANC (g) and FANC (h). There is just one downstream partner in common between the two sexes, IN12A002 marked with a *. All other partners are either sex-specific (coloured black or red), are dimorphic in their connections (pink) or are not downstream of DNp13 in the other dataset (coloured grey). i, EM morphology of some of the top VNC targets. j,k, Connectivity downstream of the sexually dimorphic DNa12/aSP22 in MANC (j) and FANC (k). There are 8 downstream neurons in common. Only T1 leg motor neurons (MNs) have been systematically identified between the two datasets, thus other FANC Leg MNs are not shown. l, EM morphology of some of the top VNC targets. In black the EM morphology from female datasets (FAFB, FANC), in red from the male dataset (MANC). * indicates shared partners downstream of dimorphic DN pairs. Please see attached files for a high resolution version of this figure.
Fig. 8:
Fig. 8:. Sexual dimorphism and sex-specific ascending neurons.
a, Proportion of ANs that are potentially sex-specific or potentially sexually dimorphic by hemilineage, soma neuromere and primary input neuropil. b,c, Morphology of ANs that are potentially sex-specific in males (b) and females (c) by hemilineage. FANC neurons were assigned hemilineages and soma neuromere if possible and given new type names. d,e, Input circuit in the VNC to potentially sex-specific AN types of hemilineage 08B with soma location in T1 (black box in b and c). Morphology of AN types underneath. All input neurons with more than 2% input onto the receiving AN are shown. FANC neurons in e were matched to MANC neuron types by morphology and connectivity and given the MANC names with an addition of f for female. Please see attached files for a high resolution version of this figure.

Similar articles

References

    1. Ache J. M., Namiki S., Lee A., Branson K., & Card G. M. (2019). State-dependent decoupling of sensory and motor circuits underlies behavioral flexibility in Drosophila. Nature Neuroscience, 22(7), 1132–1139. - PMC - PubMed
    1. Auer T. O., & Benton R. (2016). Sexual circuitry in Drosophila. Current Opinion in Neurobiology, 38, 18–26. - PubMed
    1. Aymanns F., Chen C.-L., & Ramdya P. (2022). Descending neuron population dynamics during odor-evoked and spontaneous limb-dependent behaviors. eLife, 11. 10.7554/eLife.81527 - DOI - PMC - PubMed
    1. Azevedo A., Lesser E., Mark B., Phelps J., Elabbady L., Kuroda S., Sustar A., Moussa A., Kandelwal A., Dallmann C. J., Agrawal S., Lee S.-Y. J., Pratt B., Cook A., Skutt-Kakaria K., Gerhard S., Lu R., Kemnitz N., Lee K., … Tuthill J. C. (2022). Tools for comprehensive reconstruction and analysis of Drosophila motor circuits. In bioRxiv. 10.1101/2022.12.15.520299 - DOI
    1. Bates A. S., Manton J. D., Jagannathan S. R., Costa M., Schlegel P., Rohlfing T., & Jefferis G. S. (2020). The natverse, a versatile toolbox for combining and analysing neuroanatomical data. eLife, 9. 10.7554/eLife.53350 - DOI - PMC - PubMed

Publication types