[Preprint]. 2024 Jun 3:2023.10.06.561126.
doi: 10.1101/2023.10.06.561126.

Inhibition of the Eukaryotic Initiation Factor-2-α Kinase PERK Decreases Risk of Autoimmune Diabetes in Mice

Affiliations

Inhibition of the Eukaryotic Initiation Factor-2-α Kinase PERK Decreases Risk of Autoimmune Diabetes in Mice

Charanya Muralidharan et al. bioRxiv. .

Update in

Abstract

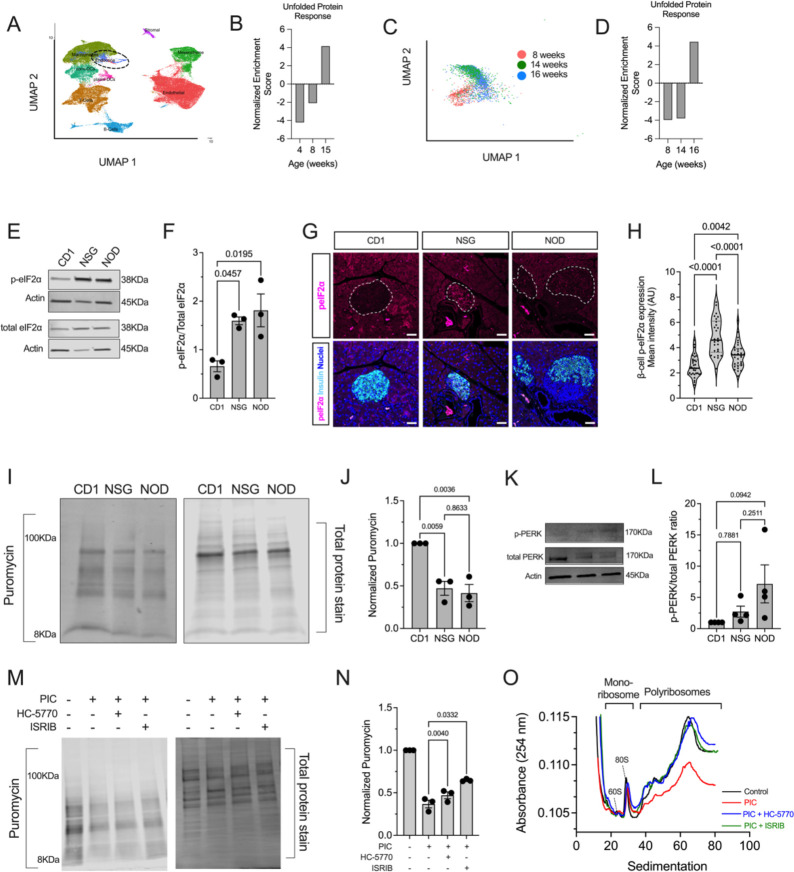
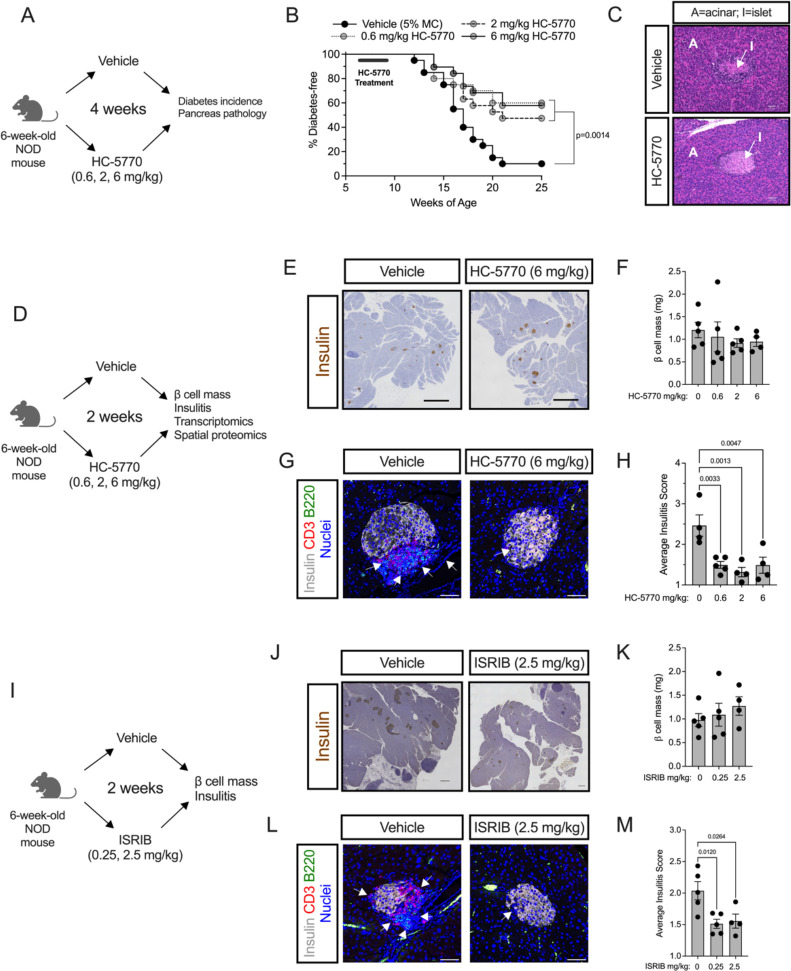
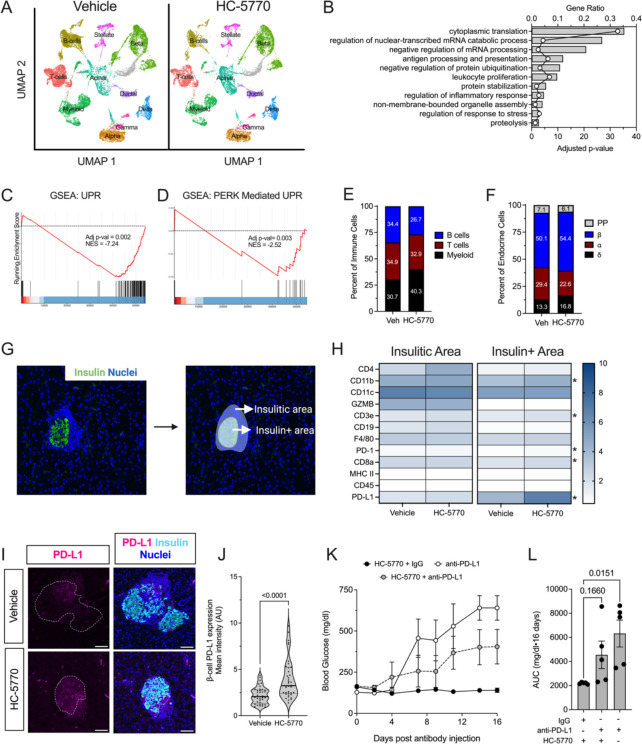
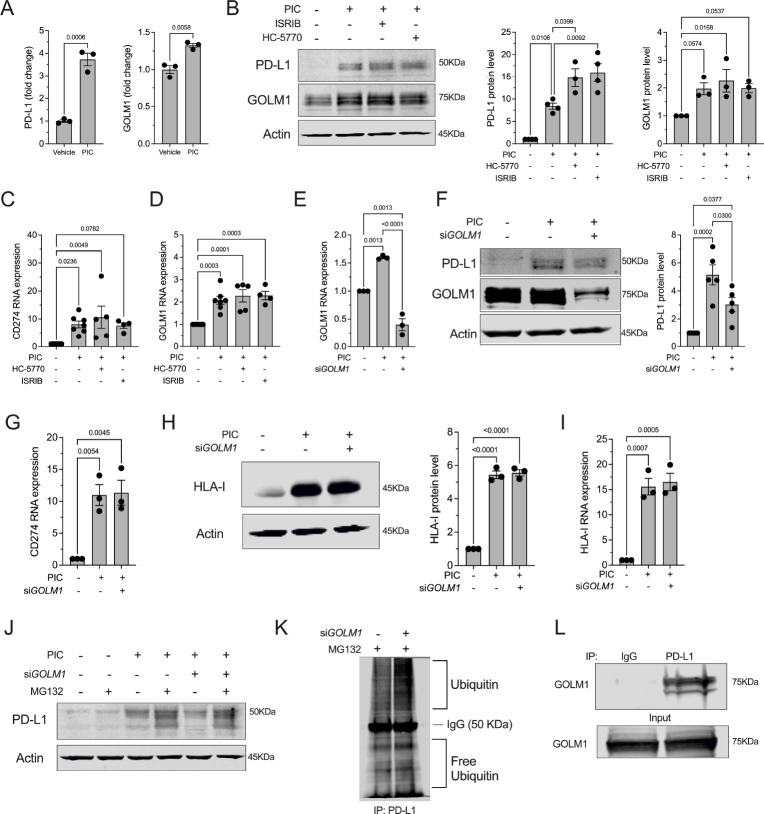
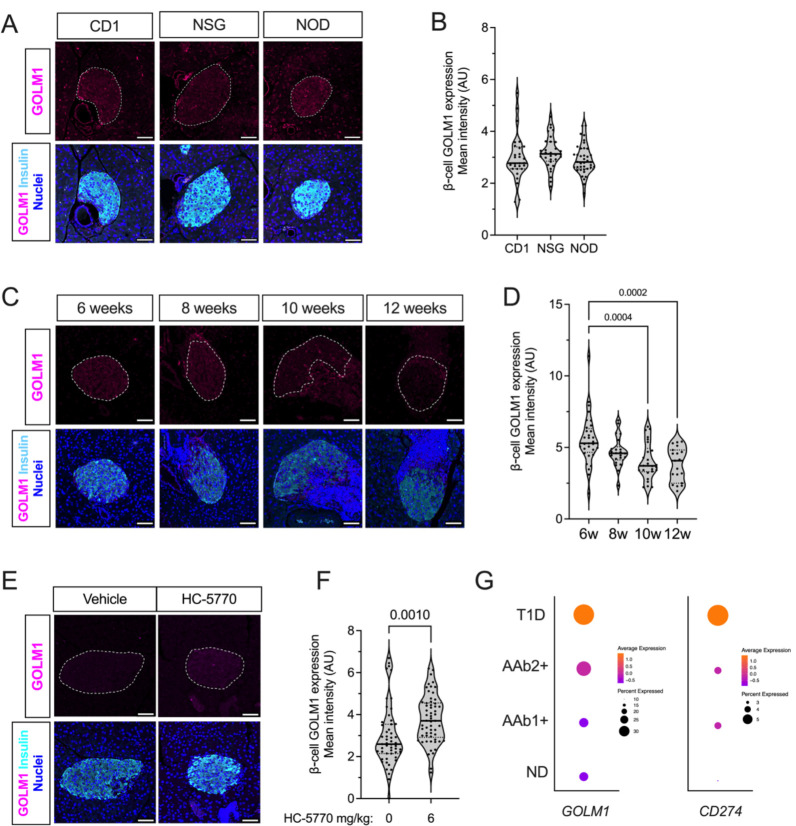
Preventing the onset of autoimmune type 1 diabetes (T1D) is feasible through pharmacological interventions that target molecular stress-responsive mechanisms. Cellular stresses, such as nutrient deficiency, viral infection, or unfolded proteins, trigger the integrated stress response (ISR), which curtails protein synthesis by phosphorylating eIF2α. In T1D, maladaptive unfolded protein response (UPR) in insulin-producing β cells renders these cells susceptible to autoimmunity. We show that inhibition of the eIF2α kinase PERK, a common component of the UPR and ISR, reverses the mRNA translation block in stressed human islets and delays the onset of diabetes, reduces islet inflammation, and preserves β cell mass in T1D-susceptible mice. Single-cell RNA sequencing of islets from PERK-inhibited mice shows reductions in the UPR and PERK signaling pathways and alterations in antigen processing and presentation pathways in β cells. Spatial proteomics of islets from these mice shows an increase in the immune checkpoint protein PD-L1 in β cells. Golgi membrane protein 1, whose levels increase following PERK inhibition in human islets and EndoC-βH1 human β cells, interacts with and stabilizes PD-L1. Collectively, our studies show that PERK activity enhances β cell immunogenicity, and inhibition of PERK may offer a strategy to prevent or delay the development of T1D.

Keywords: Unfolded protein response; integrated stress response; islet; mRNA translation; type 1 diabetes.


Conflict of interest statement

DECLARATION OF INTERESTS VC, MES, DS, and MJM are employees of HiberCell, Inc. SAT, RGM, and HiberCell, Inc. have filed a provisional patent on compounds to inhibit PERK in type 1 diabetes. SAT and RGM received an investigator-initiated award from HiberCell, Inc. for use of PERK inhibitors in this study. KAS is a consultant for and has received research support from HiberCell, Inc. SAO is a co-founder, equity holder, and consultant for OptiKIRA, LLC.

Figures

Figure 1:
Figure 1:. The unfolded protein response and integrated stress response are active in prediabetic NOD mice and PIC-treated human islets.
(A) Uniform manifold approximation and projection (UMAP) embeddings of a reanalysis of single-cell RNA seq of islets from 4-, 8-, and 15-week-old female NOD mice. (B) Gene set enrichment analysis (GSEA) of the endocrine cell population identified in panel (A) for HALLMARK: unfolded protein response. (C) UMAP embeddings of a reanalysis of single-cell RNA seq of islets from 8-, 14-, and 16-week-old female NOD mice. (D) Gene set enrichment analysis (GSEA) of the β cell population identified in panel (C) for HALLMARK: unfolded protein response. (E) Representative immunoblot of phosphorylated eIF2α and total eIF2α; N=3 biological replicates. (F) Quantification of the immunoblots shown in panel (E). ANOVA. (G) Representative pancreatic immunofluorescence images of phosphorylated eIF2α (magenta), insulin (cyan), and nuclei (blue); Scale bar = 50μm; dotted lines indicate islets. (H) Quantification of the fluorescence intensity of the images in panel (G); each dot represents an islet, N=4–5 mice, and N>5 islets per mouse (ANOVA). (I) Representative puromycin incorporation immunoblot image (left panel) and corresponding total protein stain (right panel) from islets of 8-week-old female CD1, NSG, and NOD islets. (J) Quantification of the puromycin intensity normalized to total protein stain from panel (I); N=3 (each replicate represents pooled islets from 3–4 mice per group) (ANOVA). (K) Representative immunoblot of phosphorylated PERK and total PERK from islets of 8-week-old female CD1, NSG, and NOD mice (top); quantification of the immunoblot for phospho-PERK normalized to total PERK from N=4 (each replicate represented pooled islets from 3–4 mice per group) (bottom) (ANOVA) (L) Representative puromycin incorporation immunoblot (left panel) and corresponding total protein stain (right panel) from MIN6 cells treated as indicated (PIC=proinflammatory cytokines). (M) Quantification of the puromycin intensity normalized to total protein stain from panel (L); N=3 independent experiments (RM-ANOVA). (N) Polyribosomal profiling traces of human islets treated ±PIC, HC-5770, or ISRIB. Data are presented as mean ±SEM.
Figure 2:
Figure 2:. PERK inhibition delays autoimmune diabetes in NOD mice.
Prediabetic female NOD mice (6 weeks of age) were treated with varying doses of HC-5770 or ISRIB. (A) Experimental design for HC-5770 diabetes incidence study. (B) Diabetes incidence. N=20 mice per group (Mantel-Cox). (C) Representative hematoxylin and eosin stain of pancreata from non-diabetic mice at 25 weeks of age that were treated with Vehicle or 6 mg/kg HC-5770 from 6–10 weeks of age. (D) Experimental design for HC-5770 mechanistic short-term studies. (E) Representative images of pancreata from NOD mice following two weeks of HC-5770 administration (6 mg/kg) stained for insulin (brown) and counterstained with hematoxylin (blue); scale bar = 500 μm. (F) β cell mass of mice treated with HC-5770 (6 mg/kg) for two weeks; N=4–5 mice per group (ANOVA). (G) Representative images of pancreata from NOD mice following two weeks of HC-5770 administration (6 mg/kg) immunostained for CD3 (red), B220 (green), insulin (white), and nuclei (blue); arrows indicate regions of insulitis; scale bar = 50 μm. (H) Average insulitis score of mice treated with varying doses of HC-5770 for two weeks; N=4–5 mice per group; NB: these data are replicated in Supplemental Figure 2F for comparative purposes (ANOVA). (I) Experimental design for ISRIB short-term studies. (J) Representative images of pancreata from NOD mice following two weeks of ISRIB administration (2.5 mg/kg) stained for insulin (brown) and counterstained with hematoxylin (blue); scale bar = 500 μm. (K) β cell mass of mice treated with ISRIB (2.5 mg/kg) for two weeks; N=4–5 mice per group (ANOVA). (L) Representative images of pancreata from NOD mice following two weeks of ISRIB administration (2.5 mg/kg) immunostained for CD3 (red), B220 (green), insulin (white), and nuclei (blue); arrows indicate regions of insulitis; scale bar = 50 μm. (H) Average insulitis score of mice treated with varying doses of ISRIB for two weeks; N=4–5 mice per group (ANOVA). Data are presented as mean ±SEM.
Figure 3:
Figure 3:. PERK inhibition increases levels of PD-L1 in β cells of NOD mice.
Prediabetic female NOD mice (6 weeks of age) were treated with 6 mg/kg HC-5770 for 2 weeks and isolated islets were subjected to scRNA-seq and pancreas tissue was subjected to Nanostring® spatial proteomics. (A) Uniform manifold approximation and projection (UMAP) embeddings of merged single-cell RNA sequencing profiles from islets colored by identified cell clusters. N=3 mice per group for scRNA-seq. (B) Gene Ontology analysis of all cell clusters (pseudo-bulk analysis). (C) Gene set enrichment analysis (GSEA) of β cell clusters showing HALLMARK: unfolded protein response and (D) GSEA of β cell clusters showing GO-BP: PERK-meditated unfolded protein response. (E) Percent of T, B, and myeloid cells identified within the immune cell clusters. (F) Percent of α, β, δ, and PP cells identified within the islet cell clusters. (G) Representative image of identification of the insulin-positive area and the insulitic area used to collect spatial tissue-based proteomics. (H) Heatmap of identified proteins in the insulitic area (left panel) and insulin-positive area (right panel) in Vehicle- or HC-5770-treated mice; N=10–11 regions of interest from 2 mice per group. * indicates P<0.05 (T-test). (I) Representative images of pancreata from mice following two weeks of treatment with Vehicle or HC-5770 stained for PD-L1 (magenta), insulin (cyan), and nuclei (blue); dotted lines indicate islets; scale bar=50 μm. (J) Quantification of PD-L1 intensity in the β cells of the panel (I); each dot represents an islet, N=4–5 mice, and N>5 islets per mouse (T-test). (K) 6-week-old female NOD mice were treated as indicated with 6 mg/kg HC-5770 or with Vehicle for two weeks, then administered either anti-PD-L1 or IgG control, followed by another two weeks of HC-5770 treatment until 10 weeks of age, and glucoses were measured on alternate days post-injection; N= 5 mice per group. (L) Area Under the Curve (AUC) analysis of the data in panel (K) (ANOVA). Data are presented as mean ±SEM.
Figure 4:
Figure 4:. GOLM1 stabilizes PD-L1.
(A) PD-L1 and GOLM1 protein levels were identified using proteomics of EndoC-βH1 human β cells treated ±proinflammatory cytokines (PIC); N=3 biological replicates. T-test. (B) Representative immunoblot analysis of PD-L1 and GOLM1 from EndoC-βH1 cells treated ±PIC, HC-5770, and ISRIB (left panel) with quantification of PD-L1 levels (middle panel) and GOLM1 levels (right panel); N=3 biological replicates (ANOVA). (C, D) Relative CD274 and GOLM1 mRNA levels by quantitative RT-PCR normalized to ACTB from EndoC-βH1 cells treated ±PIC, HC-5770, and ISRIB; N=4–7 biological replicates (ANOVA). (E) Relative GOLM1 RNA levels normalized to ACTB from EndoC-βH1 cells treated ±PIC and GOLM1 siRNA; N=3 biological replicates (ANOVA). (F) Representative immunoblot analysis of PD-L1 and GOLM1 from EndoC-βH1 cells treated ±PIC and GOLM1 siRNA (left panel) with quantification of PD-L1 levels (right panel); N=3 biological replicates (ANOVA). (G) Relative CD274 mRNA levels by quantitative RT-PCR normalized to ACTB of EndoC-βH1 cells treated ±PIC and GOLM1 siRNA; N=3 biological replicates (ANOVA). (H) Representative immunoblot analysis of HLA-I from EndoC-βH1 cells treated ±PIC and GOLM1 siRNA (left panel) with quantification of HLA-I levels (right panel). N=3 biological replicates (ANOVA). (I) Relative HLA-I mRNA levels by quantitative RT-PCR normalized to ACTB from EndoC-βH1 cells treated ±PIC and GOLM1 siRNA; N=3 biological replicates (ANOVA). (J) Representative immunoblot analysis of PD-L1 from EndoC-βH1 cells treated ±PIC, GOLM1 siRNA, and MG132. (K) Immunoblot analysis of ubiquitin following immunoprecipitation (IP) for PD-L1 from HEK-293 cells treated with GOLM1 siRNA ±MG132. (L) Immunoblot analysis for GOLM1 following IP for PD-L1 from HEK-293 cells. Data are presented as mean ±SEM.
Figure 5:
Figure 5:. PERK inhibition increases GOLM1 levels in β cells.
(A) Representative images of pancreata from 8-week-old female CD1, NSG, and NOD mice immunostained for GOLM1 (magenta), insulin (cyan), and nuclei (blue), scale bar = 50 μm; dotted lines indicate islets. (B) Quantification of the GOLM1 fluorescence intensity from data in panel (A); each dot represents an islet, N=3 mice, with >5 islets per mouse (ANOVA). (C) Representative images from 6-, 8-, 10-, and 12-week-old female NOD mice immunostained for GOLM1 (magenta), insulin (cyan), and nuclei (blue); scale bar = 50 μm; dotted lines indicate islets. (D) Quantification of the GOLM1 fluorescence intensity from data in panel (C); each dot represents an islet, N=3 mice, with >5 islets per mouse (ANOVA). (E) Representative images of pancreata from 8-week-old female NOD mice that have been treated with Vehicle of HC-5770 (6 mg/kg) for two weeks, immunostained for GOLM1 (magenta), insulin (cyan), and nuclei (blue), scale bar = 50 μm; dotted lines indicate islets. (F) Quantification of the GOLM1 fluorescence intensity from data in panel (E); each dot represents an islet, N=4–5 mice, and N>5 islets per mouse (T-test). (G) Dot plot analysis of scRNA-seq data in the Human Pancreas Analysis Program (HPAP) of residual β cells for GOLM1 and CD274.The size of the dots indicates the percentage of cells that express the studied gene. The color scale shows the change of normalized and centered average gene expression within the different groups. No diabetes (ND): N=15; Single autoantibody positive (AAb1+): N=8; Double autoantibody positive (AAb2+): N=2; type 1 diabetes (T1D): N=9. Data are presented as mean ±SEM.

Similar articles

References

    1. Herold KC, et al. An Anti-CD3 Antibody, Teplizumab, in Relatives at Risk for Type 1 Diabetes. N Engl J Med. 2019;381(7):603–613. - PMC - PubMed
    1. Sims EK, et al. High proinsulin:C-peptide ratio identifies individuals with stage 2 type 1 diabetes at high risk for progression to clinical diagnosis and responses to teplizumab treatment. Diabetologia. [published online ahead of print: September 4, 2023]. 10.1007/s00125-023-06003-5. - DOI - PMC - PubMed
    1. Sims EK, et al. Teplizumab improves and stabilizes beta cell function in antibody-positive high-risk individuals. Sci Transl Med. 2021;13(583):eabc8980. - PMC - PubMed
    1. Bingley PJ, et al. Type 1 Diabetes TrialNet: A Multifaceted Approach to Bringing Disease-Modifying Therapy to Clinical Use in Type 1 Diabetes. Diabetes Care. 2018;41(4):653–661. - PMC - PubMed
    1. Sims EK, et al. Screening for Type 1 Diabetes in the General Population: A Status Report and Perspective. Diabetes. 2022;71(4):610–623. - PMC - PubMed

Publication types