[Preprint]. 2024 Jun 6:2024.06.05.597512.
doi: 10.1101/2024.06.05.597512.

Unique trajectory of gene family evolution from genomic analysis of nearly all known species in an ancient yeast lineage

Affiliations

Unique trajectory of gene family evolution from genomic analysis of nearly all known species in an ancient yeast lineage

Bo Feng et al. bioRxiv. .

Update in

Abstract

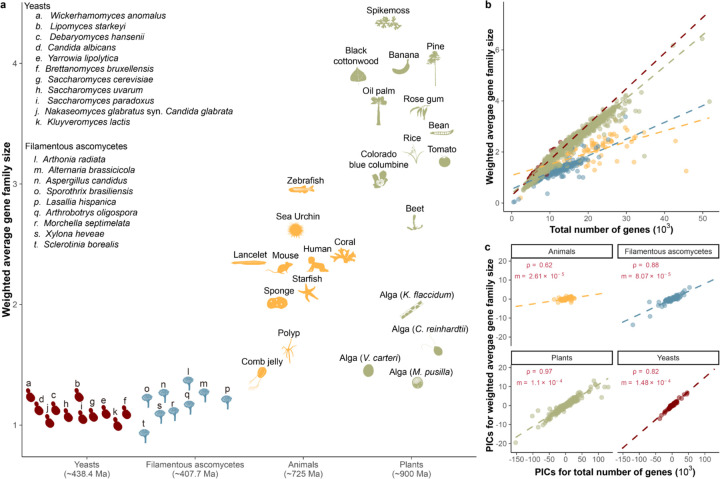
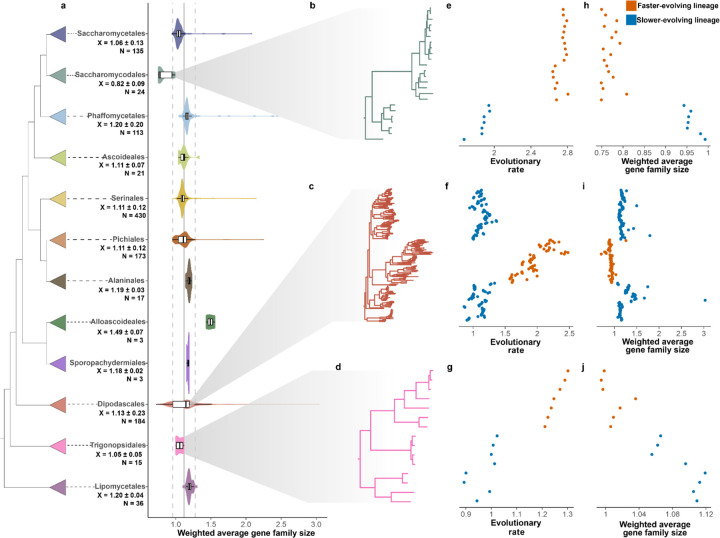
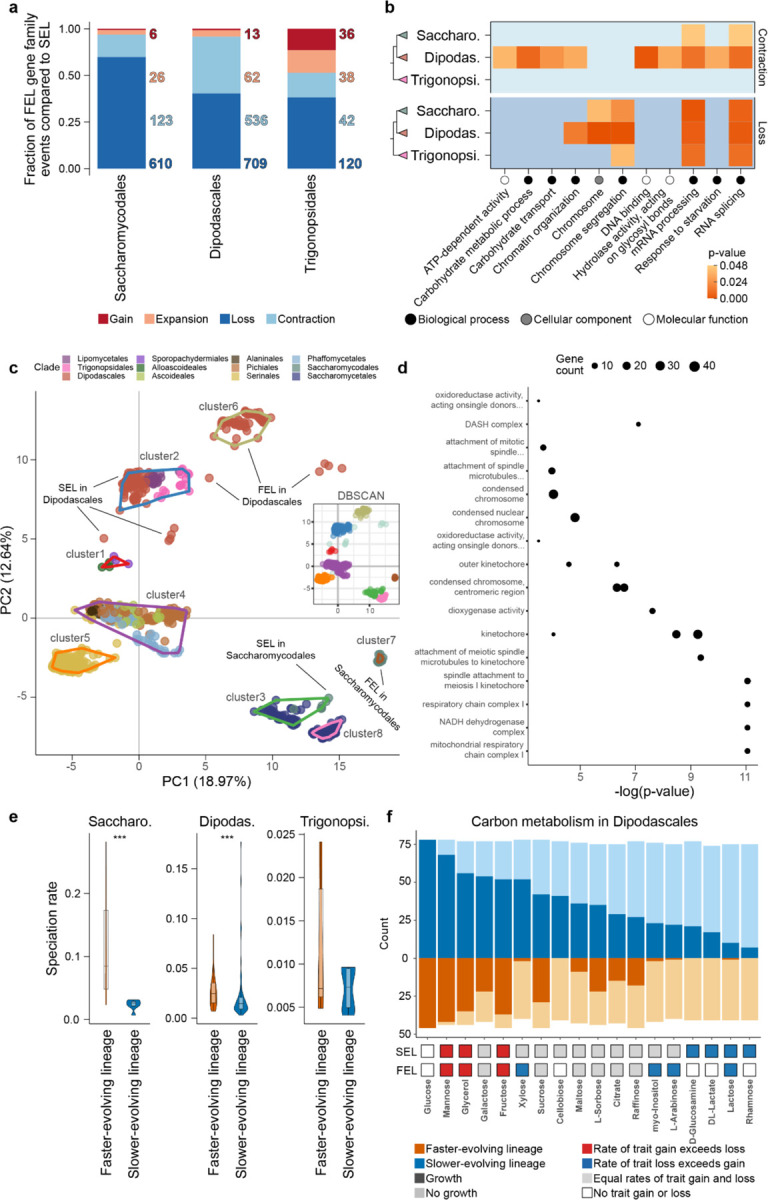
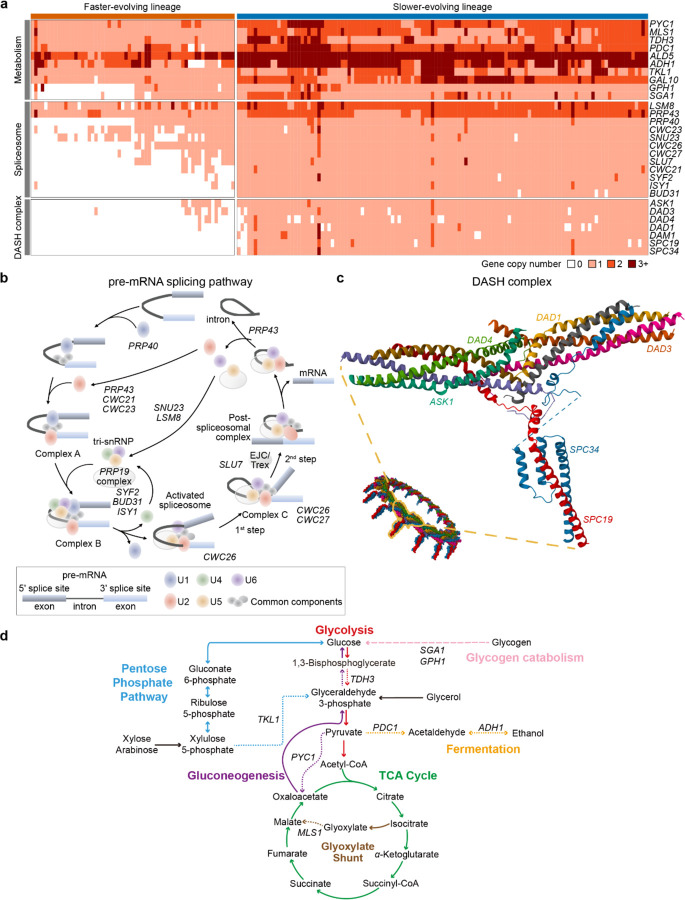
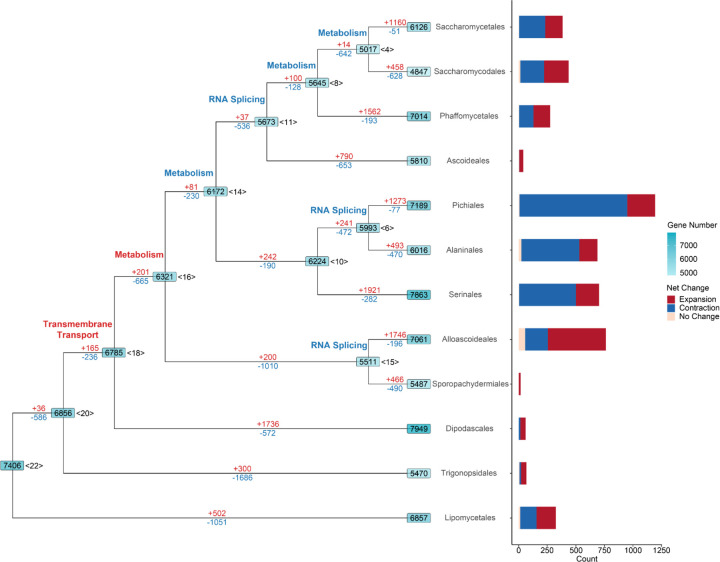
Gene gains and losses are a major driver of genome evolution; their precise characterization can provide insights into the origin and diversification of major lineages. Here, we examined gene family evolution of 1,154 genomes from nearly all known species in the medically and technologically important yeast subphylum Saccharomycotina. We found that yeast gene family and genome evolution are distinct from plants, animals, and filamentous ascomycetes and are characterized by small genome sizes and smaller gene numbers but larger gene family sizes. Faster-evolving lineages (FELs) in yeasts experienced significantly higher rates of gene losses-commensurate with a narrowing of metabolic niche breadth-but higher speciation rates than their slower-evolving sister lineages (SELs). Gene families most often lost are those involved in mRNA splicing, carbohydrate metabolism, and cell division and are likely associated with intron loss, metabolic breadth, and non-canonical cell cycle processes. Our results highlight the significant role of gene family contractions in the evolution of yeast metabolism, genome function, and speciation, and suggest that gene family evolutionary trajectories have differed markedly across major eukaryotic lineages.


Conflict of interest statement

Competing interests J.L.S. is an adviser for ForensisGroup, Inc. A.R. is a scientific consultant for LifeMine Therapeutics, Inc. The other authors declare no other competing interests.

Figures

Figure 1:
Figure 1:. Narrow range of weighted average gene family sizes among yeasts versus broader diversity in animals and plants.
a. The weighted average size of gene families across yeasts (from subphylum Saccharomycotina), filamentous ascomycetes (subphylum Pezizomycotina), animals (Kingdom Metazoa), and plants (Kingdom Viridiplantae, Phylum Glaucophyta, and Phylum Rhodophyta). Species-specific gene families were excluded by applying a 0.1 threshold based on the density plot for gene family average coverages (Figure S1). Representative species for yeasts and animals were identified based on previous studies; representatives for plants were chosen from species with available genome data; for filamentous ascomycetes, one representative per class was selected. The estimated divergence times are approximately 438.4 million years for yeasts, 407.7 million years for filamentous ascomycetes, 725 million years for animals, and 900 million years for plants, derived from previous studies,,,. Images representing taxa were manually created and sourced from Phylopic (https://www.phylopic.org/). b. Correlation plot between the weighted average gene family size and the total number of protein-coding genes across yeasts, filamentous ascomycetes, animals, and plants. c. Correlation plot between the PICs of weighted average gene family size and the total number of protein-coding genes across yeasts, filamentous ascomycetes, animals, and plants. Correlations were determined through the Spearman test using the R package stats version 4.3.2. Specifically, the correlation coefficient (rho) for yeasts was 0.82, for filamentous ascomycetes was 0.88, for animals was 0.62, and for plants was 0.97, all statistically significant with P < 0.01. The slope (m) is calculated using linear regression based on the PICs of weighted average gene family size and the total number of protein-coding genes across these four groups. The PIC-related codes and data are available at the Figshare repository.
Figure 2:
Figure 2:. Notable variations in weighted average gene family sizes within specific yeast orders.
a. The phylogeny of 1,154 yeasts, derived from a previous study. Colors indicate the taxonomic classification of species within the Saccharomycotina order. The weighted average gene family sizes (X) and genome numbers (N) for each order are displayed beneath the respective order names. A gray solid line at 1.12 represents the weighted average gene family size for all yeasts. b-d. The orders Trigonopsidales, Dipodascales, and Saccharomycodales are highlighted due to their notable differences in evolutionary rates and weighted average gene family sizes. e-j. Differences in evolutionary rates / weighted average gene family sizes within specific orders. Each dot represents a yeast in the corresponding phylogeny and is arranged according to its placement on the phylogenetic tree.
Figure 3:
Figure 3:. Faster-evolving lineages (FELs) within three orders experienced significantly more gene family contractions and losses.
a. Significantly different gene family dynamics (loss, contraction, expansion, and gain) in FELs relative to SELs within Dipodascales, Saccharomycodales, and Trigonopsidales. A gene family loss is indicated by a fold change value of 0, meaning the gene family in FEL has no copies, while a fold change equal to positive infinity signifies gain. Values greater than 1.5 indicate expansion, and values less than 0.67 signify contraction. The Kolmogorov–Smirnov test was employed to assess these differences; P ≤ 0.05. b. GO enrichment analysis of significant contractions or losses in gene families. All enriched GO terms were simplified into GO slim terms. c. PCA analysis utilizing presence and absence data for 4,262 gene families with an average coverage of 0.5 or greater. The DBSCAN plot employs PC1 and PC2 coordinates for density-based clustering, with colors distinguishing the various clusters. In the PCA plot, points enclosed by lines indicate distinct clusters, corresponding to the color coding applied in the DBSCAN plot. d. The GO enrichment analysis of the top 610 gene families from PC1. e. Speciation rate comparison between FEL and SEL within Trigonopsidales, Dipodascales, and Saccharomycodales with the Wilcoxon signed-rank test. f. The evolutionary history of 17 carbon traits in FEL and SEL of Dipodascales. The dark color indicates the number of yeasts capable of utilizing the carbon source. Three different evolutionary models are shown: trait gain (red), trait loss (blue), and equal rates of trait gain and loss (gray). Estimated evolutionary models were not derived for glucose in both FEL and SEL, and for cellobiose, D-glucosamine, DL-lactate, and rhamnose in SEL, due to the uniform ability or inability of all yeasts within the group to utilize these carbon sources.
Figure 4:
Figure 4:. Dipodascales’ FEL experienced the loss of key genes involved in the pre-mRNA splicing pathway, metabolic pathways, and the DASH complex.
a. A detailed picture of gene copy numbers in Dipodascales among metabolic pathways (10 gene families), the pre-mRNA splicing pathway (12 gene families), and the DASH complex (7 gene families). Column colors indicate SEL (yellow) and FEL (green). The estimated gene family names, identified using S. cerevisiae as a reference, are listed to the right of the columns. b. The pre-mRNA splicing pathway. Gene family names are marked at specific steps encoded in the pathway that experienced contractions or losses in the FEL. c. Genes encoding the DASH complex. d. Carbon metabolism pathways containing widespread gene loss or contraction in the Dipodascales FEL. Pathway names and reactions are indicated in corresponding colors. Steps encoded by genes experiencing contraction or loss are represented by dashed lines labeled with the gene name (gene family contractions – short dashes, gene family losses - long dashes). Pathways are abridged to show steps relevant to reported losses and contractions and not all intermediate metabolites are shown. Black arrows indicate where glycerol (gained in FEL) and xylose & arabinose (lost in FEL) feed into central carbon metabolism.
Figure 5:
Figure 5:. Yeasts have undergone a complex evolutionary history of gene families.
The branches following the MRCA of each order have been collapsed to simplify the tree structure. Gene counts are marked on each node, with the corresponding node label positioned to its right. Gene gains are highlighted in red, while losses are depicted in blue along each branch. Additionally, branches are annotated with key terms from enriched GO terms (P ≤ 0.05); here, red signifies gene family expansion, and blue denotes contraction. A bar plot to the right of the tree quantifies the net changes in gene families within the phylogeny after the MRCA of each order. The y-axis, labeled “count”, reflects the number of gene families that underwent net changes—categorized into expansion, contraction, or no change. Expansion of a gene family is defined by a sum of net changes in copy number across all branches of an order being greater than 0, while contraction is defined by a sum less than 0, and no change is defined as a net change equal to 0.

Similar articles

References

    1. One Thousand Plant Transcriptomes Initiative. One thousand plant transcriptomes and the phylogenomics of green plants. Nature 574, 679–685 (2019). - PMC - PubMed
    1. Ocaña-Pallarès E. et al. Divergent genomic trajectories predate the origin of animals and fungi. Nature 609, 747–753 (2022). - PMC - PubMed
    1. Merényi Z. et al. Genomes of fungi and relatives reveal delayed loss of ancestral gene families and evolution of key fungal traits. Nat Ecol Evol 7, 1221–1231 (2023). - PMC - PubMed
    1. Wang G. et al. Exploring fatty alcohol-producing capability of Yarrowia lipolytica. Biotechnol. Biofuels 9, 107 (2016). - PMC - PubMed
    1. Madzak C. Yarrowia lipolytica Strains and Their Biotechnological Applications: How Natural Biodiversity and Metabolic Engineering Could Contribute to Cell Factories Improvement. J Fungi (Basel) 7, (2021). - PMC - PubMed

Publication types