[Preprint]. 2024 Jun 6:2024.06.04.597452.
doi: 10.1101/2024.06.04.597452.

Structural polymorphism and diversity of human segmental duplications

Affiliations

Structural polymorphism and diversity of human segmental duplications

Hyeonsoo Jeong et al. bioRxiv. .

Update in

  • Structural polymorphism and diversity of human segmental duplications.
    Jeong H, Dishuck PC, Yoo D, Harvey WT, Munson KM, Lewis AP, Kordosky J, Garcia GH; Human Genome Structural Variation Consortium (HGSVC); Yilmaz F, Hallast P, Lee C, Pastinen T, Eichler EE. Jeong H, et al. Nat Genet. 2025 Feb;57(2):390-401. doi: 10.1038/s41588-024-02051-8. Epub 2025 Jan 8. Nat Genet. 2025. PMID: 39779957 Free PMC article.

Abstract

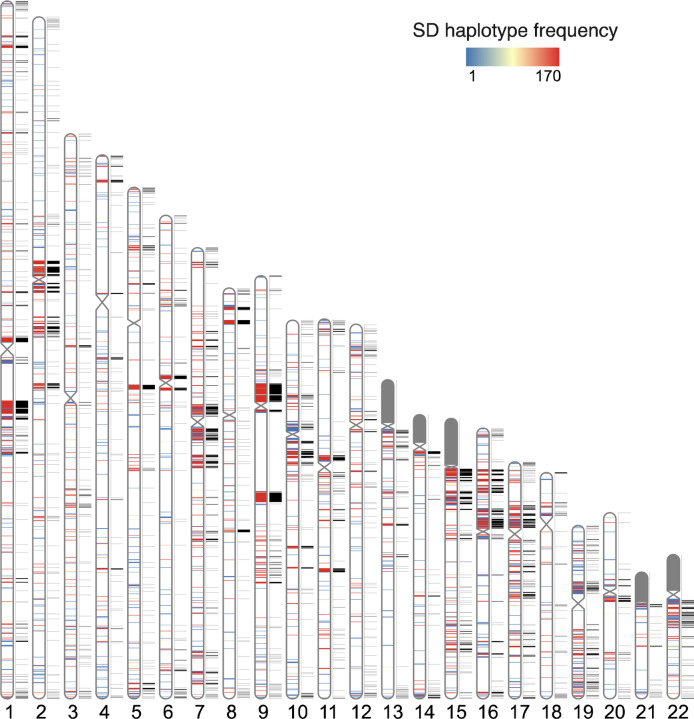
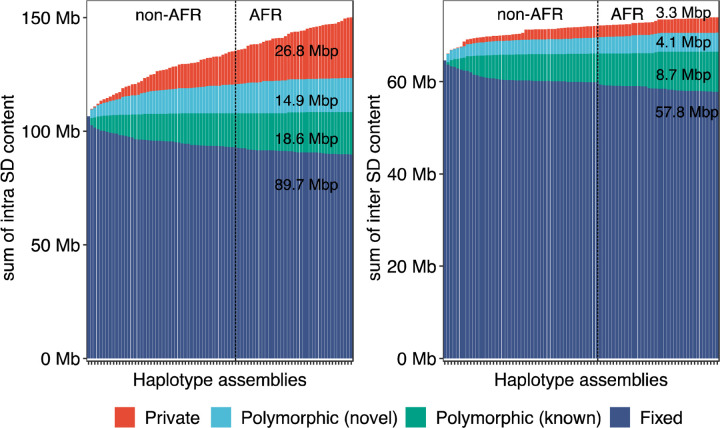
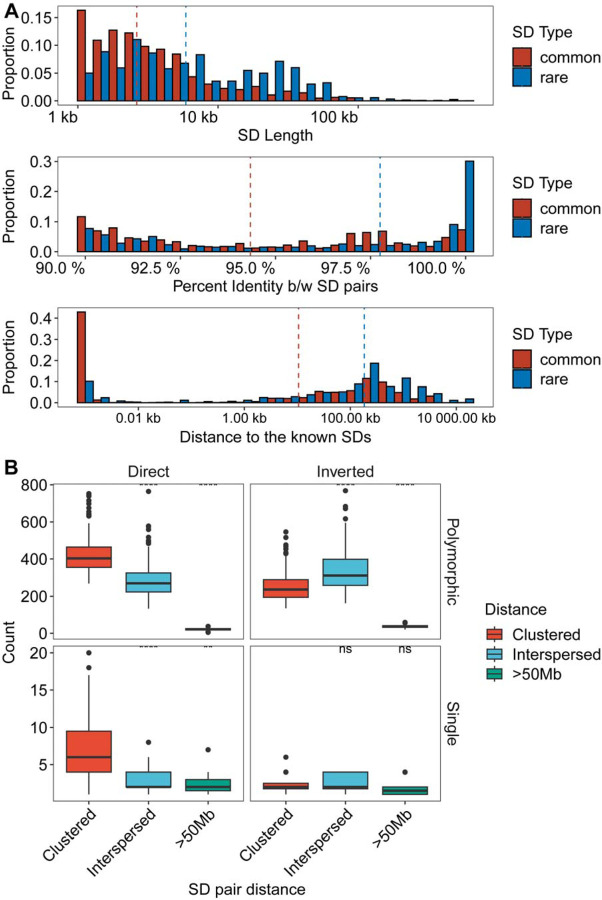
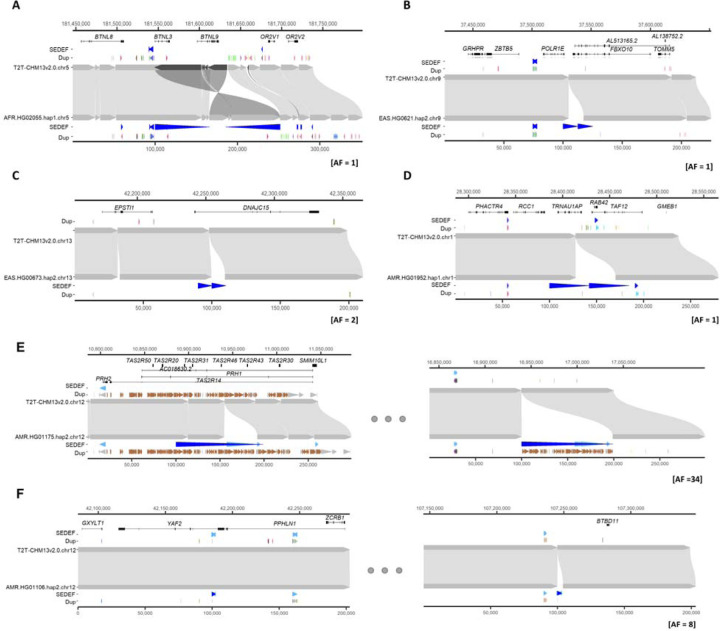
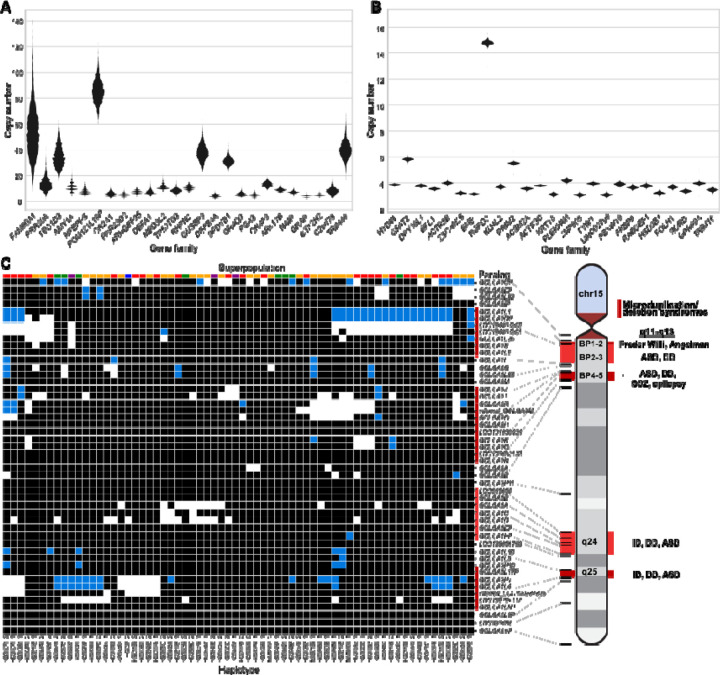
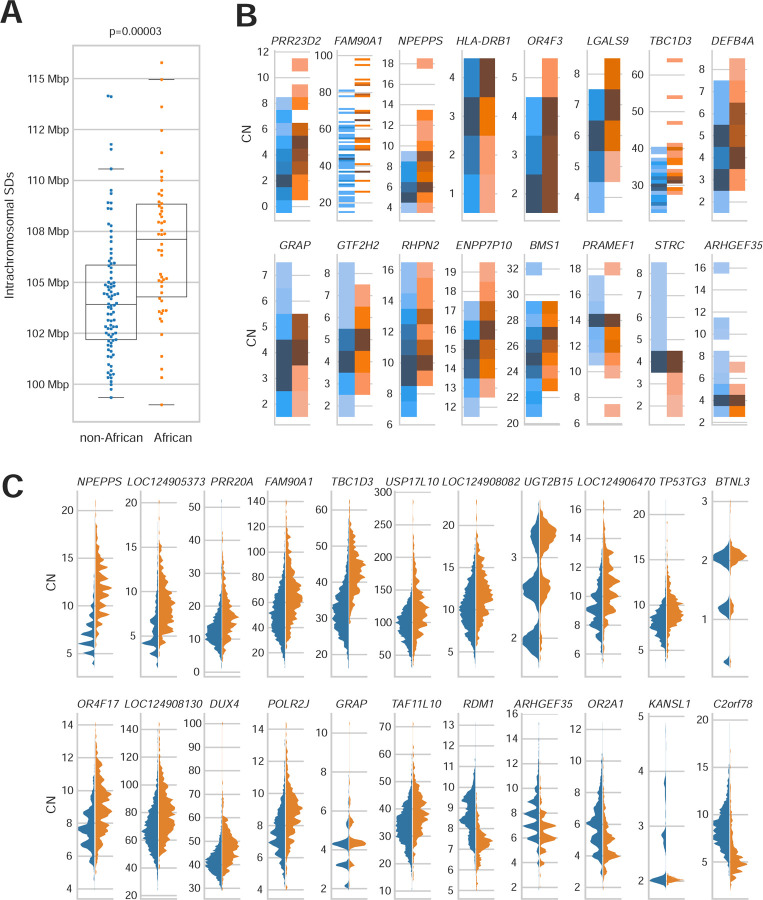
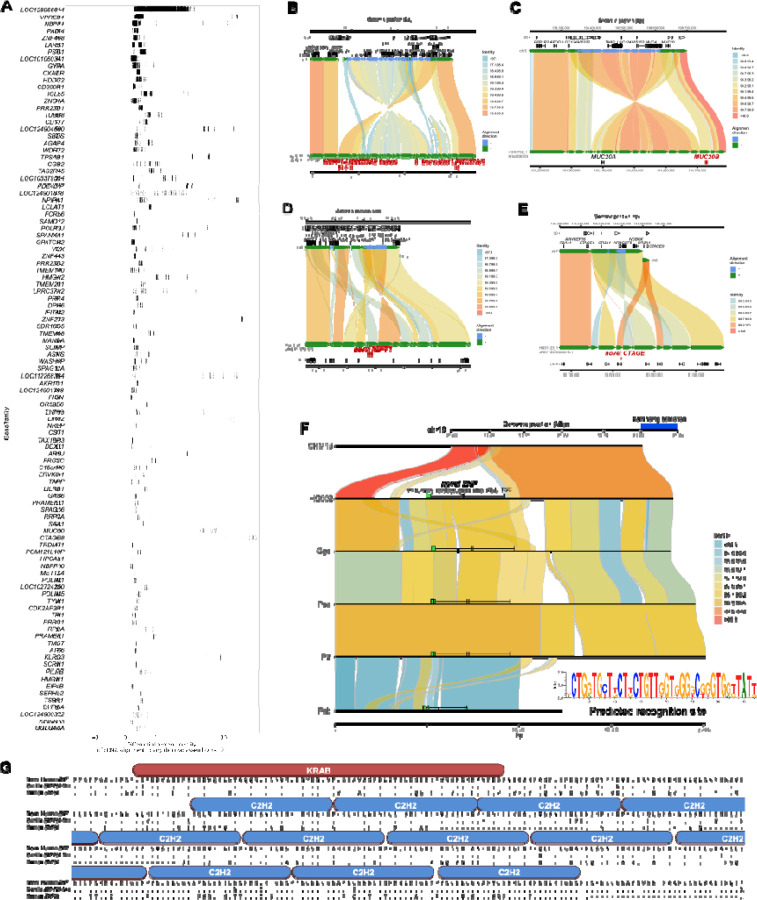
Segmental duplications (SDs) contribute significantly to human disease, evolution, and diversity yet have been difficult to resolve at the sequence level. We present a population genetics survey of SDs by analyzing 170 human genome assemblies where the majority of SDs are fully resolved using long-read sequence assembly. Excluding the acrocentric short arms, we identify 173.2 Mbp of duplicated sequence (47.4 Mbp not present in the telomere-to-telomere reference) distinguishing fixed from structurally polymorphic events. We find that intrachromosomal SDs are among the most variable with rare events mapping near their progenitor sequences. African genomes harbor significantly more intrachromosomal SDs and are more likely to have recently duplicated gene families with higher copy number when compared to non-African samples. A comparison to a resource of 563 million full-length Iso-Seq reads identifies 201 novel, potentially protein-coding genes corresponding to these copy number polymorphic SDs.


Conflict of interest statement

COMPETING INTERESTS E.E.E. is a scientific advisory board (SAB) member of Variant Bio, Inc. C.L. is an SAB member of Nabsys and Genome Insight. The other authors declare no competing interests.

Figures

Fig. 1.
Fig. 1.. Pangenome representation of human segmental duplications (SDs).
Haplotype frequency distribution of intrachromosomal SD content from HPRC and HGSVC haplotype genome assemblies (n=170). SDs are colored by the haplotype frequency. SD content on the p-arms of acrocentric chromosomes (chr13, chr14, chr15, chr21, and chr22) was excluded due to assembly errors and potential chromosomal misassignment compared to other autosomal chromosomes. The known SDs of T2T-CHM13 are shown in black next to the ideograms on each chromosome.
Fig. 2.
Fig. 2.. Cumulative sum of SDs by frequency.
Bar plot displays the cumulative sum of SD content by adding genomes (from left to right) for intrachromosomal and interchromosomal SDs. Four SD frequency categories are considered: “Fixed” are SDs present in all 170 human genome assemblies (i.e., conserved in all samples); “Polymorphic (known)” are SDs in the reference genome (T2T-CHM13) that are not fixed; “Polymorphic (novel)” refers to SDs observed in two or more HPRC/HGSVC assemblies yet not present in T2T-CHM13; “Private” is an SD found in one sample. Samples are grouped by non-African (non-AFR) and then African (AFR) genetic ancestry due to the expected increased diversity among the latter.
Fig. 3.
Fig. 3.. Sequence properties of polymorphic versus rare SDs.
(A) Histogram comparing the sequence identity and length of rare and common SDs (see Supplementary figure 1 for polymorphic SDs with more subclassified haplotype frequencies). (B) Orientation and pairwise dispersion of polymorphic and singleton SDs. Each data point represents haplotype assembly, and their counts of clustered, interspersed (>1 Mbp apart), and distant (>50 Mbp apart) SDs. Left and right panels summarize the SDs in direct or inverted orientation while the top and bottom panels contrast polymorphic vs. singleton SDs.
Fig. 4.
Fig. 4.. Examples of clustered (A-D) and interspersed (E-F; >1 Mbp apart) SDs associated with genes.
In each plot, the top represents the T2T-CHM13 genome aligned to bottom, new genome assemblies. (A) Clustered duplication with inverted orientation (65.8 kbp; with allele frequency [AF] = 1) found in chr5 and (B-D) clustered and tandem duplications (12.6, 10.3 and 42.3 kbp; with AF of 1, 2 and 1, respectively) in chr9, chr13 and chr1. (E-F) Interspersed duplications of chr 12 (98.9 and 2.5 kbp; with AF = 34 and 8) showing duplicated regions in left and right panels. The gene track of the T2T-CHM13 genome assembly is shown at the top, followed by SDs predicted by SEDEF and the respective direction indicated by blue arrowheads. The DupMasker track shows the duplicon structure.
Fig. 5.
Fig. 5.. Variable copy number of duplicated genes.
(A-B) Gene families with highly variable (A) and nearly fixed (B) copy number are displayed. Gene families are selected and ordered by dispersion index, requiring an average diploid copy number greater than three. (C) Estimated copy number of GOLGA6/8 paralogs in each assembled haplotype, based on assembly alignments (white:0, black:1, blue:2). The continental population groups for each haplotype are indicated by color above each column (Africa: gold, East Asia: green, South Asia: purple, Europe: blue, the Americas: red). ASD: autism spectrum disorder, DD: developmental delay, ID: intellectual disability, SCZ: schizophrenia.
Fig. 6.
Fig. 6.. African vs. non-African SD copy number variation.
(A) Proportion of intrachromosomal SD content between African and non-African populations. African genomes have a higher SD content compared to non-African genomes, and the difference is significant for intrachromosomal SDs. (B) Gene family copy number variation between populations. Gene families with significant copy number differences between African and non-African populations are shown (Mann-Whitney U test, Benjamini-Hochberg adjusted p-value <0.05), excluding GUSPB3, which did not replicate in the larger cohort. Gene copy number (CN) was estimated from the assemblies by whole-genome alignment; 13/16 gene families average higher copy number in individuals of African ancestry (binomial, p = 0.01). (C) Gene copy number evaluated by Illumina read depth. The 22 gene families with the largest distribution shift are shown.
Fig. 7.
Fig. 7.. Discovery of novel gene/transcripts in rare and polymorphic SD regions.
(A) Examples of copy number polymorphic gene families where FLNC generated from Iso-Seq map better to the pangenome than to the T2T-CHM13 human genome reference. (B-E) Selected haplotypes containing novel gene predictions for MUC20, NBPF1, CTAGE, and LRRC37A compared to T2T-CHM13 reference where there is FLNC transcript support. Alignment color indicates percent identity. (F) Comparison of T2T-CHM13 (top) and HG002 maternal haplotype (bottom) depicts 48 kbp polymorphic SD region present in 66/170 haplotypes. Nonhuman apes all carry a copy of the duplicated sequence. ZNF predicted recognition site shown (inset). (G) Comparison of the novel ZNF to its best human match (ZNF98, 68% identity), and the most similar existing primate annotation (low-quality protein ZNF724-like in gorilla, 95% identity). ProSite-predicted KRAB-ZNP is shown above the sequence.

Similar articles

References

    1. International Human Genome Sequencing Consortium. Initial sequencing and analysis of the human genome. Nature 409, 860–921 (2001). - PubMed
    1. Bailey J. A., Yavor A. M., Massa H. F., Trask B. J. & Eichler E. E. Segmental duplications: organization and impact within the current human genome project assembly. Genome Res. 11, 1005–1017 (2001). - PMC - PubMed
    1. Eichler E. Interchromosomal duplications of the adrenoleukodystrophy locus: a phenomenon of pericentromeric plasticity. Hum. Mol. Genet. 6, 991–1002 (1997). - PubMed
    1. Trask B. J. et al. Members of the olfactory receptor gene family are contained in large blocks of DNA duplicated polymorphically near the ends of human chromosomes. Hum. Mol. Genet. 7, 13–26 (1998). - PubMed
    1. Church D. M. A next-generation human genome sequence. Science 376, 34–35 (2022). - PubMed

Publication types