[Preprint]. 2024 Jun 9:2024.06.06.597815.
doi: 10.1101/2024.06.06.597815.

The Capicua C1 Domain is Required for Full Activity of the CIC::DUX4 Fusion Oncoprotein

Affiliations

The Capicua C1 Domain is Required for Full Activity of the CIC::DUX4 Fusion Oncoprotein

Cuyler Luck et al. bioRxiv. .

Update in

Abstract

Rearrangements between genes can yield neomorphic fusions that drive oncogenesis. Fusion oncogenes are made up of fractional segments of the partner genes that comprise them, with each partner potentially contributing some of its own function to the nascent fusion oncoprotein. Clinically, fusion oncoproteins driving one diagnostic entity are typically clustered into a single molecular subset and are often treated a similar fashion. However, knowledge of where specific fusion breakpoints occur in partner genes, and the resulting retention of functional domains in the fusion, is an important determinant of fusion oncoprotein activity and may differ between patients. This study investigates this phenomena through the example of CIC::DUX4, a fusion between the transcriptional repressor capicua (CIC) and the double homeobox 4 gene (DUX4), which drives an aggressive subset of undifferentiated round cell sarcoma. Using a harmonized dataset of over 100 patient fusion breakpoints from the literature, we show that most bona fide CIC::DUX4 fusions retain the C1 domain, which is known to contribute to DNA binding by wild type CIC. Mechanistically, deletion or mutation of the C1 domain reduces, but does not eliminate, activation of CIC target genes by CIC::DUX4. We also find that expression of C1-deleted CIC::DUX4 is capable of exerting intermediate transformation-related phenotypes compared with those imparted by full-length CIC::DUX4, but was not sufficient for tumorigenesis in a subcutaneous mouse model. In summary, our results suggest a supercharging role for the C1 domain in the activity of CIC::DUX4.


Figures
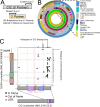
Figure 1.
Figure 1.
The capicua C1 domain is retained in most bona fide CIC::DUX4 fusion transcripts. (A) Schematic describing harmonization of patient breakpoint (b.p.) data. (B) Circos plot of all 108 nucleotide-level breakpoints gathered for CIC-fusion genes. (C) Scatterplot of breakpoint coordinates from 74 CIC::DUX4 transcripts where the data source was RNA and both partner breakpoints were available. Each data point is one breakpoint, histograms are intended to aid with overplotting. EBD: ERK-binding domain, NLS: nuclear localization signal, C1: C1 domain, HOX1/2: homeodomains 1/2, TAD: two overlapping putative transactivation regions identified in DUX4.
Figure 2.
Figure 2.
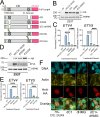
Deletion of the C1 domain reduces, but does not eliminate, CIC-target gene induction without overtly impacting CIC::DUX4 protein expression or localization. (A) Schematic of the engineered CIC::DUX4 deletion or point mutation variants. (B) Immunoblot of 293T cells approximately 48 hours after transfection with empty vector (EV) or the indicated constructs, data representative of three independent experiments. (C) Normalized RT-qPCR measurement of target gene (ETV4 and ETV5) induction in 293T cells approximately 48 hours after transfection with EV or the indicated constructs. Each data point represents the mean of one of three independent experiments, error bars indicate standard deviation, **** = p < 0.0001 by one-way ANOVA and Šidák’s multiple comparisons test. (D) Immunoblot of 293T cells approximately 48 hours after transfection with empty vector (EV) or the indicated constructs, data representative of three independent experiments. (E) Normalized RT-qPCR measurement of target gene (ETV4 and ETV5) induction in 293T cells approximately 48 hours after transfection with EV or the indicated constructs. Each data point represents the mean of one of three independent experiments, error bars indicate standard deviation, **** = p < 0.0001 and ** = p < 0.01 by one-way ANOVA and Šidák’s multiple comparisons test. (F) Confocal immunofluorescence imaging of 293T cells approximately 48 hours after transfection with the labeled constructs. DNA visualized with DAPI, actin visualized with rhodamine-phalloidin, 60x objective used for imaging, scale bars indicate 10 μm, representative cells chosen from one experiment.
Figure 3.
Figure 3.
Stable expression of C1-deleted CIC::DUX4 in clonal NIH/3T3 cells drives a largely attenuated transcriptomic program defined by full-length CIC::DUX4 expression. (A) Schematic describing how clonal populations of transduced NIH/3T3 and C2C12 cells were generated. (B) Immunoblot of selected clonal NIH/3T3 cell lines in comparison with plain untransduced NIH/3T3. Clones were evaluated for transgene expression three independent times including the initial clone screening. (C) Multi-dimensional scaling plot of NIH/3T3 clone RNA-seq data after processing with edgeR. (D) Row-scaled heatmap of 359 significantly upregulated (log2 fold change > 2, q < 0.01) genes in either of the CD4 vs EV or dC1 vs EV comparisons across six NIH/3T3 clones. (E) Volcano plots of differentially expressed genes between full-length CIC::DUX4 (CD4) or C1-deleted CIC::DUX4 (dC1) clones and empty vector (EV) clones. Maroon-colored genes were significantly upregulated (log2 fold change > 2, q < 0.01) in the CD4 vs EV comparison. Select known or high-confidence CIC/CIC::DUX4 target genes are labeled. (F) log2(counts per million) measurements for six selected known or high-confidence CIC/CIC::DUX4 target genes in NIH/3T3 clones, grouped by transduction. Bars represent mean values. In the edgeR differential expression analysis using quasi-likelihood F tests, all six genes were significantly different for CD4 vs EV (q < 0.01) and only four genes (Etv1, Etv4, Etv5, Vgf) were significantly different (q < 0.01) for dC1 vs EV.
Figure 4.
Figure 4.
Expression of CIC::DUX4 with or without the C1 domain can block differentiation and alter the growth patterns of clonal C2C12 cells. (A) Immunoblot of clonal C2C12 cells after differentiation for the indicated times, representative of two independent experiments. (B) Immunoblot of clonal C2C12 cells after differentiation for the indicated times and following transfection with non-targeting (ctrl) or human CIC targeting (hCIC) siRNA. Representative of two independent experiments. (C) Microscopy images of C2C12 clones after six days of differentiation. Imaged using a 20x objective, scale bar indicates 0.05 mm, representative of two independent experiments.
Figure 5.
Figure 5.
C1-deleted CIC::DUX4 expressing C2C12 cells do not initiate tumor formation in nude mice. (A) Schematic of clonal C2C12 subcutaneous implantation experimental design. (B) Plot of tumor volumes versus time, thin transparent lines indicate individual injection sites while thick opaque lines and data points represent averages. Error bars represent standard deviation. Note that three full-length CIC::DUX4 injected mice were sacrificed at day 14, and the remaining two mice in that group were sacrificed at day 16. (C) Ponceau S staining and immunoblots of clonal C2C12 cell lines or explanted tumor tissue. Tumor tissue is labeled by injected cell line, mouse number, and flank side. Protein analysis was performed once due to inability to detect CIC::DUX4 expression in tissue. (D) Agarose gel electrophoresis of PCR products from cDNA derived from C2C12 cell lines or explanted tumor tissue. Arrows indicate expected sizes of positive PCR products for the indicated transcripts. The smaller band at approximately 300–350 bp in the CIC::DUX4 reaction is nonspecific. +/−RT refers to inclusion/exclusion of reverse transcriptase in the cDNA generation step. Red pixels within bands indicates saturated signal. The same cDNA from tissue samples was tested two separate times with the same results.

Similar articles

References

    1. Zhang S., et al., PAX3-FOXO1 coordinates enhancer architecture, eRNA transcription, and RNA polymerase pause release at select gene targets. Mol. Cell 82, 4428–4442.e7 (2022). - PMC - PubMed
    1. Gryder B. E., et al., PAX3-FOXO1 establishes myogenic super enhancers and confers BET bromodomain vulnerability. Cancer Discov. 7, 884–899 (2017). - PMC - PubMed
    1. Riggi N., et al., EWS-FLI1 Utilizes Divergent Chromatin Remodeling Mechanisms to Directly Activate or Repress Enhancer Elements in Ewing Sarcoma. Cancer Cell 26, 668–681 (2014). - PMC - PubMed
    1. Boulay G., et al., Cancer-Specific Retargeting of BAF Complexes by a Prion-like Domain. Cell 171, 163–178.e19 (2017). - PMC - PubMed
    1. McBride M. J., et al., The SS18-SSX Fusion Oncoprotein Hijacks BAF Complex Targeting and Function to Drive Synovial Sarcoma. Cancer Cell 33, 1128–1141.e7 (2018). - PMC - PubMed

Publication types