Altered glucose kinetics occurs with aging: a new outlook on metabolic flexibility
- PMID: 38895979
- PMCID: PMC11427093
- DOI: 10.1152/ajpendo.00091.2024
Altered glucose kinetics occurs with aging: a new outlook on metabolic flexibility
Abstract
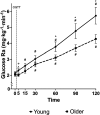
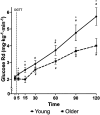
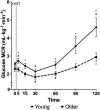
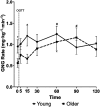
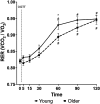
Our purpose was to determine how age affects metabolic flexibility and underlying glucose kinetics in healthy young and older adults. Therefore, glucose and lactate tracers along with pulmonary gas exchange data were used to determine glucose kinetics and respiratory exchange ratios [RER = carbon dioxide production (V̇co2)/oxygen consumption (V̇o2)] during a 2-h 75-g oral glucose tolerance test (OGTT). After an 12-h overnight fast, 28 participants, 15 young (21-35 yr; 7 men and 8 women) and 13 older (60-80 yr; 7 men and 6 women), received venous primed-continuous infusions of [6,6-2H]glucose and [3-13C]lactate with a [Formula: see text] bolus. After a 90-min metabolic stabilization and tracer equilibration period, volunteers underwent an OGTT. Arterialized glucose concentrations ([glucose]) started to rise 15 min post glucose consumption, peaked at 60 min, and remained elevated. As assessed by rates of appearance (Ra) and disposal (Rd) and metabolic clearance rate (MCR), glucose kinetics were suppressed in older compared to young individuals. As well, unlike in young individuals, fractional gluconeogenesis (fGNG) remained elevated in the older population after the oral glucose challenge. Finally, there were no differences in 12-h fasting baseline or peak RER values following an oral glucose challenge in older compared to young men and women, making RER an incomplete measure of metabolic flexibility in the volunteers we evaluated. Our study revealed that glucose kinetics are significantly altered in a healthy aged population after a glucose challenge. Furthermore, those physiological deficits are not detected from changes in RER during an OGTT.NEW & NOTEWORTHY To determine metabolic flexibility in response to an OGTT, we studied healthy young and older men and women to determine glucose kinetics and changes in RER. Compared to young subjects, glucose kinetics were suppressed in older healthy individuals during an OGTT. Surprisingly, the age-related changes in glucose flux were not reflected in RER measurements; thus, RER measurements do not give a complete view of metabolic flexibility in healthy individuals.
Keywords: OGTT; euglycemia; fractional gluconeogenesis; sex; tracer.
Conflict of interest statement
No conflicts of interest, financial or otherwise, are declared by the authors.
Figures



Similar articles
-
Sexual Harassment and Prevention Training.2024 Mar 29. In: StatPearls [Internet]. Treasure Island (FL): StatPearls Publishing; 2025 Jan–. 2024 Mar 29. In: StatPearls [Internet]. Treasure Island (FL): StatPearls Publishing; 2025 Jan–. PMID: 36508513 Free Books & Documents.
-
Different strategies for diagnosing gestational diabetes to improve maternal and infant health.Cochrane Database Syst Rev. 2017 Aug 23;8(8):CD007122. doi: 10.1002/14651858.CD007122.pub4. Cochrane Database Syst Rev. 2017. PMID: 28832911 Free PMC article.
-
Effectiveness and safety of vitamin D in relation to bone health.Evid Rep Technol Assess (Full Rep). 2007 Aug;(158):1-235. Evid Rep Technol Assess (Full Rep). 2007. PMID: 18088161 Free PMC article.
-
Exercise for reducing fear of falling in older people living in the community.Cochrane Database Syst Rev. 2014 Nov 28;2014(11):CD009848. doi: 10.1002/14651858.CD009848.pub2. Cochrane Database Syst Rev. 2014. PMID: 25432016 Free PMC article.
-
Circulating total and H-specific GDF15 levels are elevated in subjects with MASLD but not in hyperlipidemic but otherwise metabolically healthy subjects with obesity.Cardiovasc Diabetol. 2024 May 18;23(1):174. doi: 10.1186/s12933-024-02264-5. Cardiovasc Diabetol. 2024. PMID: 38762719 Free PMC article. Clinical Trial.
Cited by
-
Muscle Fuel Utilization with Glycolysis Viewed Right Side Up.Adv Exp Med Biol. 2025;1478:3-18. doi: 10.1007/978-3-031-88361-3_1. Adv Exp Med Biol. 2025. PMID: 40879933 Review.
-
Aging delays the suppression of lipolysis and fatty acid oxidation in the postprandial period.J Appl Physiol (1985). 2024 Nov 1;137(5):1200-1219. doi: 10.1152/japplphysiol.00437.2024. Epub 2024 Sep 5. J Appl Physiol (1985). 2024. PMID: 39236144
-
Delayed and diminished postprandial lactate shuttling in healthy older men and women.Am J Physiol Endocrinol Metab. 2024 Oct 1;327(4):E430-E440. doi: 10.1152/ajpendo.00183.2024. Epub 2024 Aug 7. Am J Physiol Endocrinol Metab. 2024. PMID: 39110417
-
Positive impact of a 10-min walk immediately after glucose intake on postprandial glucose levels.Sci Rep. 2025 Jul 2;15(1):22662. doi: 10.1038/s41598-025-07312-y. Sci Rep. 2025. PMID: 40594496 Free PMC article. Clinical Trial.
References
-
- World Health Organization. Global strategy and action plan on ageing and health. 2017. https://www.who.int/publications/i/item/9789241513500.
MeSH terms
Substances
Grants and funding
LinkOut - more resources
Full Text Sources
Medical
Research Materials
Miscellaneous

