. 2024 Jul 1;4(7):1677-1689.
doi: 10.1158/2767-9764.CRC-23-0464.

KRAS Promotes GLI2-Dependent Transcription during Pancreatic Carcinogenesis

Affiliations

KRAS Promotes GLI2-Dependent Transcription during Pancreatic Carcinogenesis

Ashley N Sigafoos et al. Cancer Res Commun. .

Abstract

Aberrant activation of GLI transcription factors has been implicated in the pathogenesis of different tumor types including pancreatic ductal adenocarcinoma. However, the mechanistic link with established drivers of this disease remains in part elusive. In this study, using a new genetically engineered mouse model overexpressing constitutively active mouse form of GLI2 and a combination of genome-wide assays, we provide evidence of a novel mechanism underlying the interplay between KRAS, a major driver of pancreatic ductal adenocarcinoma development, and GLI2 to control oncogenic gene expression. These mice, also expressing KrasG12D, show significantly reduced median survival rate and accelerated tumorigenesis compared with the KrasG12D only expressing mice. Analysis of the mechanism using RNA sequencing demonstrate higher levels of GLI2 targets, particularly tumor growth-promoting genes, including Ccnd1, N-Myc, and Bcl2, in KrasG12D mutant cells. Furthermore, chromatin immunoprecipitation sequencing studies showed that in these cells KrasG12D increases the levels of trimethylation of lysine 4 of the histone 3 (H3K4me3) at the promoter of GLI2 targets without affecting significantly the levels of other major active chromatin marks. Importantly, Gli2 knockdown reduces H3K4me3 enrichment and gene expression induced by mutant Kras. In summary, we demonstrate that Gli2 plays a significant role in pancreatic carcinogenesis by acting as a downstream effector of KrasG12D to control gene expression.


Conflict of interest statement

All authors have completed and submitted the ICMJE Form for Disclosure of Potential Conflicts of Interest. E.L. Schenk reports personal fees from CDR-Life, WC Communications, OncLive, Third bridge, Medscape, Amgen, Boehringer Ingelheim, IDEOlogy Health, Harpoon, Takeda, Slingshot Insights, Thetis Pharmaceuticals, Janssen, Curio Science, Global Data, BeiGeneius, Chameleon Communications, Horizon CME, AstraZeneca, Axon Advisors, The Scienomics Group, BioAtla, MJH Life Sciences, Regeneron, MedPro, G1 Therapeutics, Prescient Advisory, Actinium, Guidepoint Global, and ClearView outside the submitted work. A.L. Oberg reports grants from NIH NCI and The Lustgarten Foundation for Pancreatic Cancer Research during the conduct of the study. R.P. Graham reports other from Bristol Myers Squibb and Astellas outside the submitted work. No disclosures were reported by the other authors.

Figures

Figure 1
Figure 1
Gli2 promotes Kras-driven PDAC progression in vivo.A, Representation of animal crosses to generate model KCRG mice using CRG and KC mice. B, Kaplan–Meier curve depicting survival in KC and KCRG animals (log-rank test, P = 0.0058). C, Pie charts representing percentage of nontumor and adenocarcinoma incidence in KC (n = 13) and KCRG (n = 15) mice. D, Representative H&E stain of KC and KCRG mice depicting moderately differentiated and poorly differentiated adenocarcinoma. Scale bar, 100 μm. E, Pie charts representing percentage incidence of chronic pancreatitis, moderately differentiated adenocarcinoma, and poorly differentiated adenocarcinoma in Cre (n = 9), CRG (n = 7), KC (n = 13), and KCRG (n = 15) animals.
Figure 2
Figure 2
KCRG mice show increased tumor proliferation. A, Representative IHC images (left) and quantification (right) for the cell proliferation marker Ki67 (brown signal) in Cre (n = 3), CRG (n = 3), KC (n = 4), and KCRG (n = 4) mice. Scale bar, 200 μm. B, Masson trichrome staining immunocytochemistry representative images (left) and quantification (right) for collagen (blue signal) in Cre (n = 3) and CRG (n = 3) mice and KC (n = 4) and KCRG (n = 4) mice. Scale bar, 200 μm. C, Representative IHC images (left) and quantification (right) for macrophage marker F4/80 (brown signal) in Cre (n = 3), CRG (n = 3), KC (n = 4), and KCRG (n = 4) mice. Scale bar, 200 μm.
Figure 3
Figure 3
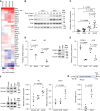
Gli2 is required for the regulation of Ccnd1 downstream of oncogenic KRAS. A, Heatmap of GLI target gene expression in 1012U cells at 12, 24, 48, and 72 hours posttreatment with doxycycline (Dox). B, Relative gene expression of Ccnd1 by qPCR in mouse pancreas tissue from Cre, CRG, KC, and KCRG mice. C, Western blot showing expression of p-ERK, total ERK, and CCND1 in 1012U −Dox and +Dox cells at 12, 24, 48, and 72 hours post treatment. Vinculin is used as the loading control. D, Relative gene expression of Ccnd1 and Gli2 by qPCR after the knockdown of Gli2 by siRNA in 1012U cells +Dox cells (72 hours treatment; P < 0.05 and P < 0.001). E, Western blot (left) and protein quantification (right) representing expression of CCDN1 and GLI2 in 1012U cells +Dox, after the knockdown of Gli2. Vinculin is used as the loading control. F, Western blot (left) and protein quantification (right) representing expression of CCDN1 and GLI2 in 1012U cells +Dox and murine KC cell line transfected with Gli2, ∆NGli2, or empty vector (control). Vinculin is used as the loading control. G, Top: Graphical representative of mouse Ccnd1 promoter region with (red) diamond indicating candidate Gli2-binding site. Bottom: Graph representing enrichment (percent input) of GLI2 at the Ccnd1 promoter in 1012U +Dox cells (72 hours treatment; P < 0.05).
Figure 4
Figure 4
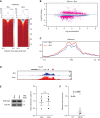
Gli2 drives H3K4me3 enrichment at Ccnd1 promoter in mutant KRAS cells. A, Heatmaps representing global levels of H3K4me3 enrichment in 1012U −Dox and 1012U +Dox cells. B, MA-plot highlighting differentially enriched H3K4me3 peaks in the 1012U +Dox cells compared with the 1012U −Dox cells. C, Profile plot of H3K4me3 at the transcriptional start site + or − 5 kb comparing 1012U +Dox cells with the 1012U −Dox cells. D, ChIP-seq tracks showing enrichment of H3K4me3 in 1012U –Dox and +Dox cells for GLI target gene Ccnd1. E, Western blot (left) and protein quantification (right) representing expression of H3K4me3 in 1012U cells +Dox. Total H3 is used as the loading control. F, H3K4me3 enrichment at Ccdn1 promoter in 1012U +Dox cells postknockdown of Gli2.

References

    1. Kasper M, Regl G, Frischauf A-M, Aberger F. GLI transcription factors: mediators of oncogenic Hedgehog signalling. Eur J Cancer 2006;42:437–45. - PubMed
    1. Nusslein-Volhard C, Wieschaus E. Mutations affecting segment number and polarity in Drosophila. Nature 1980;287:795–801. - PubMed
    1. Sigafoos AN, Paradise BD, Fernandez-Zapico ME. Hedgehog/GLI signaling pathway: transduction, regulation, and implications for disease. Cancers (Basel) 2021;13:3410. - PMC - PubMed
    1. Pietrobono S, Gagliardi S, Stecca B. Non-canonical hedgehog signaling pathway in cancer: activation of GLI transcription factors beyond smoothened. Front Genet 2019;10:556. - PMC - PubMed
    1. Lu L, Wu M, Zhao F, Fu W, Li W, Li X, et al. . Prognostic and clinicopathological value of Gli-1 expression in gastric cancer: a meta-analysis. Oncotarget 2016;7:69087–96. - PMC - PubMed

Publication types

MeSH terms