

Radiomic analysis based on magnetic resonance imaging for the prediction of VEGF expression in hepatocellular carcinoma patients
- PMID: 38896246
- PMCID: PMC11519187
- DOI: 10.1007/s00261-024-04427-0
Radiomic analysis based on magnetic resonance imaging for the prediction of VEGF expression in hepatocellular carcinoma patients
Abstract
Objective: The purpose of this study was to investigate the ability of radiomic characteristics of magnetic resonance images to predict vascular endothelial growth factor (VEGF) expression in hepatocellular carcinoma (HCC) patients.
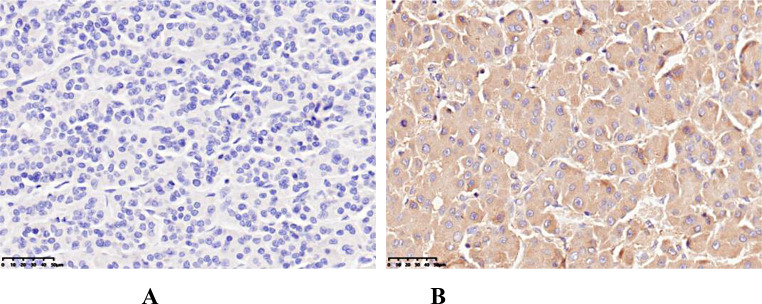
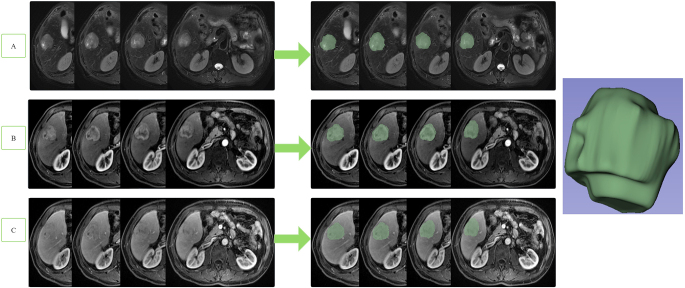
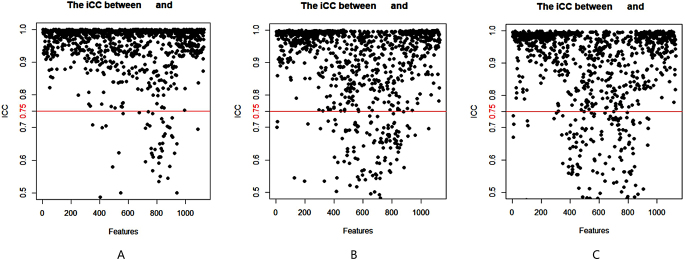
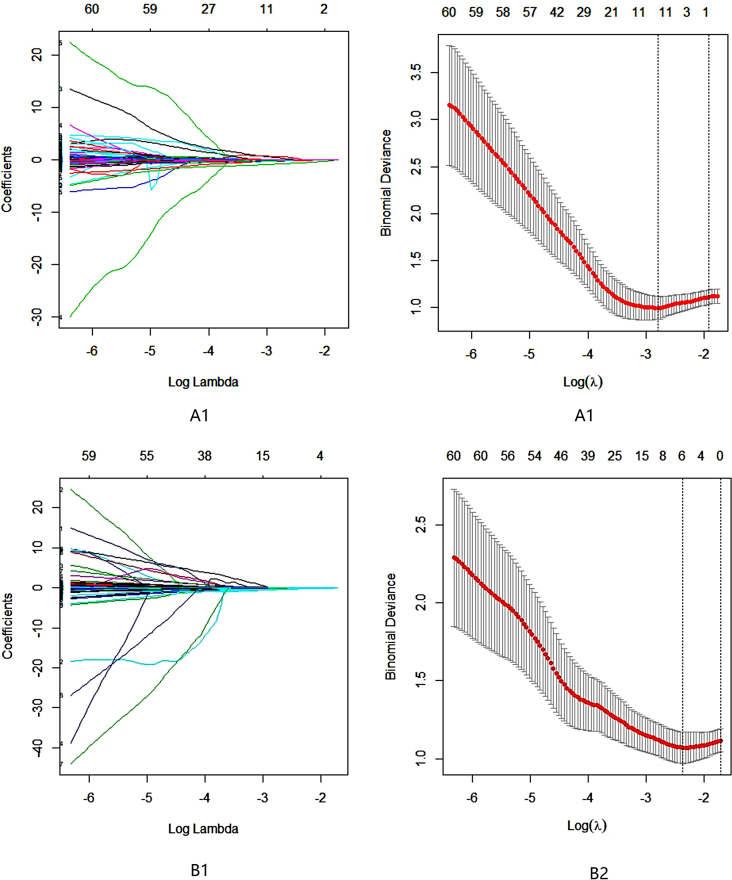
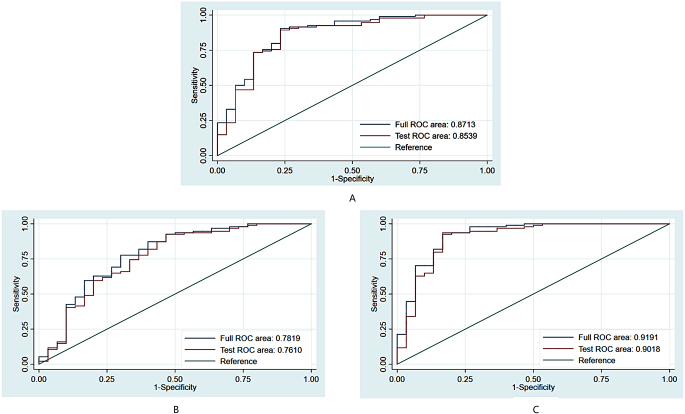
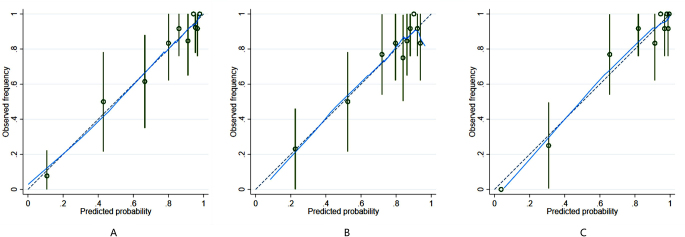
Methods: One hundred and twenty-four patients with HCC who underwent fat-suppressed T2-weighted imaging (FS-T2WI) and dynamic contrast-enhanced magnetic resonance imaging (DCE-MRI) one week before surgical resection were enrolled in this retrospective study. Immunohistochemical analysis was used to evaluate the expression level of VEGF. Radiomic features were extracted from the axial FS-T2WI, DCE-MRI (arterial phase and portal venous phase) images of axial MRI. Least absolute shrinkage and selection operator (LASSO) and stepwise regression analyses were performed to select the best radiomic features. Multivariate logistic regression models were constructed and validated using tenfold cross-validation. Receiver operating characteristic (ROC) curve analysis, calibration curve analysis and decision curve analysis (DCA) were employed to evaluate these models.
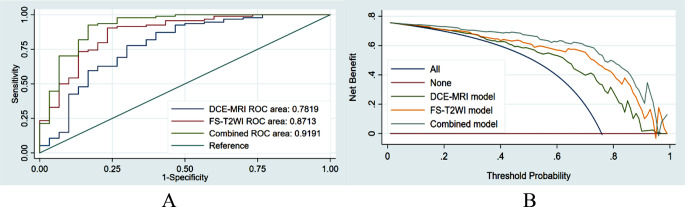
Results: Our results show that there were 94 patients with high VEGF expression and 30 patients with low VEGF expression among the 124 HCC patients. The FS-T2WI, DCE-MRI and combined MRI radiomics models had AUCs of 0.8713, 0.7819, and 0.9191, respectively. There was no significant difference in the AUC between the FS-T2WI radiomics model and the DCE-MRI radiomics model (p > 0.05), but the AUC for the combined model was significantly greater than the AUCs for the other two models (p < 0.05) according to the DeLong test. The combined model had the greatest net benefit according to the DCA results.
Conclusion: The radiomic model based on multisequence MR images has the potential to predict VEGF expression in HCC patients. The combined model showed the best performance.
Keywords: Angiogenesis; Hepatocellular carcinoma (HCC); Magnetic resonance imaging (MRI); Radiomics; Targeted therapy; Vascular endothelial growth factor (VEGF).
© 2024. The Author(s).
Conflict of interest statement
The authors have no conflicts of interest to declare.
Figures
Similar articles
-
Radiomics models based on multisequence MRI for predicting PD-1/PD-L1 expression in hepatocellular carcinoma.Sci Rep. 2023 May 12;13(1):7710. doi: 10.1038/s41598-023-34763-y. Sci Rep. 2023. PMID: 37173350 Free PMC article.
-
Radiomic analysis of Gd-EOB-DTPA-enhanced MRI predicts Ki-67 expression in hepatocellular carcinoma.BMC Med Imaging. 2021 Jun 15;21(1):100. doi: 10.1186/s12880-021-00633-0. BMC Med Imaging. 2021. PMID: 34130644 Free PMC article.
-
DCE-MRI-based radiomics in predicting angiopoietin-2 expression in hepatocellular carcinoma.Abdom Radiol (NY). 2023 Nov;48(11):3343-3352. doi: 10.1007/s00261-023-04007-8. Epub 2023 Jul 26. Abdom Radiol (NY). 2023. PMID: 37495746 Free PMC article.
-
Prediction of microvascular invasion in hepatocellular carcinoma patients with MRI radiomics based on susceptibility weighted imaging and T2-weighted imaging.Radiol Med. 2024 Aug;129(8):1130-1142. doi: 10.1007/s11547-024-01845-4. Epub 2024 Jul 13. Radiol Med. 2024. PMID: 38997568
-
MRI Imaging Biomarkers for Prognostication of Hepatocellular Carcinoma.J Korean Soc Radiol. 2025 May;86(3):364-380. doi: 10.3348/jksr.2025.0029. Epub 2025 May 28. J Korean Soc Radiol. 2025. PMID: 40502476 Free PMC article. Review.
Cited by
-
Computed tomography radiomics combined with clinical parameters for hepatocellular carcinoma differentiation: a machine learning investigation.Pol J Radiol. 2025 Mar 24;90:e140-e150. doi: 10.5114/pjr/200631. eCollection 2025. Pol J Radiol. 2025. PMID: 40321709 Free PMC article.
-
Advances in imaging techniques for tumor microenvironment evaluation in hepatocellular carcinoma.World J Gastroenterol. 2025 Mar 14;31(10):103454. doi: 10.3748/wjg.v31.i10.103454. World J Gastroenterol. 2025. PMID: 40093677 Free PMC article. Review.
-
Machine learning based ultrasomics noninvasive predicting EGFR expression status in hepatocellular carcinoma patients.Front Med (Lausanne). 2024 Nov 19;11:1483291. doi: 10.3389/fmed.2024.1483291. eCollection 2024. Front Med (Lausanne). 2024. PMID: 39624043 Free PMC article.
References
-
- Sung H, Ferlay J, Siegel RL, Laversanne M, Soerjomataram I, Jemal A, Bray F. Global Cancer Statistics 2020: GLOBOCAN Estimates of Incidence and Mortality Worldwide for 36 Cancers in 185 Countries. CA Cancer J Clin, 2021;71(3):209–49. - PubMed
-
- Ranieri G, Patruno R, Ruggieri E, Montemurro S, Valerio P, Ribatti D. Vascular endothelial growth factor (VEGF) as a target of bevacizumab in cancer: From the biology to the clinic. Curr Med Chem, 2006;13(16):1845–57. - PubMed
-
- Finn RS, Qin S, Ikeda M, Galle PR, Ducreux M, Kim TY, Kudo M, Breder V, Merle P, Kaseb AO et al. Atezolizumab plus Bevacizumab in Unresectable Hepatocellular Carcinoma. N Engl J Med, 2020;382(20):1894–905. - PubMed
Publication types
MeSH terms
Substances
LinkOut - more resources
Full Text Sources
Medical
