Practice Guideline
. 2024 Feb;121(3):e20240110.
doi: 10.36660/abc.20240110.

Brazilian Guideline for Exercise Test in the Adult Population - 2024

[Article in Portuguese, English]
Affiliations
Practice Guideline

Brazilian Guideline for Exercise Test in the Adult Population - 2024

[Article in Portuguese, English]
Tales de Carvalho et al. Arq Bras Cardiol. 2024 Feb.
No abstract available


Figures

Figura 1
Figura 1. – Posicionamento dos eletrodos nas derivações clássicas de Mason-Likar e derivações modificadas preservando CM. BD: braço direito; BE: braço esquerdo; PD: perna direita; PE: perna esquerda.
Figura 2
Figura 2. – Posicionamento dos eletrodos no sistema de 13 derivações com CM5. BD: braço direito; BE: braço esquerdo; PD: perna direita; PE: perna esquerda; CM5: eletrodo adicional.
Figura 3
Figura 3. – Definição de sensibilidade, especificidade, valores preditivos e acurácia. VP: verdadeiro positivo – quando o exame se apresenta positivo e o paciente tem a doença investigada; FP: falso-positivo – quando o exame se apresenta positivo em paciente sem doença; VN: verdadeiro negativo – quando o exame se apresenta negativo e o paciente não tem doença; FN: falso-negativo – quando o exame se apresenta negativo, mas o paciente tem a doença investigada.
Figura 4
Figura 4. – Escalas de esforço percebido de Borg e Borg modificada.
Figura 5
Figura 5. – Mecanismos e fatores associados ao surgimento e progressão da intolerância ao esforço e papel do TE. DAC: doença arterial coronariana; IC: insuficiência cardíaca; FA: fibrilação atrial; DAP: doença arterial periférica; TE: teste ergométrico; FC: frequência cardíaca; ↓ METs: baixa aptidão cardiorrespiratória; ↑ FC basal: frequência cardíaca basal elevada; ↓ Reserva FC: redução da reserva cronotrópica; ↓ FCrec: recuperação lenta da FC pós-esforço.
Figura 6
Figura 6. – Valores de VO 2 /METs em relação à classe funcional e estado clínico. 6,232 VO 2 max: consumo máximo de oxigênio; TE: teste ergométrico; MET: metabolic equivalent of task (equivalente metabólico da tarefa). *New York Heart Association. **Dependendo da idade e do nível de atividade física.
Figura 7
Figura 7. – Escalas para quantificação de angina, dispneia e claudicação intermitente.
Figura 8
Figura 8. – Comportamento da frequência cardíaca e ajustes autonômicos durante o TE em adultos. FCmax: frequência cardíaca máxima; At.: atividade; min: minuto.
Figura 9
Figura 9. – Comportamento da pressão arterial sistólica e diastólica em adultos de ambos os sexos durante o TE. PAS: pressão arterial sistólica; PAD: pressão arterial diastólica; min: minuto.
Figura 10
Figura 10. – Principais comportamentos da pressão arterial durante o TE e suas repercussões. HAS: hipertensão arterial sistêmica; FSC: fluxo sanguíneo cerebral; R. Hipertensiva: resposta hipertensiva; Pos. ortostática: posição ortostática na esteira ergométrica; Cariorresp.: cardiorrespiratória; PA: pressão arterial, *Normotensão no pré-teste com resposta hipertensiva no esforço corresponde a risco de hipertensão arterial sistémica no futuro. * Associada a diminuição da atividade adrenérgica e vasodilatação histamina mediada. * Associado a hipertermia no esforço e desidratação prévia (inclusive secundária a diuréticos).
Figura 11
Figura 11. – Representação dos principais comportamentos das ondas P, Q, R, S, T, U, intervalo PR, segmentos PR e ST e ponto J durante a fase de esforço do TE. A. Esforço normal: onda P apresenta redução da duração e aumento de amplitude tornando-se apiculada; PRi apresenta redução com o aumento da frequência cardíaca (FC); segmento PR mantém-se inalterado (na linha de base); onda Q apresenta aumento do seu tamanho; onda R apresenta redução de tamanho concomitantemente ao aumento de onda S; ponto J mantém o mesmo nível do basal ou ocorre pequeno infradesnível; segmento ST mantém-se na linha de base ou pode apresentar infradesnivelamento ascendente rápido; onda T mantém seu tamanho e morfologia com componente inicial rápido e componente final lento (pode apresentar pequena diminuição e redução da duração); onda U tende a manter-se positiva no início do esforço e, com aumento da FC, tende a desaparecer. B. Esforço alterado: onda P apresenta aumento da duração e redução de amplitude; PRi mantém-se inalterado mesmo com o aumento da FC; infradesnivelamento do segmento PR >0,5 mm; manutenção da amplitude da onda Q; onda R inalterada mesmo com progressão do esforço e redução da onda S; infradesnivelamento do ponto J associado a infradesnivelamento do segmento ST com morfologia retificada e ponto Y ≥1,0 mm; redução da amplitude da onda T tendendo a simétrica; negativação da onda U. C. Esforço alterado: onda P apresenta aumento da duração tornando-se entalhada; aumento do PRi com o aumento da FC; desaparecimento de onda Q; aumento da amplitude da onda R com redução concomitante de onda S; infradesnivelamento do ponto J associado a infradesnivelamento do segmento ST descendente (ponto Y ≥1,0 mm); aumento da amplitude de onda T, apiculada e simétrica.
Figura 12
Figura 12. – Padrões de supradesnivelamento do segmento ST incluindo a repolarização precoce. Seg. ST: segmento ST; Suprad. Seg. ST: supradesnivelamento do segmento ST; ms: milissegundos. *Supradesnivelamento do segmento ST esforço-induzido (≥1,0 mm medido a 60 ms após o ponto J). **No padrão de repolarização precoce, o supradesnivelamento do segmento ST deve ser medido a 100 ms após o ponto Jt, e também utilizado para avaliar o padrão de supradesnivelamento (ascendente, horizontal ou descendente).
Figura 13
Figura 13. – Comportamento do segmento ST e tipos de infradesnivelamento. *Ascendente, horizontal ou descente: dependendo da FC no momento de medida, o ponto Y estará em 60 ou 80 ms do ponto J. **Ascendente lento: aferido no ponto Y em 80 ms do ponto J.
Figura 14
Figura 14. – Exemplo de avaliação do intervalo QT, QTc e cálculo da histerese do QTc.
Figura 15
Figura 15. – Principais mecanismos e fatores envolvidos na arritmogênese durante o TE. *Permanecem como mecanismos durante todas as etapas do TE. ↑ = aumento. O 2 : oxigênio.
Figura 16
Figura 16. –Comportamento da onda pletismográfica normal (A), na baixa perfusão (B) e na presença de artefatos (movimentação e ruído [C e D]).
Figura 17
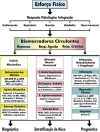
Figura 17. – Biomarcadores estudados na perspectiva de serem adicionados ao TE/TCPE. S.: sistema; SN: sistema nervoso; ANP: peptídio natriurético atrial; BNP: peptídio natriurético tipo B; NT-proBNP: peptídio natriurético tipo B – fragmento N-terminal inativo; GDF-15: fator-15 de diferenciação e crescimento; SST2: proteína receptora da interleucina-1; TrUS: troponina ultrassensível; CK-Mb: creatinoquinase fração MB; STRAIL: ligante indutor de apoptose relacionado ao fator de necrose tumoral; ADM: adrenomedulina; MR-pro-ADM: pró-adrenomedulina midregional; LDL oxidada: lipoproteína de baixa densidade oxidada; proET-1: peptídos precursores da endotelina 1; NGAL: lipocalina associada com gelatinase de neutrófilos humanos; NAG: N-acetil-Β-D-glucosaminidase; FGF-23: fator de crescimento de fibroblastos 23; CRP: proteína C-reativa; TNF-α: fator de necrose tumoral α; Lp-PLA2: fosfolipase A2 associada à lipoproteína (fator ativador de plaquetas); APO-1: apolipoproteína A-1; TIMP-1: inibidor tecidual de metaloproteinase 1; MMP: metaloproteinase; IL-6: interleucina-6.
Figura 18
Figura 18. – Equipamentos no TCPE: transdutores de fluxo e volume de ar, analisadores de O 2 e CO 2 , ECG, estetoscópio/esfigmomanômetro e sistema/software específico.
Figura 19
Figura 19. – Participação integrada e interdependente das vias metabólicas anaeróbicas e aeróbia no esforço físico.
Figura 20
Figura 20. – Em sedentários e treinados, o limiar anaeróbio (LV1 – limiar de lactato) relacionado à intensidade do esforço físico (% do VO 2 máximo).
Figura 21
Figura 21. – Aumento da ventilação pulmonar (VE) – inicialmente dependente quase exclusivamente do volume corrente (VC) que logo atinge um platô, ficando em seguida dependente apenas do incremento da frequência respiratória (FR).
Figura 22
Figura 22. – Em TCPE máximo, consumo de oxigênio (VO 2 ) em valores absolutos (em L/min), relativos (em mL/kg/min) e em equivalentes metabólicos (METs). A característica da curva de VO 2 , com platô no pico de esforço indica que paciente atingiu o VO 2 máximo.
Figura 23
Figura 23. – TCPE, o consumo de oxigênio (VO 2 ) apresentado em valores absolutos* e a carga de trabalho em Watts. VO 2 pico: curva de VO 2 sem platô no pico de esforço indicando que o paciente não atingiu o VO 2 máximo. Figura ilustrativa: na prática, normalmente apresenta-se o valor de VO 2 em valores relativos ao peso corporal.
Figura 24
Figura 24. – A e B . Limiar Anaeróbio (LV1) determinado a partir das relações VE/VO 2 (A) e VCO 2 /VO 2 (B).
Figura 25
Figura 25. – Segundo limiar (LV2), a partir do equivalente ventilatório de CO 2 (VE/VCO 2 ) que se encontra anormal em indivíduo com insuficiência cardíaca (IC) e normal em saudável. A relação VE/VCO 2 é preditor de mortalidade e hospitalização na IC, indicando pior prognóstico se relação ≥34.
Figura 26
Figura 26. – Equivalentes ventilatórios de oxigênio (VE/VO 2 ) e de dióxido de carbono (VE/VCO 2 ) relacionados à carga de trabalho e curva de lactato sanguíneo, com visualização dos pontos correspondentes aos limiares ventilatórios (LV1 e LV2) e ponto ótimo cardiorrespiratório (POC).
Figura 27
Figura 27. – Pressões parciais expiratórias do oxigênio (PETO 2 ) e dióxido de carbono (PETCO 2 ), com determinação dos limiares ventilatórios (LV1 e LV2).
Figura 28
Figura 28. – A e B . Apresentação de pulsos de O 2 anormais devido à isquemia miocárdica: A = queda; B = platô.
Figura 29
Figura 29. – Relação ∆VO 2 /∆WR característica da isquemia miocárdica.
Figura 30
Figura 30. – Eficiência de captação de oxigênio (OUES) em indivíduos com boa eficiência (normal) e baixa eficiência (na insuficiência cardíaca).
Figura 31
Figura 31. – Ilustração da ventilação oscilatória em TCPE de paciente com grave insuficiência cardíaca (ICFEr).
Figura 32
Figura 32. – Em indivíduo saudável e paciente com IC, as cinéticas de oxigênio no esforço e recuperação, com seus respectivos T½.
Figura 33
Figura 33. – Medidas e variáveis do TCPE e suas principais inter-relações. O sistema/software integra informações e disponibiliza múltiplas variáveis de interesse clínico a partir de medidas: ventilatórias (via transdutores de fluxo e volume do ar inspirado); metabólicas (via análise de gases no ar expirado – VE, FEO 2 e FECO 2 ); hemodinâmicas (ECG, FC, PA). Dessas medidas, são geradas múltiplas variáveis que podem ser analisadas por meio de gráficos. VO 2 : consumo de oxigênio; VCO 2 : produção de CO 2 ; VE: ventilação pulmonar; EOV: ventilação oscilatória ao esforço; RV: reserva ventilatória; VVM: ventilação voluntária máxima; LV1: 1 º limiar ventilatório; LV2: 2 º limiar ventilatório; PETO 2 : pressão parcial expiratória final de oxigênio; PETCO 2 : pressão parcial expiratória final de dióxido de carbono; VO 2 max: consumo máximo de oxigênio; %VO 2 max: porcentagem do consumo máximo de oxigênio; FC: frequência cardíaca; FR: frequência respiratória; CT: carga de trabalho em Watts; VO 2 RD: retardo da recuperação do VO 2 ; OUES: inclinação da eficiência da captação do oxigênio; T½: tempo necessário para queda de 50% do VO 2 pico na recuperação; ΔVO 2 /ΔWR: relação delta VO 2 e delta carga de trabalho; POC: ponto ótimo cardiorrespiratório; Pulso O 2 : pulso de oxigênio; QR: quociente respiratório.
Figura 34
Figura 34. – Escolha da modalidade de estresse a ser aplicada na cintilografia perfusional miocárdica para diagnóstico de doença arterial coronariana. BRE: bloqueio de ramo esquerdo; TE: teste ergométrico; WPW: síndrome de Wolff-Parkinson-White; FC: frequência cardíaca; * 1 Capacidade funcional para realizar atividades físicas diárias estimadas >5 METs e habilidade para execução do esforço no ergômetro disponível; * 2 Outra opção: Regadenoson (ainda não disponível no Brasil); * 3 Possibilidade de realização a critério do médico solicitante. * 4 Por ser um exame diagnóstico, necessita realizar uma nova cintilografia sob estresse farmacológico (dipiridamol ou adenosina) ou estresse combinado, visando manter a acurácia do método.
Figura 35
Figura 35. – Representação do ecocardiograma sob estresse físico em cicloergômetro. PA: medida da pressão arterial sistémica; ECG: registro do eletrocardiograma; ECO: ecocardiograma; min: minuto.
Figure 1
Figure 1. – Electrode placement in the classic Mason-Likar lead system and its modified arrangement including lead CM5. RA: right arm; LA: left arm; RL: right leg; LL: left leg.
Figure 2
Figure 2. – Electrode placement for the 13-lead system (Mason-Likar + CM5). RA: right arm; LA: left arm; RL: right leg; LL: left leg; CM5: additional bipolar lead (extra electrode).
Figure 3
Figure 3. – Definitions of sensitivity, specificity, predictive values, and accuracy. TP: true positive – when the test is positive and the patient actually has the disease; FP: false positive – when the test is positive but a patient does not have the disease; TN: true negative – when the test is negative and the patient does not have the disease; FN: false negative – when the test is negative but the patient actually has the disease.
Figure 4
Figure 4. – Borg and Modified Borg Rating of Perceived Exertion scales.
Figure 5
Figure 5. – Mechanisms and factors associated with the emergence and progression of exercise intolerance and the role of ET. CAD: coronary artery disease; HF: heart failure; AF: atrial fibrillation; PAD: peripheral artery disease; ET: exercise test; HR: heart rate; ↓ METs: low cardiorespiratory fitness; ↑ Baseline HR: elevated baseline heart rate; ↓ HR Reserve: reduction of chronotropic reserve; ↓ HRrec: abnormal, slow, post-exercise recovery of HR.
Figure 6
Figure 6. – VO 2 /MET values in relation to functional class and clinical status. 6,232 VO 2 max: maximum oxygen consumption; ET: exercise test; MET: metabolic equivalent of task. *New York Heart Association. **Depending on age and level of physical activity.
Figure 7
Figure 7. – Scales for quantification of angina, dyspnea, and intermittent claudication.
Figure 8
Figure 8. – Heart rate response and autonomic adjustments during ET in adults. HRmax: maximal heart rate; Act.: activity; min: minute.
Figura 9
Figura 9. – Systolic and diastolic blood pressure response to ET in adult men and women. SBP: systolic blood pressure; DBP: diastolic blood pressure; min: minute.
Figure 10
Figure 10. – Main blood pressure responses to ET and their repercussions. HTN: hypertension; CBF: cerebral blood flow; Hypertensive Resp.: hypertensive response; Orthostatic pos.: orthostatic position on the treadmill; BP: blood pressure, *Pretest normotension with a hypertensive response to exercise indicates risk of future hypertension. * 2 Associated with decreased adrenergic activity and histamine-mediated vasodilation. * 3 Associated with hyperthermia on exertion and pre-existing dehydration (including secondary to diuretics).
Figure 11
Figure 11. – Representation of the main responses of the P, Q, R, S, T, and U waves, PR interval, PR and ST-segments, and J point during the exertion stage of an ET. A. Normal response to exercise: P wave duration reduces and amplitude increases (peaked P wave); PRi shortens with increasing heart rate (HR); PR segment remains unchanged (at baseline); Q wave increases in amplitude; R wave presents a reduction in amplitude concomitantly with the increase of the S wave; J point maintains the same baseline level or exhibits is a slight depression; ST-segment remains at baseline or may exhibit rapid upsloping depression; T wave amplitude and morphology remain unchanged, with a rapid initial component and a slow final component (may exhibit a small decrease in amplitude and reduction in duration); U wave tends to remain positive at the onset of exercise and disappear as the HR increases. B. Abnormal response: P wave exhibits increased duration and reduced amplitude; PRi remains unchanged despite increasing HR; PR segment depression >0.5 mm; Q wave amplitude unchanged; R wave unchanged despite progressive exertion and S wave reduction; J-point depression with horizontal ST-segment depression (Y-point ≥1.0 mm); reduction in amplitude of the T wave (tends to be symmetrical); negative U wave. C. Abnormal response: Increased P wave duration, with notched morphology; prolongation of PRi as the HR increases; Q wave disappears; increasing R-wave amplitude with concomitant reduction of the S wave; J-point depression with downsloping ST-segment depression (Y-point ≥1.0 mm); peaked and symmetric T wave with increased amplitude.
Figure 12
Figure 12. – ST-segment elevation patterns, including early repolarization. ST-seg.: ST-segment; ms: milliseconds. *Exercise-induced ST-segment elevation (≥1.0 mm measured at 60 ms after the J-point). **In the early repolarization pattern, ST-segment elevation should be measured 100 ms after the Jt point, and the pattern of elevation (upsloping, horizontal, or descending) should also be assessed.
Figure 13
Figure 13. – ST-segment behavior and types of ST depression. ST-seg.: ST-segment. *Upsloping, horizontal, or downsloping: depending on the HR at the time of measurement, the Y point will be 60 or 80 ms from the J point. **Slow upsloping: measured at point Y within 80 ms of the J point.
Figure 14
Figure 14. – Example of evaluation of the QT interval, QTc, and QTc hysteresis calculation.
Figure 15
Figure 15. – Main mechanisms and factors involved in arrhythmogenesis during ET. *Remain as potential mechanisms throughout all phases of the ET. ↑ = increase. O 2 : oxygen.
Figure 16
Figure 16. – Oximeter plethysmographic waveform behavior. Normal (A), in low perfusion (B), and in the presence of artifacts (movement [C] and noise [D]).
Figure 17
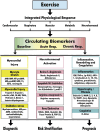
Figure 17. – Biomarkers with potential for adjunctive use in ET/CPET. Resp.: response; S.: system; NS: nervous system; ANP: atrial natriuretic peptide; BNP: B-type natriuretic peptide; NT-proBNP: inactive N-terminal fragment of B-type natriuretic peptide; GDF-15: growth differentiation factor-15; SST2: interleukin-1 receptor protein; u-hscTnI: ultra-high sensitivity cardiac troponin-I; CK-Mb: creatine kinase-MB fraction; TRAIL: tumor necrosis factor-related apoptosis-inducing ligand; MR-proADM: midregional pro-adrenomedullin; LDL: low-density lipoprotein; proET-1: endothelin 1 precursor peptides; NGAL: neutrophil gelatinase associated lipocalin; NAG: N-acetyl-beta-D-glucosaminidase; FGF23: fibroblast growth factor 23; CRP: C-reactive protein; TNF-α: tumor necrosis factor alpha; Lp-PLA2: lipoprotein-associated phospholipase A2 (platelet activating factor); APO-1: apolipoprotein A-1; TIMP-1: tissue inhibitor of metalloproteinase 1; MMP: matrix metalloproteinases; IL-6: interleukin-6.
Figure 18
Figure 18. – CPET equipment: air flow and volume sensors, O 2 and CO 2 analyzers, ECG, stethoscope/sphygmomanometer, and specific hardware/software.
Figure 19
Figure 19. – Integrated, interdependent participation of anaerobic and aerobic metabolic pathways in physical exertion.
Figure 20
Figure 20. – Anaerobic threshold (VT1 or lactate threshold) as a function of exercise intensity (% of VO 2 max) in sedentary and trained individuals.
Figure 21
Figure 21. – Increase in VE is initially dependent almost exclusively on VT, which soon plateaus; then becomes dependent solely on the increase in FR.
Figure 22
Figure 22. – Oxygen consumption (VO 2 ) in absolute values (L/min), relative values (mL/kg/min), and metabolic equivalents of task (METs) during a maximal CPET. A characteristic VO 2 curve plateauing at peak exertion indicates that the patient has reached VO 2 max.
Figure 23
Figure 23. – Oxygen consumption (VO 2 ) in absolute values* and workload in watts (W) during CPET. A VO 2 curve with no plateau at peak exertion indicates that the patient has not reached VO 2 max. (This image is purely illustrative: in practice, VO 2 is usually presented in values relative to body weight.)
Figure 24
Figure 24. – Anaerobic threshold (VT1) as determined by the VE/VO 2 (A) and VCO 2 /VO 2 (B) ratios.
Figure 25
Figure 25. – Second ventilatory threshold (VT2), derived from the ventilatory equivalent of CO 2 (VE/VCO 2 ), which is abnormal in heart failure (HF) and normal in healthy individuals. The VE/VCO 2 slope is a predictor of mortality and hospitalization in HF, indicating worse prognosis if ≥34.
Figure 26
Figure 26. – Ventilatory equivalents of oxygen (VE/VO 2 ) and carbon dioxide (VE/VCO 2 ) and their relationships to workload and blood lactate curve. Also shown are the ventilatory thresholds (VT1 and VT2) and cardiorespiratory optimal point (COP).
Figure 27
Figure 27. – End-tidal partial pressures of oxygen (PETO 2 ) and carbon dioxide (PETCO 2 ), with determination of ventilatory thresholds (VT1 and VT2).
Figure 28
Figure 28. – Abnormal oxygen pulse morphology due to myocardial ischemia. A = decreasing; B = flattening.
Figure 29
Figure 29. – ∆VO 2 /∆WR curve characteristic of myocardial ischemia.
Figure 30
Figure 30. – Oxygen uptake efficiency slope (OUES) in subjects with good (healthy) and low heart failure efficiency.
Figure 31
Figure 31. – Illustration of exercise oscillatory ventilation in the CPET of a patient with severe heart failure with reduced ejection fraction (HFrEF).
Figure 32
Figure 32. – Oxygen kinetics during exercise and recovery, with their respective T½ values, in a healthy individual and a patient with HFrEF.
Figure 33
Figure 33. – CPET measurements and variables and key inter-relationships. The system/software integrates information and returns multiple variables of clinical interest based on ventilatory (via flow transducers and inspired air volume), metabolic (via expired gas analysis: LV, FEO 2 , FECO 2 ), and hemodynamic (ECG, HR, BP) measurements. From these measurements, multiple variables are derived, which can then be analyzed graphically. VO 2 : oxygen consumption; VCO 2 : CO 2 production; VE: minute ventilation; EOV: exercise oscillatory ventilation; VR: ventilatory reserve; MVV: maximal voluntary ventilation; VT1: first ventilatory threshold; VT2: second ventilatory threshold; PETO 2 : end-tidal partial pressure of oxygen; PETCO 2 : end-tidal partial pressure of carbon dioxide; VO 2 max: maximum oxygen consumption; %VO 2 max:percentage of maximum oxygen consumption; HR: heart rate; RF: respiratory frequency; WL: work load in watts; VO2RD: oxygen uptake recovery delay; OUES: oxygen uptake efficiency slope; T½: time required for a 50% drop from VO 2 peak in recovery; ΔVO 2 /ΔWR: delta VO 2 to delta work load ratio; COP: cardiorespiratory optimal point; OP: oxygen pulse; RQ: respiratory quotient.
Figure 34
Figure 34. – Choice of stress modality to be combined with myocardial perfusion scintigraphy for the diagnosis of coronary artery disease. LBBB: left bundle branch block; ET: exercise test; WPW: Wolff-Parkinson-White; HR: heart rate; MPS: myocardial perfusion scintigraphy. * 1 Functional capacity to perform estimated daily physical activities >5 METs and ability to perform the necessary effort on whichever ergometer is available; * 2 Alternative: regadenoson (not yet available in Brazil); * 3 May be performed at the discretion of the requesting/referring physician. * 4 As this is a diagnostic test, a new myocardial perfusion scan under pharmacologic stress (dipyridamole or adenosine) or hybrid stress must be performed to ensure accuracy.
Figure 35
Figure 35. – Representation of an exercise stress echocardiogram performed on a bicycle/cycle ergometer. BP: blood pressure; ECG: electrocardiogram; ECHO: echocardiogram; min: minute.

Similar articles

  • Brazilian Guideline for Exercise Testing in Children and Adolescents - 2024.
    Carvalho T, Freitas OGA, Chalela WA, Hossri CAC, Milani M, Buglia S, Falcão AMGM, Costa RVC, Ritt LEF, Pfeiffer MET, Silva OBE, Imada R, Pena JLB, Avanza Júnior AC, Sellera CAC. Carvalho T, et al. Arq Bras Cardiol. 2024 Sep 16;121(8):e20240525. doi: 10.36660/abc.20240525. Arq Bras Cardiol. 2024. PMID: 39292116 Free PMC article. English, Portuguese.
  • [III Guidelines of Sociedade Brasileira de Cardiologia on the exercise test].
    Sociedade Brasileira de Cardiologia. Sociedade Brasileira de Cardiologia. Arq Bras Cardiol. 2010;95(5 Suppl 1):1-26. doi: 10.1590/S0066-782X2010000800001. Arq Bras Cardiol. 2010. PMID: 21340292 Portuguese. No abstract available.
  • Clinician's Guide to cardiopulmonary exercise testing in adults: a scientific statement from the American Heart Association.
    Balady GJ, Arena R, Sietsema K, Myers J, Coke L, Fletcher GF, Forman D, Franklin B, Guazzi M, Gulati M, Keteyian SJ, Lavie CJ, Macko R, Mancini D, Milani RV; American Heart Association Exercise, Cardiac Rehabilitation, and Prevention Committee of the Council on Clinical Cardiology; Council on Epidemiology and Prevention; Council on Peripheral Vascular Disease; Interdisciplinary Council on Quality of Care and Outcomes Research. Balady GJ, et al. Circulation. 2010 Jul 13;122(2):191-225. doi: 10.1161/CIR.0b013e3181e52e69. Epub 2010 Jun 28. Circulation. 2010. PMID: 20585013 Review. No abstract available.
  • ATS/ACCP Statement on cardiopulmonary exercise testing.
    American Thoracic Society; American College of Chest Physicians. American Thoracic Society, et al. Am J Respir Crit Care Med. 2003 Jan 15;167(2):211-77. doi: 10.1164/rccm.167.2.211. Am J Respir Crit Care Med. 2003. PMID: 12524257 Review. No abstract available.
  • Heart rate recovery: what now?
    Lauer MS. Lauer MS. J Intern Med. 2011 Dec;270(6):597-9. doi: 10.1111/j.1365-2796.2011.02452.x. Epub 2011 Oct 5. J Intern Med. 2011. PMID: 21910769 No abstract available.

Cited by

References

    1. Meneghelo RS, Araújo CG, Stein R, Mastrocolla LE, Albuquerque PF, Serra SM, et al. III Diretrizes da Sociedade Brasileira de Cardiologia sobre Teste Ergométrico. Arq Bras Cardiol . 2010;95(5) Suppl 1:1–26. doi: 10.1590/S0066-782X2010000800001. - DOI - PubMed
    1. Andrade J, Brito FS, Vilas-Boas F, Castro I, Oliveira JA, Guimarães JI, et al. II Diretrizes da Sociedade Brasileira de Cardiologia Sobre Teste Ergométrico. Arq Bras Cardiol . 2002;78(suppl 2) doi: 10.1590/S0066-782X2002000800001. - DOI - PubMed
    1. Guazzi M, Arena R, Halle M, Piepoli MF, Myers J, Lavie CJ. 2016 Focused Update: Clinical Recommendations for Cardiopulmonary Exercise Testing Data Assessment in Specific Patient Populations. Circulation . 2016;133(24):e694–e711. doi: 10.1161/CIR.0000000000000406. - DOI - PubMed
    1. Marcadet D-M, Pavy B, Bosser G, Claudot F, Corone S, Douard H, et al. French Society of Cardiology guidelines on exercise tests (part 1): Methods and interpretation. Arch Cardiovasc. Dis . 2018;111(12):782–790. doi: 10.1016/j.acvd.2018.05.005. - DOI - PubMed
    1. Smarz K, Jaxa-Chamiec T, Chwyczko T, Glówczynska R, Jegier A, Niedoszytko P, et al. Cardiopulmonary exercise testing in adult cardiology - expert opinion of the Working Group of Cardiac Rehabilitation and Exercise Physiology of the Polish Cardiac Society. Kardiol Pol . 2019 7-8;77:730–756. doi: 10.33963/KP.14889. - DOI - PubMed

LinkOut - more resources