. 2024 Jun 21;10(25):eadn4192.
doi: 10.1126/sciadv.adn4192. Epub 2024 Jun 19.

Signatures of wave erosion in Titan's coasts

Affiliations

Signatures of wave erosion in Titan's coasts

Rose V Palermo et al. Sci Adv. .

Abstract

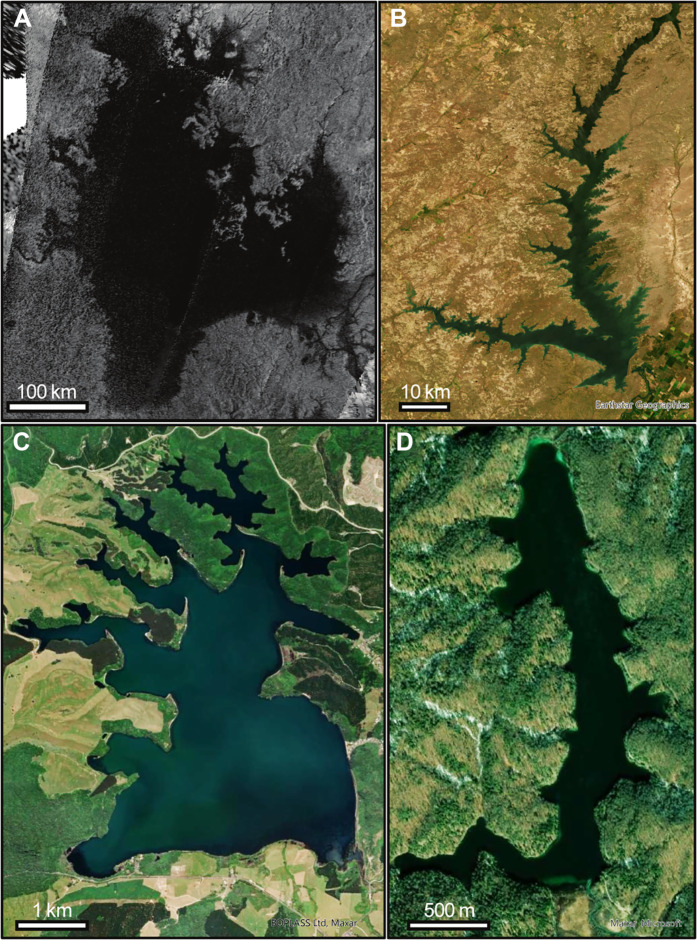
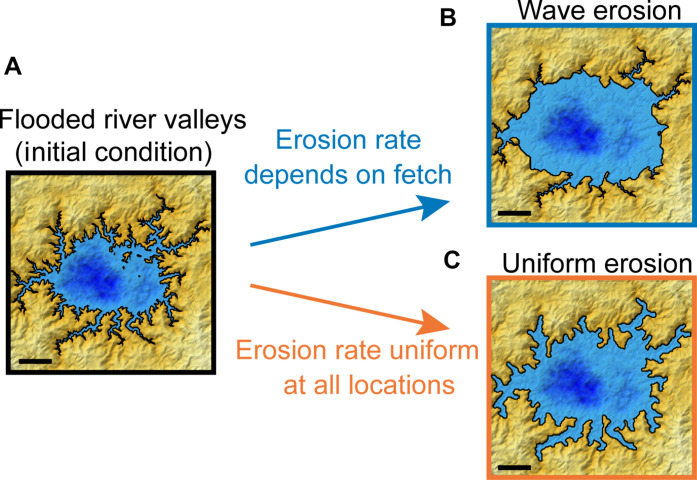
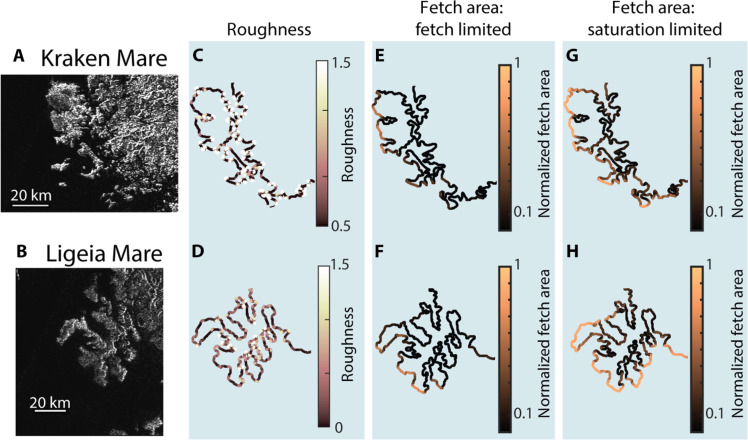
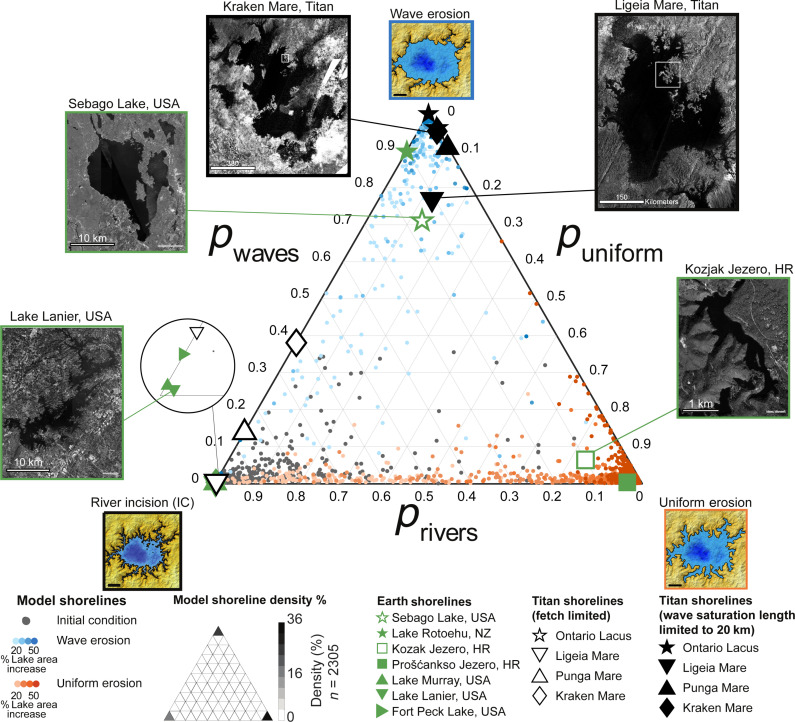
The shorelines of Titan's hydrocarbon seas trace flooded erosional landforms such as river valleys; however, it is unclear whether coastal erosion has subsequently altered these shorelines. Spacecraft observations and theoretical models suggest that wind may cause waves to form on Titan's seas, potentially driving coastal erosion, but the observational evidence of waves is indirect, and the processes affecting shoreline evolution on Titan remain unknown. No widely accepted framework exists for using shoreline morphology to quantitatively discern coastal erosion mechanisms, even on Earth, where the dominant mechanisms are known. We combine landscape evolution models with measurements of shoreline shape on Earth to characterize how different coastal erosion mechanisms affect shoreline morphology. Applying this framework to Titan, we find that the shorelines of Titan's seas are most consistent with flooded landscapes that subsequently have been eroded by waves, rather than a uniform erosional process or no coastal erosion, particularly if wave growth saturates at fetch lengths of tens of kilometers.


Figures

Fig. 1.
Fig. 1.. Lakes on Titan and Earth with coastlines shaped by a variety of erosional mechanisms.
(A) Cassini SAR image of Ligeia Mare, Titan (NASA). (B) Fort Peck Lake, United States, a reservoir formed recently by flooding a landscape previously eroded by rivers [Map data: Esri World Imagery, Earthstar Geographics (58)]. (C) Lake Rotoehu, New Zealand, a lake in which flooded river valleys have been subsequently eroded by waves [Map data: Esri World Imagery, BOPLASS Ltd., Maxar (58)]. (D) Prošćankso Jezero, Croatia, a karst lake in which flooded river valleys have been eroded by dissolution [Map Data: Esri World Imagery, Maxar, Microsoft (58)].
Fig. 2.
Fig. 2.. Distinct signatures of fluvial incision, wave erosion, and uniform erosion in numerical simulations of coastal erosion.
Shaded relief maps with color indicating liquid depth (darker blues are deeper) and land surface height (lighter yellows are higher) and black lines tracing the shoreline. (A) Initial shoreline generated by raising sea level in a landscape previously incised by rivers. The shoreline evolves to different shapes if subjected to (B) wave-driven coastal erosion in which the erosion rate depends on fetch—the distance wind blows to generate waves—and the angle of approach of incident waves or (C) uniform coastal erosion in which the erosion rate is the same at all locations. Scale bars have the same nondimensional length (number of model grid cells and cell size) in all three panels.
Fig. 3.
Fig. 3.. Comparison of roughness and fetch area for two example sections of Titan’s sea coasts.
NASA Cassini SAR images of stretches of coast along (A) Kraken Mare and (B) Ligeia Mare. Subsequent columns show corresponding maps of (C and D) shoreline roughness, (E and F) normalized fetch area assuming waves are fetch-limited, and (G and H) normalized fetch area assuming a saturation fetch length of 20 km. See Fig. 4 for regional maps of Kraken Mare and Ligeia Mare.
Fig. 4.
Fig. 4.. Ternary classification diagram of dominant coastal erosion mechanism.
Axes are the categorical probabilities that a shoreline was eroded dominantly by rivers alone (privers), fetch-dependent wave erosion (pwaves), or uniform erosion (puniform), as determined by a comparison of the shoreline’s JPDF of roughness and fetch area with those of model simulations. Images of example simulations from Fig. 2 are placed at the corners to aid interpretation of the diagram. Individual model simulations of wave erosion (blue circles) and uniform erosion (orange circles) are plotted, with point opacity indicating cumulative lake area increase due to erosion. Gray circles represent simulation initial conditions (IC) with shorelines eroded only by rivers. The density of the 2305 model shoreline points is shown as an inset in the legend, demonstrating that most model simulations are correctly categorized by driving mechanism with >90% categorical probability. Titan shorelines are plotted for two scenarios: fetch-limited waves (waves can grow across the entire sea; black open symbols) and saturation-limited waves (waves cease to grow at a fetch length of 20 km; black closed symbols). The fetch-limited Ontario Lacus data point is partially covered by the saturation-limited Kraken Mare data point. White boxes in NASA Cassini SAR images of Ligeia Mare and Kraken Mare indicate the locations shown in Fig. 3. Shorelines on Earth are plotted as green symbols, with inset aerial images of three examples [Map data: Esri World Imagery, Earthstar Geographics, Maxar, Microsoft (58)] and symbol shape indicating known dominant erosional mechanisms (stars, wave erosion; squares, dissolution; and triangles, river incision). Earth examples assume fetch-limited conditions due to small lake size. Earth examples are found in the United States (USA), Croatia (HR), and New Zealand (NZ). Ternary plot generated using Ternplot (59).

References

    1. Stofan E. R., Elachi C., Lunine J. I., Lorenz R. D., Stiles B., Mitchell K. L., Ostro S., Soderblom L., Wood C., Zebker H., Wall S., Janssen M., Kirk R., Lopes R., Paganelli F., Radebaugh J., Wye L., Anderson Y., Allison M., Boehmer R., Callahan P., Encrenaz P., Flamini E., Francescetti G., Gim Y., Hamilton G., Hensley S., Johnson W. T. K., Kelleher K., Muhleman D., Paillou P., Picardi G., Posa F., Roth L., Seu R., Shaffer S., Vetrella S., West R., The lakes of Titan. Nature 445, 61–64 (2007). - PubMed
    1. Hayes A., Aharonson O., Callahan P., Elachi C., Gim Y., Kirk R., Lewis K., Lopes R., Lorenz R., Lunine J., Mitchell K., Mitri G., Stofan E., Wall S., Hydrocarbon lakes on Titan: Distribution and interaction with a porous regolith. Geophys. Res. Lett. 35, 9 (2008).
    1. Hayes A. G., The lakes and seas of Titan. Annu. Rev. Earth Planet. Sci. 44, 57–83 (2016).
    1. Birch S. P. D., Hayes A. G., Dietrich W. E., Howard A. D., Bristow C. S., Malaska M. J., Moore J. M., Mastrogiuseppe M., Hofgartner J. D., Williams D. A., White O. L., Geomorphologic mapping of Titan’s polar terrains: Constraining surface processes and landscape evolution. Icarus 282, 214–236 (2017).
    1. Poggiali V., Mastrogiuseppe M., Hayes A. G., Seu R., Birch S. P. D., Lorenz R., Grima C., Hofgartner J. D., Liquid-filled canyons on Titan. Geophys. Res. Lett. 43, 7887–7894 (2016).