. 2024 Jun 21;10(25):eadn2332.
doi: 10.1126/sciadv.adn2332. Epub 2024 Jun 19.

Development of a nanoparticle-based tendon-targeting drug delivery system to pharmacologically modulate tendon healing

Affiliations

Development of a nanoparticle-based tendon-targeting drug delivery system to pharmacologically modulate tendon healing

Emmanuela Adjei-Sowah et al. Sci Adv. .

Abstract

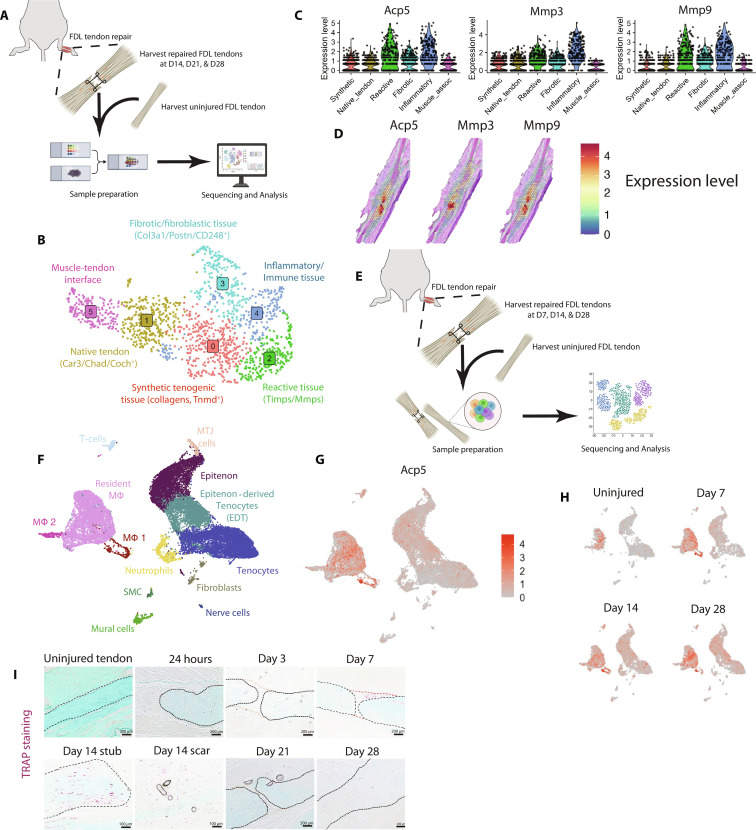
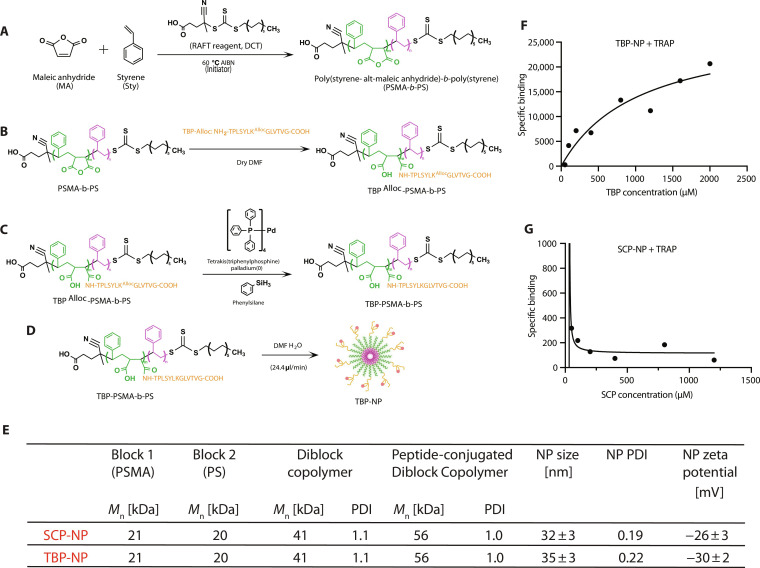
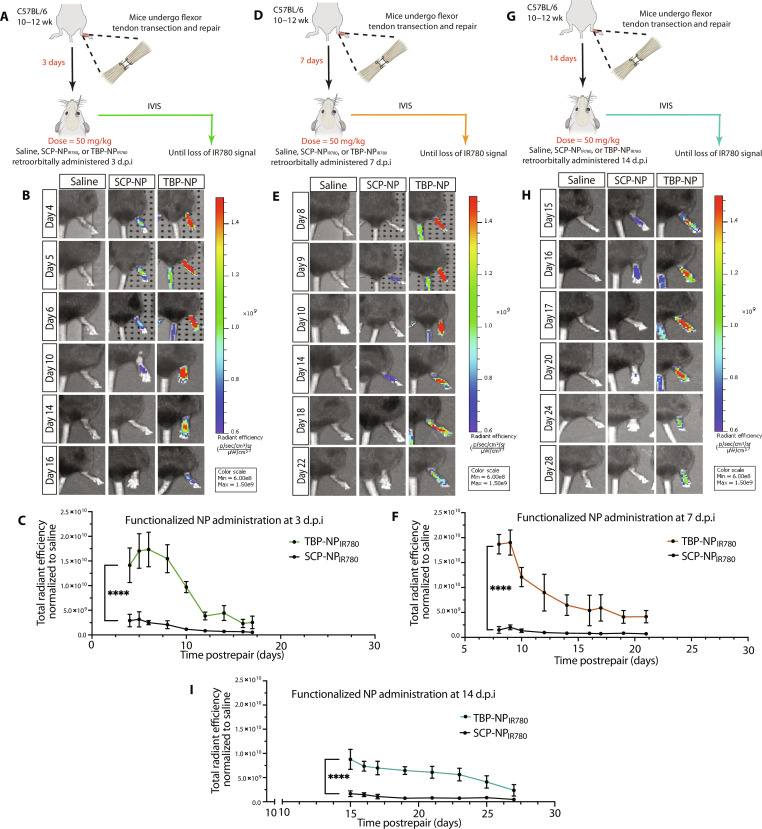
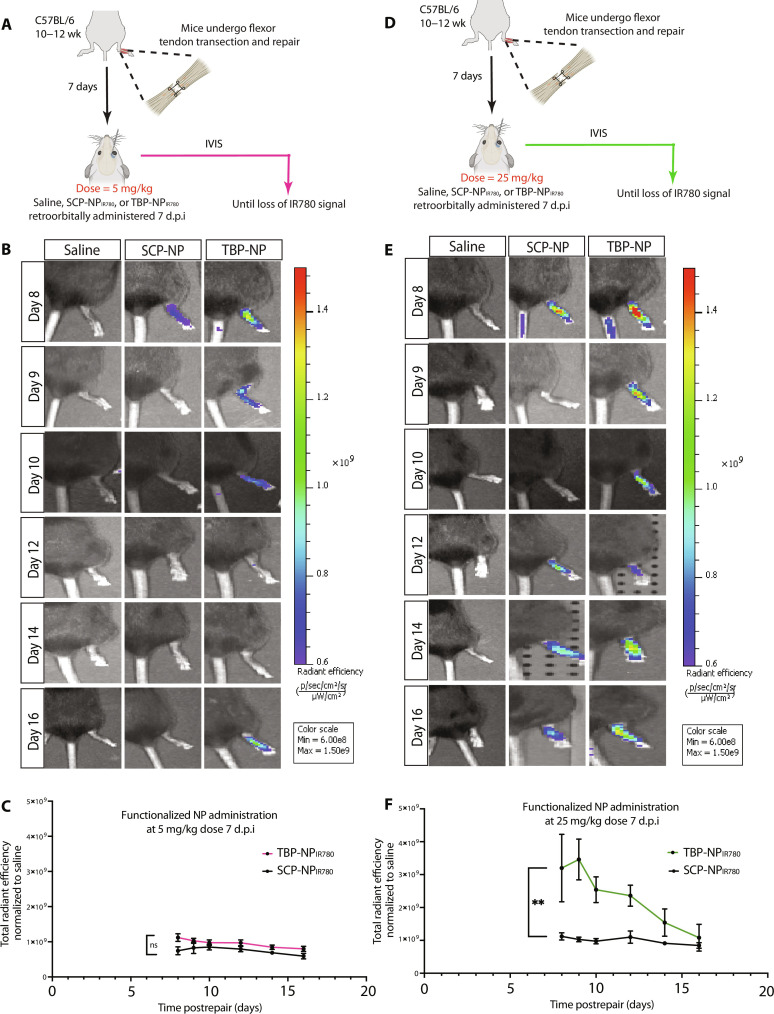
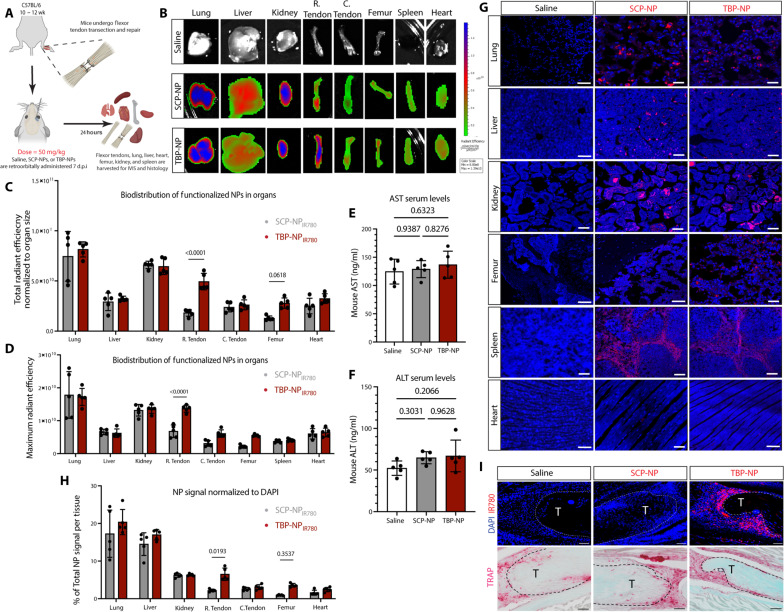
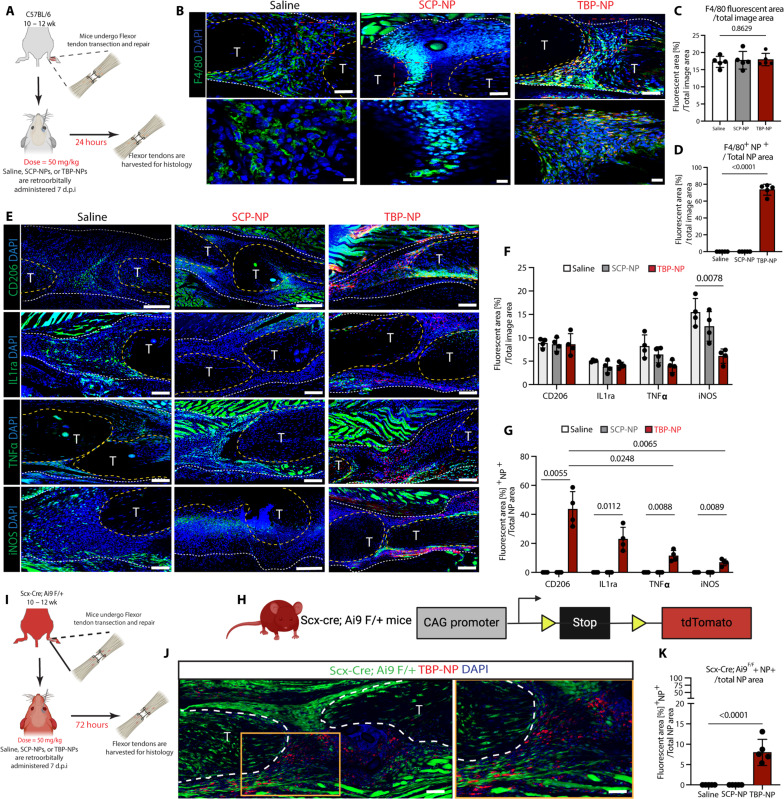
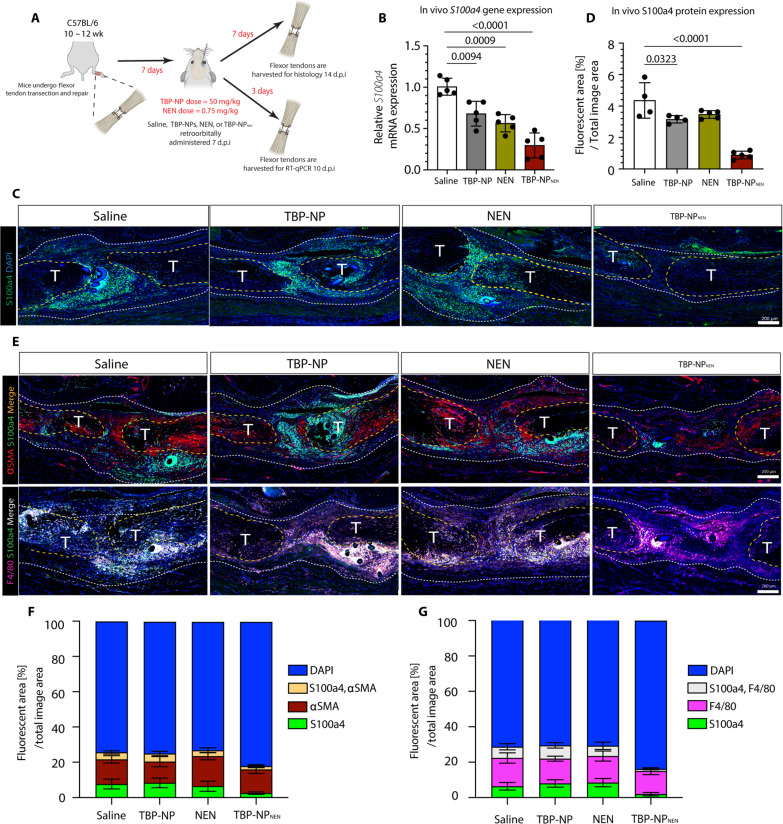
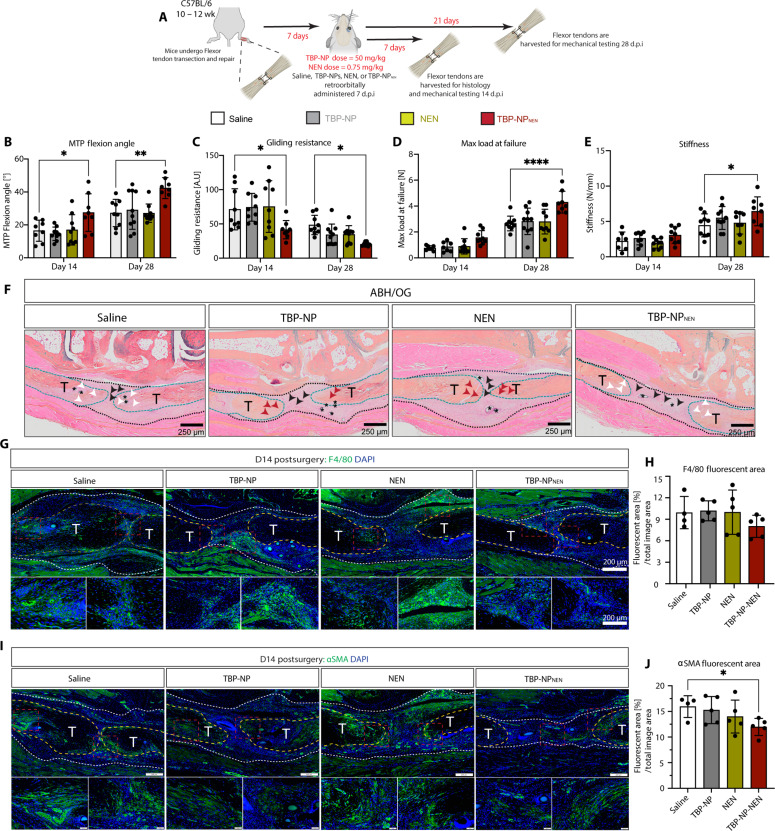
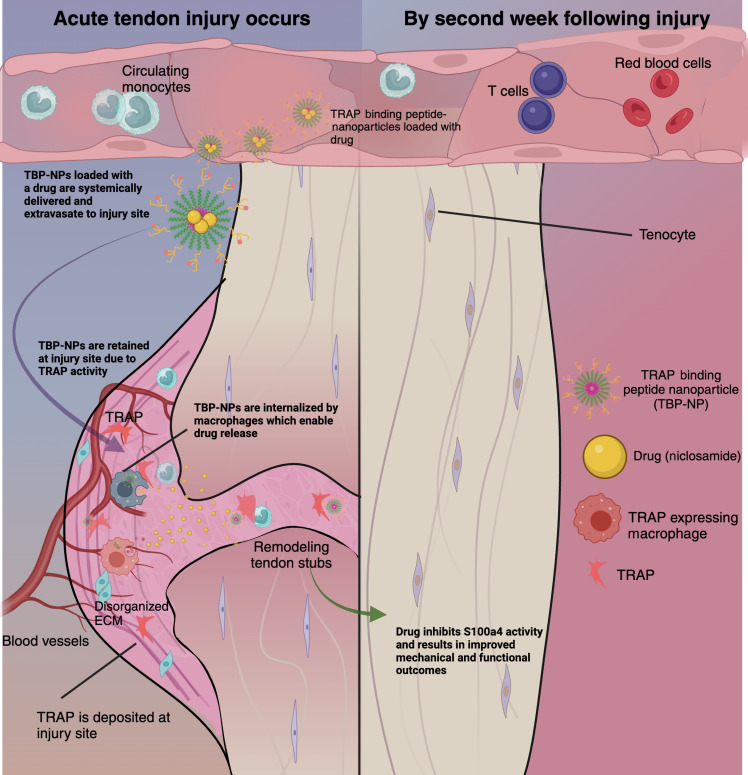
Satisfactory healing following acute tendon injury is marred by fibrosis. Despite the high frequency of tendon injuries and poor outcomes, there are no pharmacological therapies in use to enhance the healing process. Moreover, systemic treatments demonstrate poor tendon homing, limiting the beneficial effects of potential tendon therapeutics. To address this unmet need, we leveraged our existing tendon healing spatial transcriptomics dataset and identified an area enriched for expression of Acp5 (TRAP) and subsequently demonstrated robust TRAP activity in the healing tendon. This unexpected finding allowed us to refine and apply our existing TRAP binding peptide (TBP) functionalized nanoparticle (NP) drug delivery system (DDS) to facilitate improved delivery of systemic treatments to the healing tendon. To demonstrate the translational potential of this DDS, we delivered niclosamide (NEN), an S100a4 inhibitor. While systemic delivery of free NEN did not alter healing, TBP-NPNEN enhanced both functional and mechanical recovery, demonstrating the translational potential of this approach to enhance the tendon healing process.


Figures

Fig. 1.
Fig. 1.. Spatial and single cell transcriptomic analysis of tendon healing identifies an inflammatory/macrophage cluster at the tendon repair site.
(A) Schematic representation of Spatial transcriptomics workflow. (B) Uniform Manifold Approximation and Projection (UMAP) analysis of unsupervised clustering of spatial transcriptomics data (GSE216214) from uninjured tendons and tendons at D14, D21, and 28 days postrepair identifies five distinct molecular clusters (18). (C) Cluster 4, which is defined as an inflammatory cluster, is defined in part by high expression of Acp5. (D) Mapping of Acp5 based on unsupervised clustering of data from D14, D21, and D28 demonstrates high expression and specific localization in the tendon stubs and bridging tissue. (E) Schematic representation of single cell sequencing workflow. (F) UMAP of unsupervised clustering of single cell RNA sequencing data from FDL tendons at days 7, 14, and 28 postinjury. These data were generated as part of a prior study (21). (G and H) Acp5 is expressed in the macrophage cluster throughout healing. (I) High levels of TRAP activity (red) are observed in the healing tendon. Before D7, low levels of TRAP activity are observed; however by D7, a cluster of TRAP+ cells are observed in the bridging tissue, with an additional TRAP+ population in the tendon stubs (outlined in black). By D14, the TRAP+ population has expanded with diffuse localization throughout both the tendon stubs and bridging scar tissue. Scale bars, 200 μm.
Fig. 2.
Fig. 2.. Characterization of the DDS.
(A) PSMA-b-PS polymers are formed from two monomers via RAFT. (B) Synthesized polymers are functionalized with a TBP with an allylic component (C), which is deprotected with tetrakis and phenylsilane. (D) Functionalized polymers are self-assembled into amphiphilic NPs via solvent exchange. (E) SCP-NP and TBP-NPs have desirable physicochemical properties. (F) TBP-NP binding behavior indicates high affinity for TRAP, whereas (G) Untargeted SCP-NPs have no affinity for TRAP.
Fig. 3.
Fig. 3.. Use of a TBP-functionalized NP delivery system to target injured tendon.
(A) Schematic representation of treatment timeline for targeting studies at 3 days postinjury (d.p.i.). (B and C) Representative live-animal imaging and graphs shows biodistribution of NPs after day 3 treatment. (D) Schematic representation of treatment timeline for targeting studies at 7 d.p.i. (E and F) Representative live-animal imaging and graphs shows biodistribution of NPs after day 7 treatment. (G) Schematic representation of treatment timeline for targeting studies at 14 d.p.i. (H and I) Representative live-animal imaging and graphs shows biodistribution of NPs after day 14 treatment. n = 5, mean ± SD. P < 0.05. Two-way ANOVA with Sidak’s multiple comparison test. ****P < 0.0001.
Fig. 4.
Fig. 4.. High homing of TBP-NP to the tendon is dose dependent.
(A) Schematic showing treatment timeline of TBP-NPs delivered at 5 mg/kg and (B) Representative IVIS images showing accumulation and retention of NPs (5 mg/kg). (C) Graph showing minimal tendon targeting of TBP-NPs versus SCP-NPs and saline control after treatment at 5 mg/kg. (D) Schematic showing treatment timeline of TBP-NPs delivered at 25 mg/kg. (E) Representative IVIS images showing accumulation and retention of NPs (25 mg/kg) in the tendon. (F) Graph showing increased tendon targeting of TBP-NPs versus SCP-NPs and saline control after treatment at 25 mg/kg. n = 5, mean ± SD. P < 0.05. Two-way ANOVA with Sidak’s multiple comparison test. **P < 0.0015.
Fig. 5.
Fig. 5.. TBP-NP preferentially targets areas of high TRAP activity.
(A) Schematic representation of experimental timeline. (B) Representative IVIS images of organs 24 hours after treatment with NPs (50 mg/kg) on D7. (C) Quantification of NP biodistribution in respective organs. (D) Quantification of maximum radiant efficiency of NPs in organs after 24 hours of treatment. Data were analyzed with a multiple t test. n = 5, mean ± SD P < 0.05. Normal (E) AST and (F) ALT liver enzyme levels are observed after 24 hours of TBP-NP treatment. Data were analyzed with two-way ANOVA with Tukey’s multiple comparison test. n = 5, mean ± SD, P < 0.05. (G) Representative immunofluorescent images showing spatial distribution of NPs within organs after 24 hours of treatment [blue = 4′,6-diamidino-2-phenylindole (DAPI) and pink = IR780+ NPs]. Scale bars, 200 μm. (H) Quantification of NP area within tissues. Data were analyzed with a multiple t test, n = 5, mean ± SD P < 0.05. (I) Localization of TBP-NPs within bridging tendon tissue. TBP-NPs are present in areas with high TRAP activity within the tendon. Scale bars, 200 μm.
Fig. 6.
Fig. 6.. Macrophages are the predominant cell population that internalize TBP-NPs within the tendon.
(A) Schematic of experimental timeline. (B) Immunofluorescent staining. Scale bars, 200 μm. (C and D) Corresponding quantification shows TBP-NP internalization by macrophages within the tendon. (E) Immunofluorescent staining showing uptake of TBP-NPs by CD206+, IL1ra+, TNFα+, and iNOS+ macrophages. Scale bars, 200 μm. (F) Corresponding quantification of macrophage markers. (G) Quantification showing internalization of TBP-NPs by macrophage subtypes. Quantification in graphs is normalized to total image area. Data were analyzed with two-way ANOVA with Tukey’s multiple comparison test. n = 4, mean ± SD, P < 0.05 (H) Scx-Cre;Rosa-Ai9 F/+ mice are used to label tenocytes to assess TBP-NP uptake by tenocytes. (I) Schematic of experimental timeline. (J) Tenocytes, labeled by Scx-Cre;Rosa-Ai9 F/+ expression show limited TBP-NP internalization. Scale bars, 200 μm. (K) Quantification of NP+ tenocytes within the tendon healing environment. Data was analyzed with two-way ANOVA with Tukey’s multiple comparison test. n = 5, mean ± SD, P < 0.05.
Fig. 7.
Fig. 7.. TBP-NPNEN inhibits S100a4 gene expression.
(A) Schematic showing experimental timeline. (B) TBP-NPNEN inhibits S100a4 gene expression and (C and D) S100a4 protein expression levels in the tendon. Data were analyzed with two-way ANOVA with Tukey’s multiple comparison test. n = 5, mean ± SD, P < 0.05. (E) Immunofluorescent staining showing colocalization of S100a4 and αSMA and colocalization of S100a4 and F4/80. (F) Quantification shows the proportion of cells expressing S100a4 only, αSMA only, or S100a4 and αSMA. (G) Quantification shows the proportion of cells expressing S100a4 only, F4/80 only, or S100a4 and F4/80. Data were normalized by total area of the region of analysis and analyzed with one-way ANOVA with Tukey’s multiple comparison test. n = 5, mean ± SD, P < 0.05.
Fig. 8.
Fig. 8.. S100a4 inhibition promotes regenerative tendon healing.
(A) Schematic of experimental timeline. TBP-NPNEN improves mechanical and functional outcomes at D14 and D28 as determined by (B) MTP flexion angle, (C) gliding resistance, (D) max load at failure, and (E) stiffness. Data were analyzed with two-way ANOVA with Tukey’s multiple comparison test. n = 8 to 10, mean ± SD, P < 0.05. TBP-NPNEN–treated tendons show improved morphology as shown by (F) ABH/OG. White arrows represent remodeling tendon stubs, black arrows represent bridging scar tissue, and red arrows represent native tendon stubs which are not yet undergoing remodeling. (*) indicates suture. Tendons demonstrate similar (G and H) macrophage content and reduced (I and J) myofibroblast content after treatment with TBP-NPNEN. Data were analyzed with two-way ANOVA with Tukey’s multiple comparison test. n = 5, mean ± SD, P < 0.05. Scale bars, 200 μm.
Fig. 9.
Fig. 9.. A tendon-targeting DDS promotes regenerative tendon healing.
TBP-NPs, which demonstrate high affinity for TRAP, are loaded with a drug and systemically delivered. They exhibit attractive physicochemical properties that allow them to circulate longer and be retained for longer periods in the tendon. Upon extravasating through blood vessels and reaching the tendon, they are internalized by macrophages, enabling release of the loaded drug, niclosamide. Targeted delivery of niclosamide inhibits S100a4 and improves regenerative tendon healing.

Update of

Similar articles

Cited by

References

    1. Best K. T., Korcari A., Mora K. E., Nichols A. E. C., Muscat S. N., Knapp E., Buckley M. R., Loiselle A. E., Scleraxis-lineage cell depletion improves tendon healing and disrupts adult tendon homeostasis. eLife 10, e62203 (2021). - PMC - PubMed
    1. Nichols A. E. C., Best K. T., Loiselle A. E., The cellular basis of fibrotic tendon healing: Challenges and opportunities. Transl. Res. 209, 156–168 (2019). - PMC - PubMed
    1. Yang G., Rothrauff B. B., Tuan R. S., Tendon and ligament regeneration and repair: Clinical relevance and developmental paradigm. Birth Defects Res. C Embryo Today 99, 203–222 (2013). - PMC - PubMed
    1. Lim W. L., Liau L. L., Ng M. H., Chowdhury S. R., Law J. X., Current progress in tendon and ligament tissue engineering. Tissue Eng. Regen. Med. 16, 549–571 (2019). - PMC - PubMed
    1. Li Y., Wang J., Song K., Liu S., Zhang H., Wang F., Ni C., Zhai W., Liang J., Qin Z., Zhang J., S100A4 promotes hepatocellular carcinogenesis by intensifying fibrosis-associated cancer cell stemness. Oncoimmunology 9, 1725355 (2020). - PMC - PubMed

Publication types

Substances