. 2024 Jun 21;10(25):eadj0720.
doi: 10.1126/sciadv.adj0720. Epub 2024 Jun 19.

Genetic identification of medullary neurons underlying congenital hypoventilation

Affiliations

Genetic identification of medullary neurons underlying congenital hypoventilation

Ke Cui et al. Sci Adv. .

Abstract

Mutations in the transcription factors encoded by PHOX2B or LBX1 correlate with congenital central hypoventilation disorders. These conditions are typically characterized by pronounced hypoventilation, central apnea, and diminished chemoreflexes, particularly to abnormally high levels of arterial PCO2. The dysfunctional neurons causing these respiratory disorders are largely unknown. Here, we show that distinct, and previously undescribed, sets of medullary neurons coexpressing both transcription factors (dB2 neurons) account for specific respiratory functions and phenotypes seen in congenital hypoventilation. By combining intersectional chemogenetics, intersectional labeling, lineage tracing, and conditional mutagenesis, we uncovered subgroups of dB2 neurons with key functions in (i) respiratory tidal volumes, (ii) the hypercarbic reflex, (iii) neonatal respiratory stability, and (iv) neonatal survival. These data provide functional evidence for the critical role of distinct medullary dB2 neurons in neonatal respiratory physiology. In summary, our work identifies distinct subgroups of dB2 neurons regulating breathing homeostasis, dysfunction of which causes respiratory phenotypes associated with congenital hypoventilation.


Figures

Fig. 1.
Fig. 1.. Identification of Lbx1+/Phox2b+brainstem neurons.
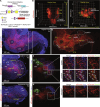
(A) Schematic view of a mouse brainstem at birth. Blue lines denote the sagittal planes illustrated in (B) and (C). The spinal cord (sc) and cerebellum (cb) are labeled. (B and C) Sections taken from Lbx1Cre/+;RosaLSL-nGFP/+ mice at birth (P0). Top displays GFP (green) and 4′,6-diamidino-2-phenylindole (DAPI) (blue) signals. Boxed areas, magnified at the bottom, show Lbx1 (red, false color), GFP and Phox2b (blue, false color) merged signals (left), or Lbx1 and Phox2b signals (right) for better visualization of Lbx1+/Phox2b+ (magenta) neurons. (D) Schematic view of a P0 mouse brainstem illustrating the location of Lbx1+/Phox2b+ neuron subgroups (magenta) identified here: (i) intertrigeminal (ITR), vestibular (Ves), epifacial (epiVII), retrotrapezoid nucleus (RTN), and peri nucleus ambiguus (periNA) neurons. The trigeminal (nV), facial (nVII), and ambiguus (NA) motor nuclei are labeled for orientation. The blue line denotes the transverse plane illustrated in (E). For analysis of ITR and periNA cells, see fig. S2. (E) Left: A brainstem section stained with GFP (green) and DAPI (blue) at birth. Here, six subgroups of Lbx1+/Phox2b+ neurons can be identified: retrotrapezoid nucleus, epiVII, and vestibular neurons. Boxed areas, magnified on the right, show Lbx1 (red, false color), GFP and Phox2b (blue, false color) merged signals (middle), or Lbx1 and Phox2b signals (right) for a better visualization of Lbx1+/Phox2b+ (magenta) cells. The small boxed areas are magnified at the bottom of the main photographs. Note that four vestibular Lbx1+/Phox2b+ neuron subgroups can be distinguished (v1 to v4), see also figs. S2E and S3C. (F) Pie charts illustrating the proportion of neurons with a history of Lbx1 expression (GFP+) and active expression of Lbx1 and Phox2b. The actual quantification of these cells (n = 4 mice) can be found in fig. S2D. Tabulated data can be found in data S1.
Fig. 2.
Fig. 2.. Intersectional labeling of dB2 neurons.
(A) Strategy to mark neurons with a history of Lbx1 and Phox2b expression using tdTomato fluorescence. The resulting dB2-Tomato genotype is indicated. (B) Ventral and sagittal 3D reconstructions of a dB2-Tomato brainstem at birth (P0). tdTomato+ cells were densely packed in the intertrigeminal (ITR), vestibular (Ves), retrotrapezoid (RTN), and epifacial (epiVII) subgroups (yellow dashed lines). See also movie S1. In addition, four subgroups of tdTomato+ cells were seen in the caudal medulla (white dashed lines, see below) and scattered cells (labeled as somaV) in the somatosensory trigeminal nuclei. Because of space limitations, some tdTomato+ cells might not be included within the dashed lines. (C and D) A sagittal dB2-Tomato brainstem section stained against the red fluorescent protein (RFP; to detect tdTomato, red) and DAPI (blue) at P0 [in (C)]. The cerebellum (cb), spinal cord (sc), trigeminal (nV), facial (nVII), and ambiguus (NA) motor nuclei are indicated. DAPI signals are removed in (D) for a better visualization of dB2 neuron subgroups. Yellow dashed lines indicate dB2 neuron subgroups that actively coexpress Lbx1 and Phox2b (see text and fig. S3). (E to H) Transverse dB2-Tomato brainstem sections stained against RFP (to detect tdTomato, red)], Lbx1 [blue, false color, (F) and (H)], and Phox2b [green, (F) and (H)] at P0, as indicated in (C). DAPI (blue) and tdTomato only signals are displayed in (E) and (G). The caudal epiNTS, periNA, epiNA, and infraSpV dB2 neuron subgroups are marked in (E) and (G) (see also fig. S4). Arrowheads in (F) (insets) indicate triple-positive (Lbx1+/Phox2b+/tdTomato+) cells. Arrows in (E) and (G) denote scattered somaV cells in the spinal somatosensory trigeminal nucleus (SpV). The area postrema (AP) and nucleus tractus solitarius (nTS), as well as the vagal (nX), hypoglossal (nXII), and ambiguus (NA) motor nuclei are indicated.
Fig. 3.
Fig. 3.. dB2 neurons from rhombomeres 5 and 6 are essential for ventilatory control and the hypercarbic reflex at birth.
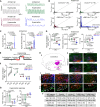
Plethysmography and anatomical analyses of Control, (Tg)Hoxb1Cre/+;Lbx1FS/lox (r4-Lbx1FS), Egr2Cre/+;Lbx1FS/lox (r3&5-Lbx1FS), and (Tg)Hoxa3Cre/+;Lbx1FS/lox (r5&6-Lbx1FS) newborn (P0) mice. (A) Plethysmography traces for the indicated genotypes and conditions. (B) Poincaré plots of breathing instability for the indicated genotypes in ambient air. For SDs 1 and 2, see fig. S7. Every dot represents individual breaths. Number of breaths and mice (n) analyzed are indicated in parentheses. (C) Quantification of apnea lengths (left) and the fraction of time in apnea (right) for the indicated genotypes while breathing ambient air. Each circle represents individual apneas (left), while each dot the mean of individual mice (right). (D) Quantification of minute ventilation, tidal volumes, and respiratory cycle lengths (TTOT) for the indicated genotypes while breathing ambient air. (E) Diagram illustrating the protocol used to induce a hypercarbic response in newborns. Newborns were analyzed in ambient air and in hypercarbia as indicated (in red). (F) Quantification of minute ventilation for the indicated genotypes while breathing ambient air or hypercarbic air. (G) Respiratory responses to hypercarbia expressed as percentage of change relative to the baseline (ambient air) for the indicated genotypes. (H) Histological characterization of Control, r4-Lbx1FS, r3&5-Lbx1FS, and r5&6-Lbx1FS newborns. (a) Schema illustrating the location of vestibular (v1 to v4 subgroups), epifacial (epiVII), and retrotrapezoid (RTN) dB2 neurons. (b and c) Immunofluorescence using antibodies against Lbx1 (blue) and Phox2b (red). DAPI (green, false color) was used to counterstain. (d) Quantification summary of the indicated dB2 neuron subgroups and genotypes, see also fig. S8 [(A) to (D)]. Each dot represents the mean of individual mice in (D), (F), and (G). Significance was determined using one-way analysis of variance (ANOVA) followed by post hoc Tukey’s analysis. Tabulated data can be found in data S2.
Fig. 4.
Fig. 4.. Partial recovery of the hypercarbic reflex in mature r3&5-Lbx1FS and r5&6-Lbx1FS mice.
(A) Quantification of minute ventilation displayed by Control, r4-Lbx1FS, r3&5-Lbx1FS, and r5&6-Lbx1FS mice at the indicated stages, in ambient air (left) or high levels of CO2 (hypercarbia) (right), see also fig. S11. The number of mice (n) analyzed is in parentheses. (B) Respiratory response to hypercarbia expressed as percentage of change relative to the baseline (ambient air). Change of minute ventilation displayed by the indicated genotypes at different postnatal ages: P0, P7, P21, and P56. See also fig. S11B. (C) Schematic view of a mouse brainstem displaying the location of the transverse planes shown in (D) to (G). (D to G) Histological detection of c-Fos+ cells after hypercarbia exposure in Control and r3&5-Lbx1FS mice at P0. DAPI (blue) was used to counterstain (main). Retrotrapezoid nucleus neurons were detected with Lbx1 (green) and Phox2b (red) antibodies [in (D)]. Raphe [in (E)], nucleus tractus solitarius [in (F)], and parabrachial complex [in (G)] neurons were detected with Lmx1b (red) antibodies. Boxed areas in the main photographs are magnified at the bottom with merged or c-Fos only signals. White and yellow arrowheads in (E) denote neurons with strong and weak c-Fos immunoreactivity, respectively. See fig. S11C for the histological analysis of r3&5-Lbx1FS mice at P56. The nucleus tractus solitarius (nTS) and area postrema (AP), as well as the facial (nVII), vagal (nX), and hypoglossal (nXII) motor nuclei are indicated for orientation. Right: Quantification of the proportion of retrotrapezoid nucleus, nucleus tractus solitarius, middle raphe, and parabrachial complex neurons coexpressing c-Fos at the indicated stages. Each dot represents the mean of individual mice. Significance was determined using one-way ANOVA followed by post hoc Tukey’s analysis. Tabulated data can be found in data S3.
Fig. 5.
Fig. 5.. Agenesis of caudal dB2 neurons causes respiratory arrest at birth.
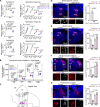
(A) Plethysmography traces of three individual Control and three MafBCre/+;Lbx1FS/lox (MafB-Lbx1FS) newborn (P0) mice while breathing ambient air. (B) Quantification of minute ventilation, tidal volume, and respiratory cycle lengths (TTOT) in Control and MafB-Lbx1FS newborns in ambient air. Each dot represents the mean of individual mice. (C) Quantification of apnea lengths (left) and the fraction of time in apnea (right) of Control and MafB-Lbx1FS newborn mice while breathing ambient air. Each circle represents individual apneas (left), while each dot the mean of individual mice (right). (D) Histological analysis and quantification of peri nucleus ambiguus (periNA) neurons in Control and MafB-Lbx1FS newborns at birth (P0). The transverse brainstem sections were stained with Lbx1 (blue) and Phox2b (red) antibodies. DAPI (green, false color) was used to counterstain. The number (n) of mice analyzed is indicated in parentheses. See fig. S16 for the analysis of other caudal dB2 neuron subgroups in MafB-Lbx1FS mutants. (E) Schema displaying the rhombomeric (r) segmentation of the developing brainstem, the origin of dB2 neurons (magenta), and the expression patterns of the genes analyzed in this study. The forebrain (fb), midbrain (mb), and spinal cord (sc) are indicated for anatomical orientation. (F) Schema summarizing the rhombomeric origin of the identified dB2 neuron subgroups in this study. Note that somaV neurons, which are generated from each rhombomere 2 to 6 are not marked (see Discussion). (G) Summary of the main findings of this study. The phenotypes of the previously reported homozygous Lbx1FS (28), conditional Phox2bCre/+;Lbx1FS/lox (28) are also displayed for comparison. Two-tailed t tests were performed to determine statistical significance in (B) to (D). Tabulated data can be found in data S4.
Fig. 6.
Fig. 6.. Ventilatory changes caused by the activation or inhibition of dB2 neurons in neonatal mice.
(A) Left: A transverse brainstem section stained with Phox2b (red) and Lbx1 (blue) antibodies at E11.5. Right: Gene expression in brainstem neurons at E11.5. (B) Strategies to express hM3Dq-mCherry and hM4Di-HA DREADD receptors in dB2 neurons. Analyzed genotypes are indicated. See also fig. S17. (C to H) Analysis of Control, dB2-Activity, and dB2-Silence neonates before (pre; gray) and after CNO treatment (10 mg/kg; blue). Respiratory recordings were taken in ambient air. The number (n) of mice analyzed is displayed in parentheses underneath the studied genotypes. (C) Plethysmography traces of Control, dB2-Activity, and dB2-Silence neonates. (D) Left in (a) and (b): Quantification of minute ventilation. Right in (a) and (b): Change of minute ventilation expressed as percentage relative to the baseline (before CNO). [(E) and (G)] Left: Frequency distribution plots of tidal volumes. Total number of analyzed breaths is indicated in parentheses. Note that a displacement to the left or right indicates a decrease or increase, respectively. Middle: Quantification of tidal volumes. Right: Change of tidal volumes expressed as percentage relative to the baseline (before CNO). [(F) and (H)] Left: Poincaré plots illustrating breathing instability. Every dot represents individual breaths, and the total number of analyzed breaths is indicated in parentheses. SDs 1 and 2 are displayed in fig. S22. Middle: Quantification of respiratory cycle lengths (TTOT). Right: Change of TTOT expressed as percentage relative to the baseline (before CNO). Except for the Poincaré plots, every dot in graphs (D) to (H) represents the mean of individual mice. Significance was determined using one-way ANOVA followed by post hoc Tukey’s analysis for group comparison or two tailed t test for pair comparison. Tabulated data can be found in data S5.
Fig. 7.
Fig. 7.. Ventilatory changes caused by the activation or inhibition of dB2 neurons in adult mice.
Analysis of Control, dB2-Activity, and dB2-Silence adult mice before (pre; gray) and after CNO treatment (10 mg/kg; blue). Respiratory recordings were taken in ambient air. The number (n) of mice analyzed is displayed in parentheses underneath the studied genotypes. (A) Plethysmography traces of Control, dB2-Activity, and dB2-Silence mice. (B) Left in (a) and (b): Quantification of minute ventilation. Right in (a) and (b): Change of minute ventilation expressed as percentage relative to the baseline (before CNO). (C and E) Left: Frequency distribution plots of tidal volumes. Total number of analyzed breaths is indicated in parentheses. Note that a displacement to the left or right indicates a decrease or increase, respectively. Middle: Quantification of tidal volumes. Right: Change of tidal volumes expressed as percentage relative to the baseline (before CNO). (D and F) Left: Poincaré plots illustrating breathing instability. Every dot represents individual breaths, and the total number of analyzed breaths is indicated in parentheses. SDs 1 and 2 are displayed in fig. S24. Middle: Quantification of respiratory cycle lengths (TTOT). Right: Change of TTOT expressed as percentage relative to the baseline (ambient air before CNO). Except for the Poincaré plots, every dot in graphs (B) to (F) represents the mean of individual mice. Significance was determined using one-way ANOVA followed by post hoc Tukey’s analysis for group comparison or two tailed t test for pair comparison. Tabulated data can be found in data S6.
Fig. 8.
Fig. 8.. dB2 neurons are essential for the neonatal hypercarbic reflex.
(A) Diagram illustrating the protocol used to induce a hypercarbic response in mice. Respiration was analyzed in ambient air and in hypercarbia for 5 min (indicated in red). The analysis displayed in Figs. 6 and 7 was obtained from the five minutes denoted in cyan. (B to D) Analysis of Control, dB2-Activity, and dB2-Silence mice before (pre; gray) and after CNO treatment (10 mg/kg; blue). The number (n) of mice analyzed is displayed underneath the studied genotypes. (B) Plethysmography traces of Control, dB2-Activity, and dB2-Silence mice at the indicated stages and conditions. [(C) and (D)] Analysis of Control, dB2-Activity, and dB2-Silence mice in ambient air (air) and in hypercarbia (8% CO2 in air, abbreviated as CO2). (a) Quantification of minute ventilation in ambient air and hypercarbia for the indicated genotypes, stages, and conditions. (b) Effects of dB2 neuron activation or inhibition on minute ventilation, tidal volumes, and respiratory cycle lengths (TTOT) displayed by dB2-Activity or dB2-Silence mice, respectively, while in hypercarbia (before and after CNO treatment). For quantification of tidal volumes and respiratory cycle lengths, see fig. S25. Every dot represents the mean of individual mice. Significance was determined using one-way ANOVA followed by post hoc Tukey’s analysis for group comparison or two tailed t test for pair comparison. Tabulated data can be found in data S7.

References

    1. Ceccherini I., Kurek K. C., Weese-Mayer D. E., Developmental disorders affecting the respiratory system: CCHS and ROHHAD. Handb. Clin. Neurol. 189, 53–91 (2022). - PubMed
    1. Moreira T. S., Takakura A. C., Czeisler C., Otero J. J., Respiratory and autonomic dysfunction in congenital central hypoventilation syndrome. J. Neurophysiol. 116, 742–752 (2016). - PMC - PubMed
    1. Weese-Mayer D. E., Berry-Kravis E. M., Ceccherini I., Keens T. G., Loghmanee D. A., Trang H.; ATS Congenital Central Hyproventilation Syndrome Subcommittee , An official ATS clinical policy statement: Congenital central hypoventilation syndrome: Genetic basis, diagnosis, and management. Am. J. Respir. Crit. Care Med. 181, 626–644 (2010). - PubMed
    1. Weese-Mayer D. E., Berry-Kravis E. M., Ceccherini I., Rand C. M., Congenital central hypoventilation syndrome (CCHS) and sudden infant death syndrome (SIDS): Kindred disorders of autonomic regulation. Respir. Physiol. Neurobiol. 164, 38–48 (2008). - PubMed
    1. Rand C. M., Carroll M. S., Weese-Mayer D. E., Congenital central hypoventilation syndrome. Clin. Chest Med. 35, 535–545 (2014). - PubMed

Publication types

Supplementary concepts