. 2024 Jun;132(6):67009.
doi: 10.1289/EHP13849. Epub 2024 Jun 19.

Prolonged Cadmium Exposure and Osteoclastogenesis: A Mechanistic Mouse and in Vitro Study

Affiliations

Prolonged Cadmium Exposure and Osteoclastogenesis: A Mechanistic Mouse and in Vitro Study

Zhiyuan Liu et al. Environ Health Perspect. 2024 Jun.

Abstract

Background: Cadmium (Cd) is a highly toxic and widespread environmental oxidative stressor that causes a myriad of health problems, including osteoporosis and bone damage. Although nuclear factor erythroid 2-related factor 2 (NRF2) and its Cap 'n' Collar and basic region Leucine Zipper (CNC-bZIP) family member nuclear factor erythroid 2-related factor 1 (NRF1) coordinate various stress responses by regulating the transcription of a variety of antioxidant and cytoprotective genes, they play distinct roles in bone metabolism and remodeling. However, the precise roles of both transcription factors in bone loss induced by prolonged Cd exposure remain unclear.

Objectives: We aimed to understand the molecular mechanisms underlying Cd-induced bone loss, focusing mainly on the roles of NRF2 and NRF1 in osteoclastogenesis provoked by Cd.

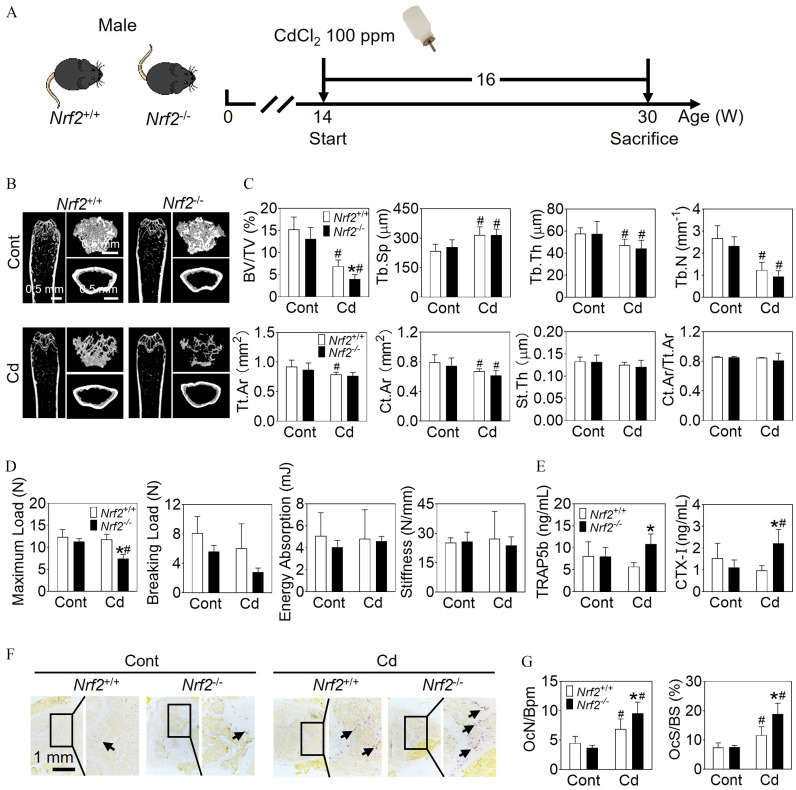
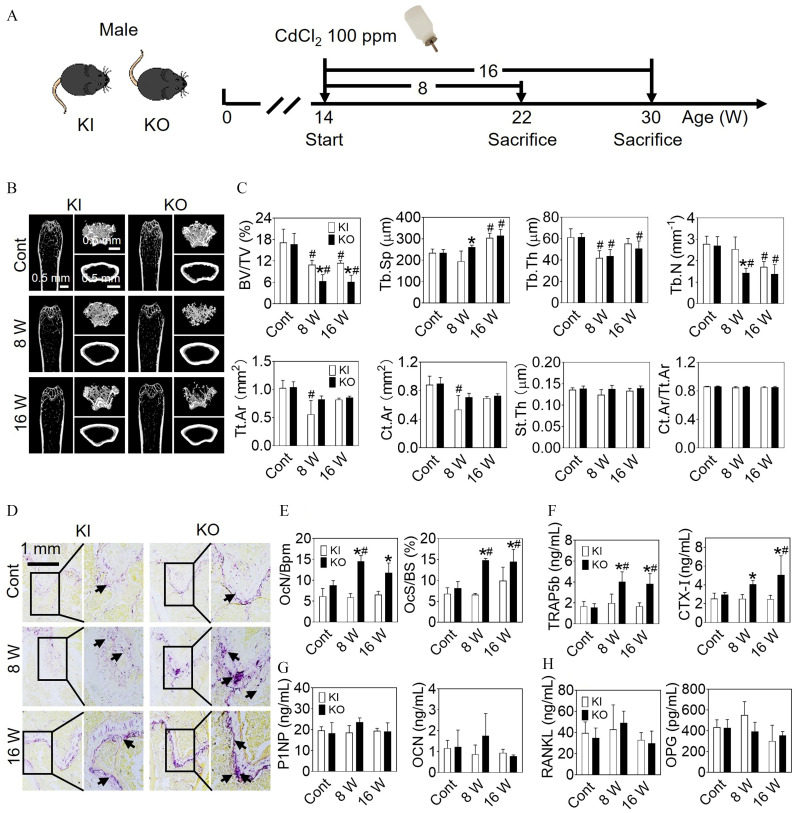
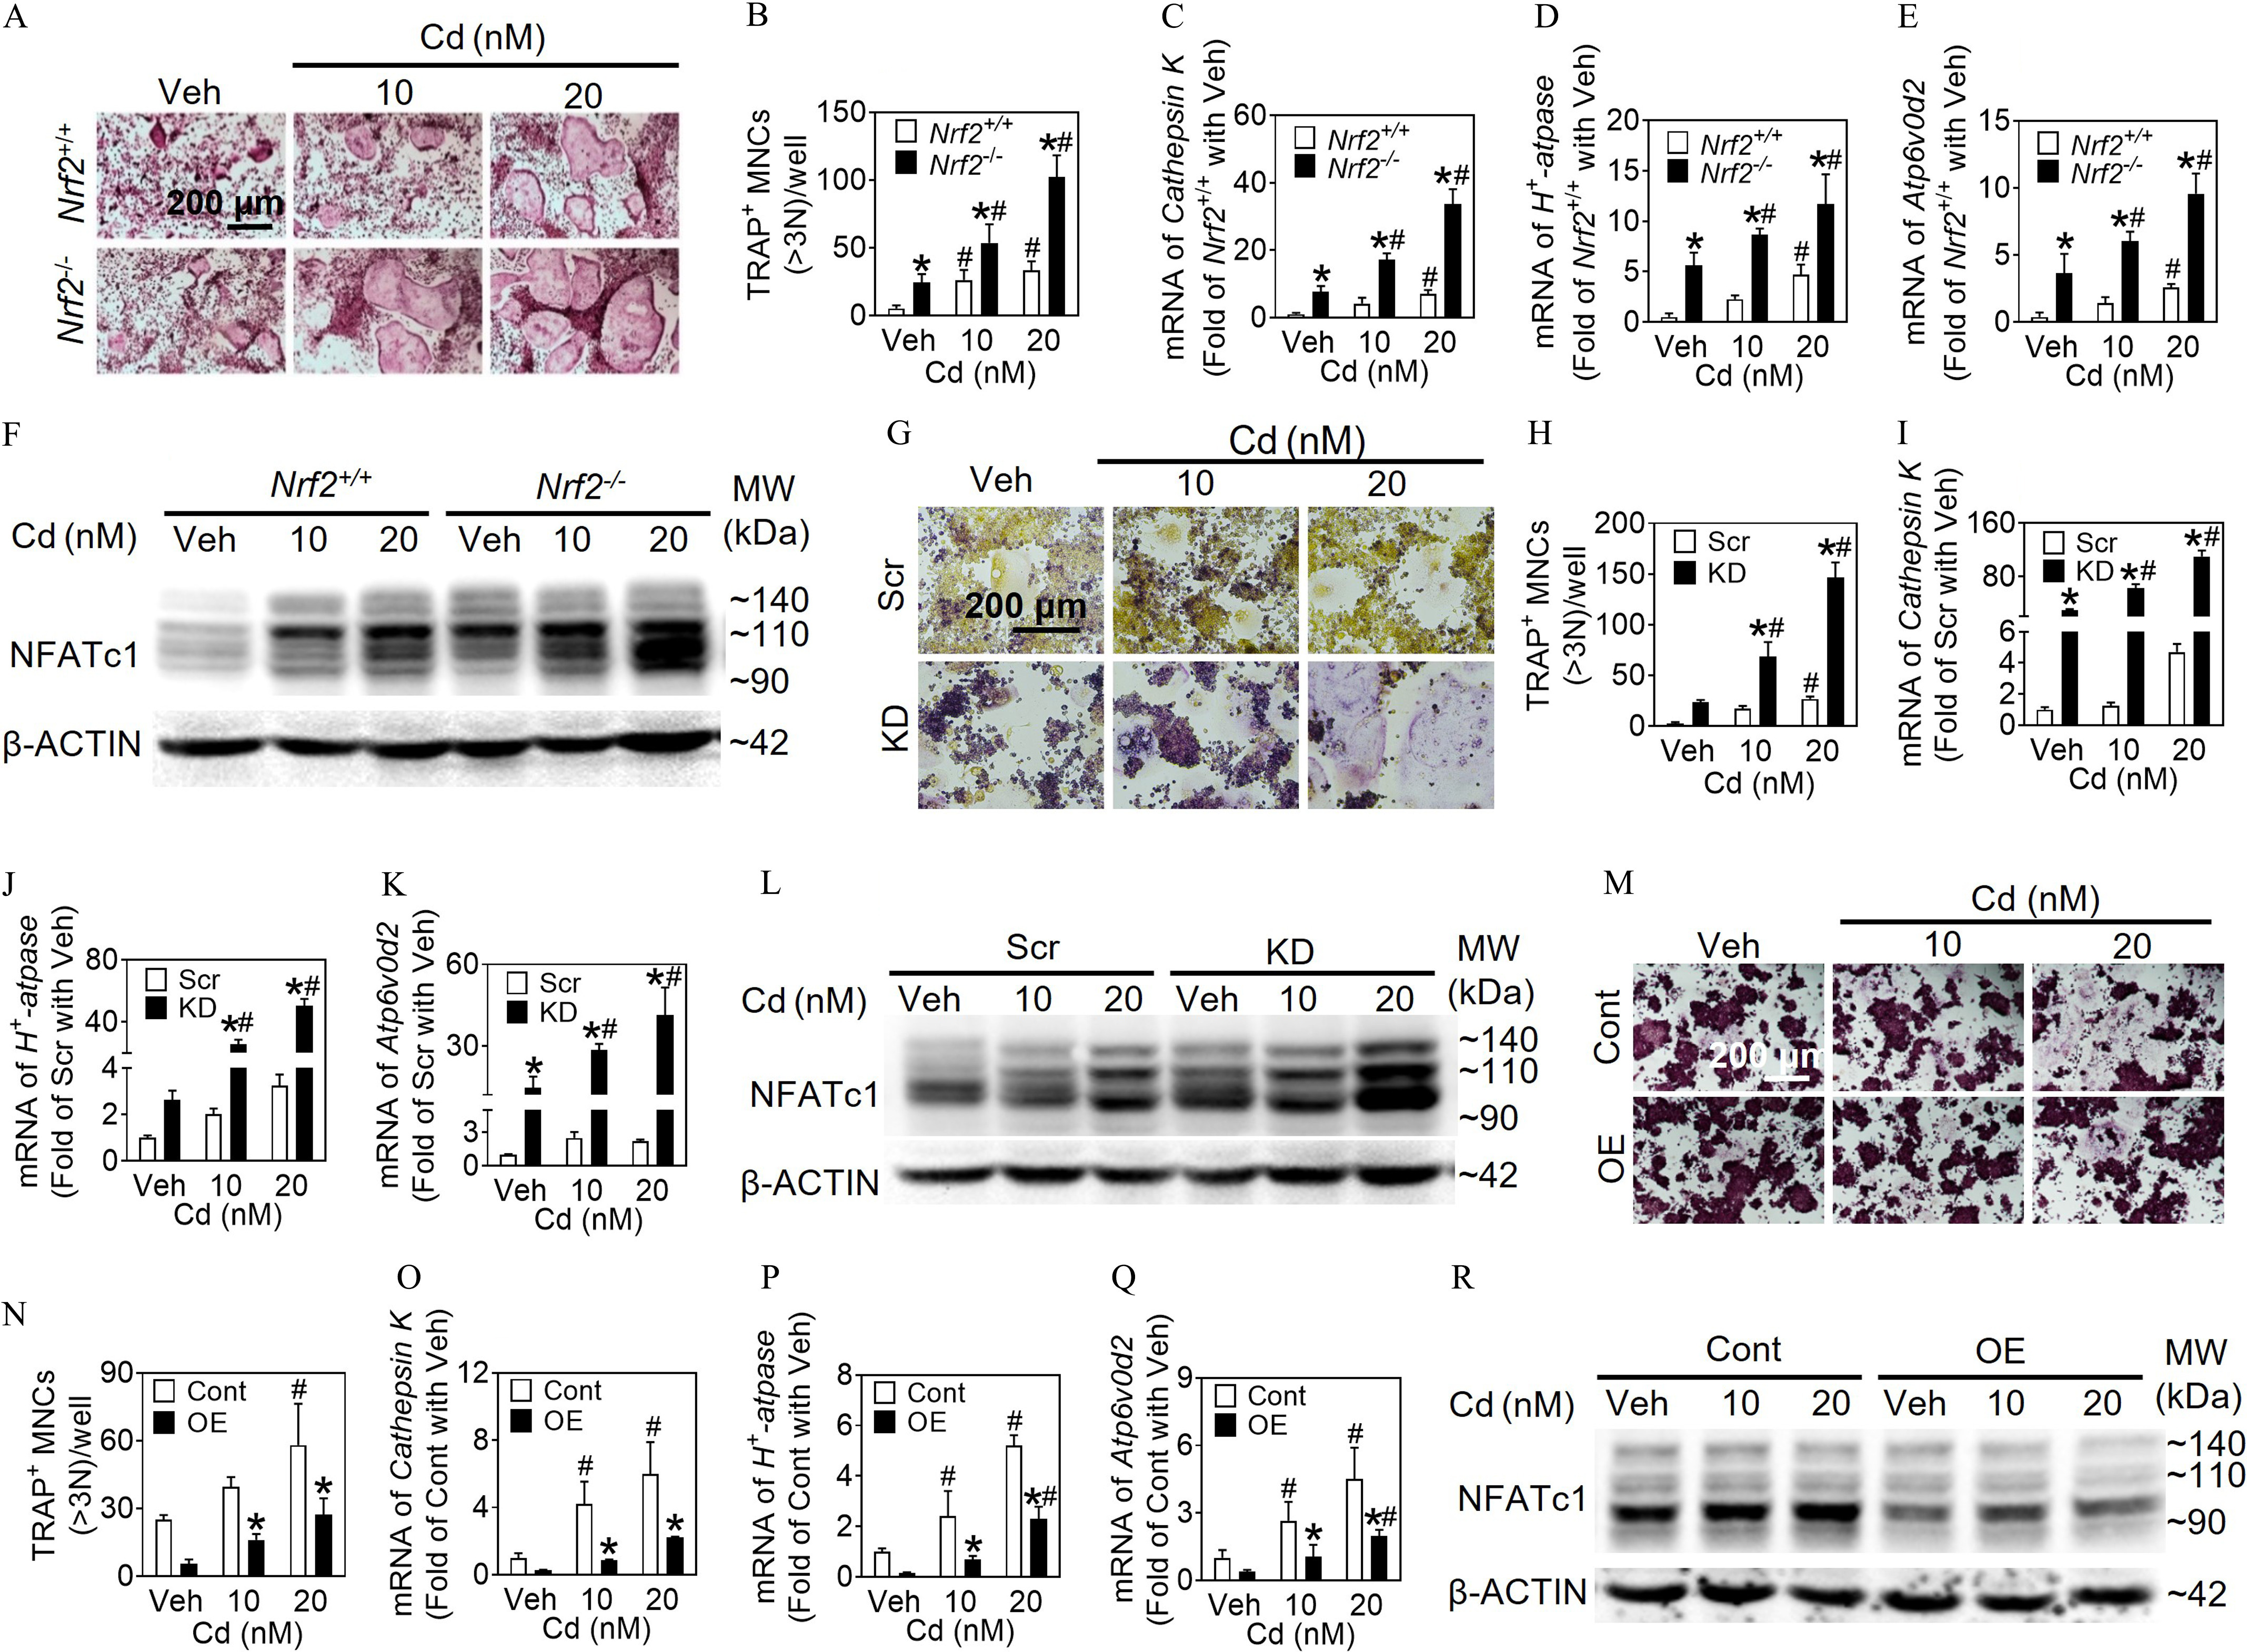
Methods: Male wild-type (WT), global Nrf2-knockout (Nrf2-/-) and myeloid-specific Nrf2 knockout [Nrf2(M)-KO] mice were administered Cd (50 or 100 ppm) via drinking water for 8 or 16 wk, followed by micro-computed tomography, histological analyses, and plasma biochemical testing. Osteoclastogenesis was evaluated using bone marrow-derived osteoclast progenitor cells (BM-OPCs) and RAW 264.7 cells in the presence of Cd (10 or 20 nM) with a combination of genetic and chemical modulations targeting NRF2 and NRF1.

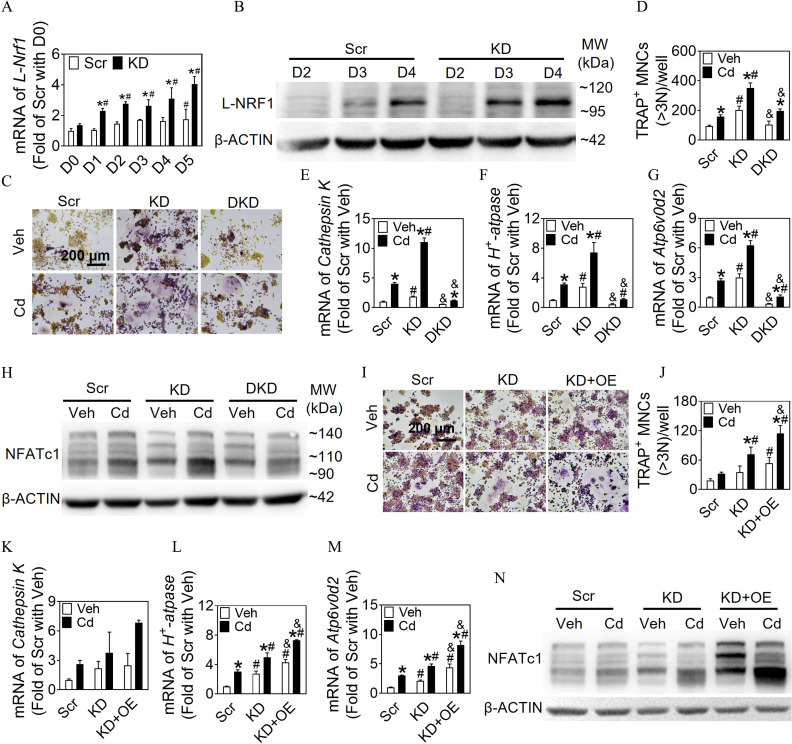
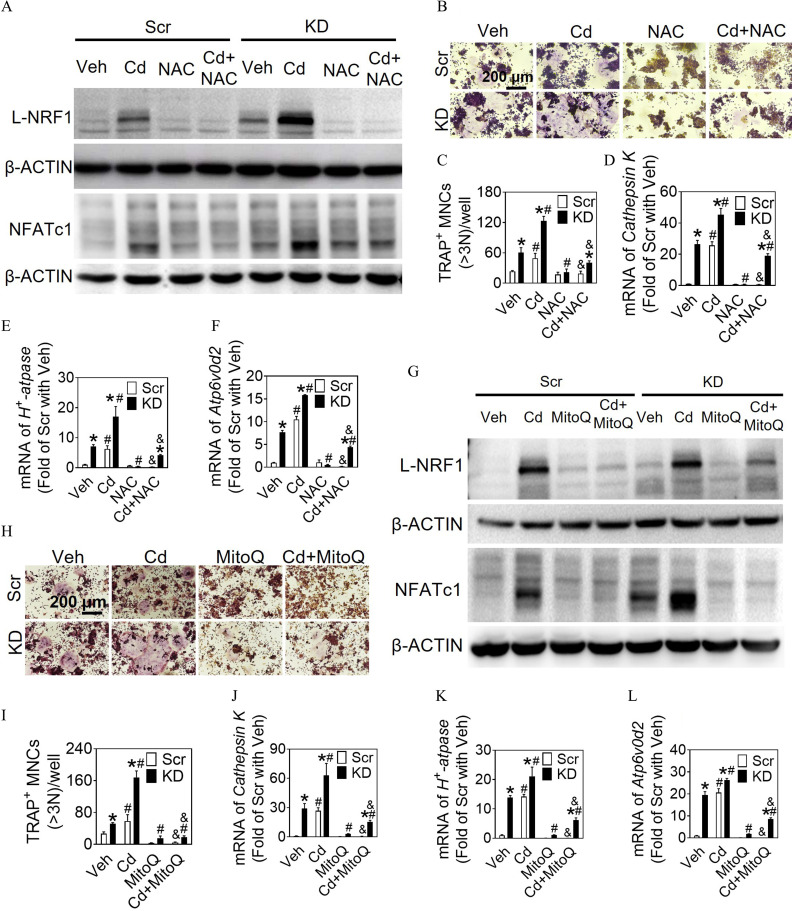
Results: Compared with relevant control mice, global Nrf2-/- or Nrf2(M)-KO mice showed exacerbated bone loss and augmented osteoclast activity following exposure to 100 ppm Cd in drinking water for up to 16 wk. In vitro osteoclastogenic analyses suggested that Nrf2-deficient BM-OPCs and RAW 264.7 cells responded more robustly to low levels of Cd (up to 20 nM) with regard to osteoclast differentiation compared with WT cells. Further mechanistic studies supported a compensatory up-regulation of long isoform of NRF1 (L-NRF1) and subsequent induction of nuclear factor of activated T cells, cytoplasmic, calcineurin dependent 1 (NFATc1) as the key molecular events in the Nrf2 deficiency-worsened and Cd-provoked osteoclastogenesis. L-Nrf1 silenced (via lentiviral means) Nrf2-knockdown (KD) RAW cells exposed to Cd showed dramatically different NFATc1 and subsequent osteoclastogenesis outcomes compared with the cells of Nrf2-KD alone exposed to Cd, suggesting a mitigating effect of the Nrf1 silencing. In addition, suppression of reactive oxygen species by exogenous antioxidants N-acetyl-l-cysteine (2 mM) and mitoquinone mesylate (MitoQ; 0.2μM) mitigated the L-NRF1-associated effects on NFATc1-driven osteoclastogenesis outcomes in Cd-exposed Nrf2-KD cells.

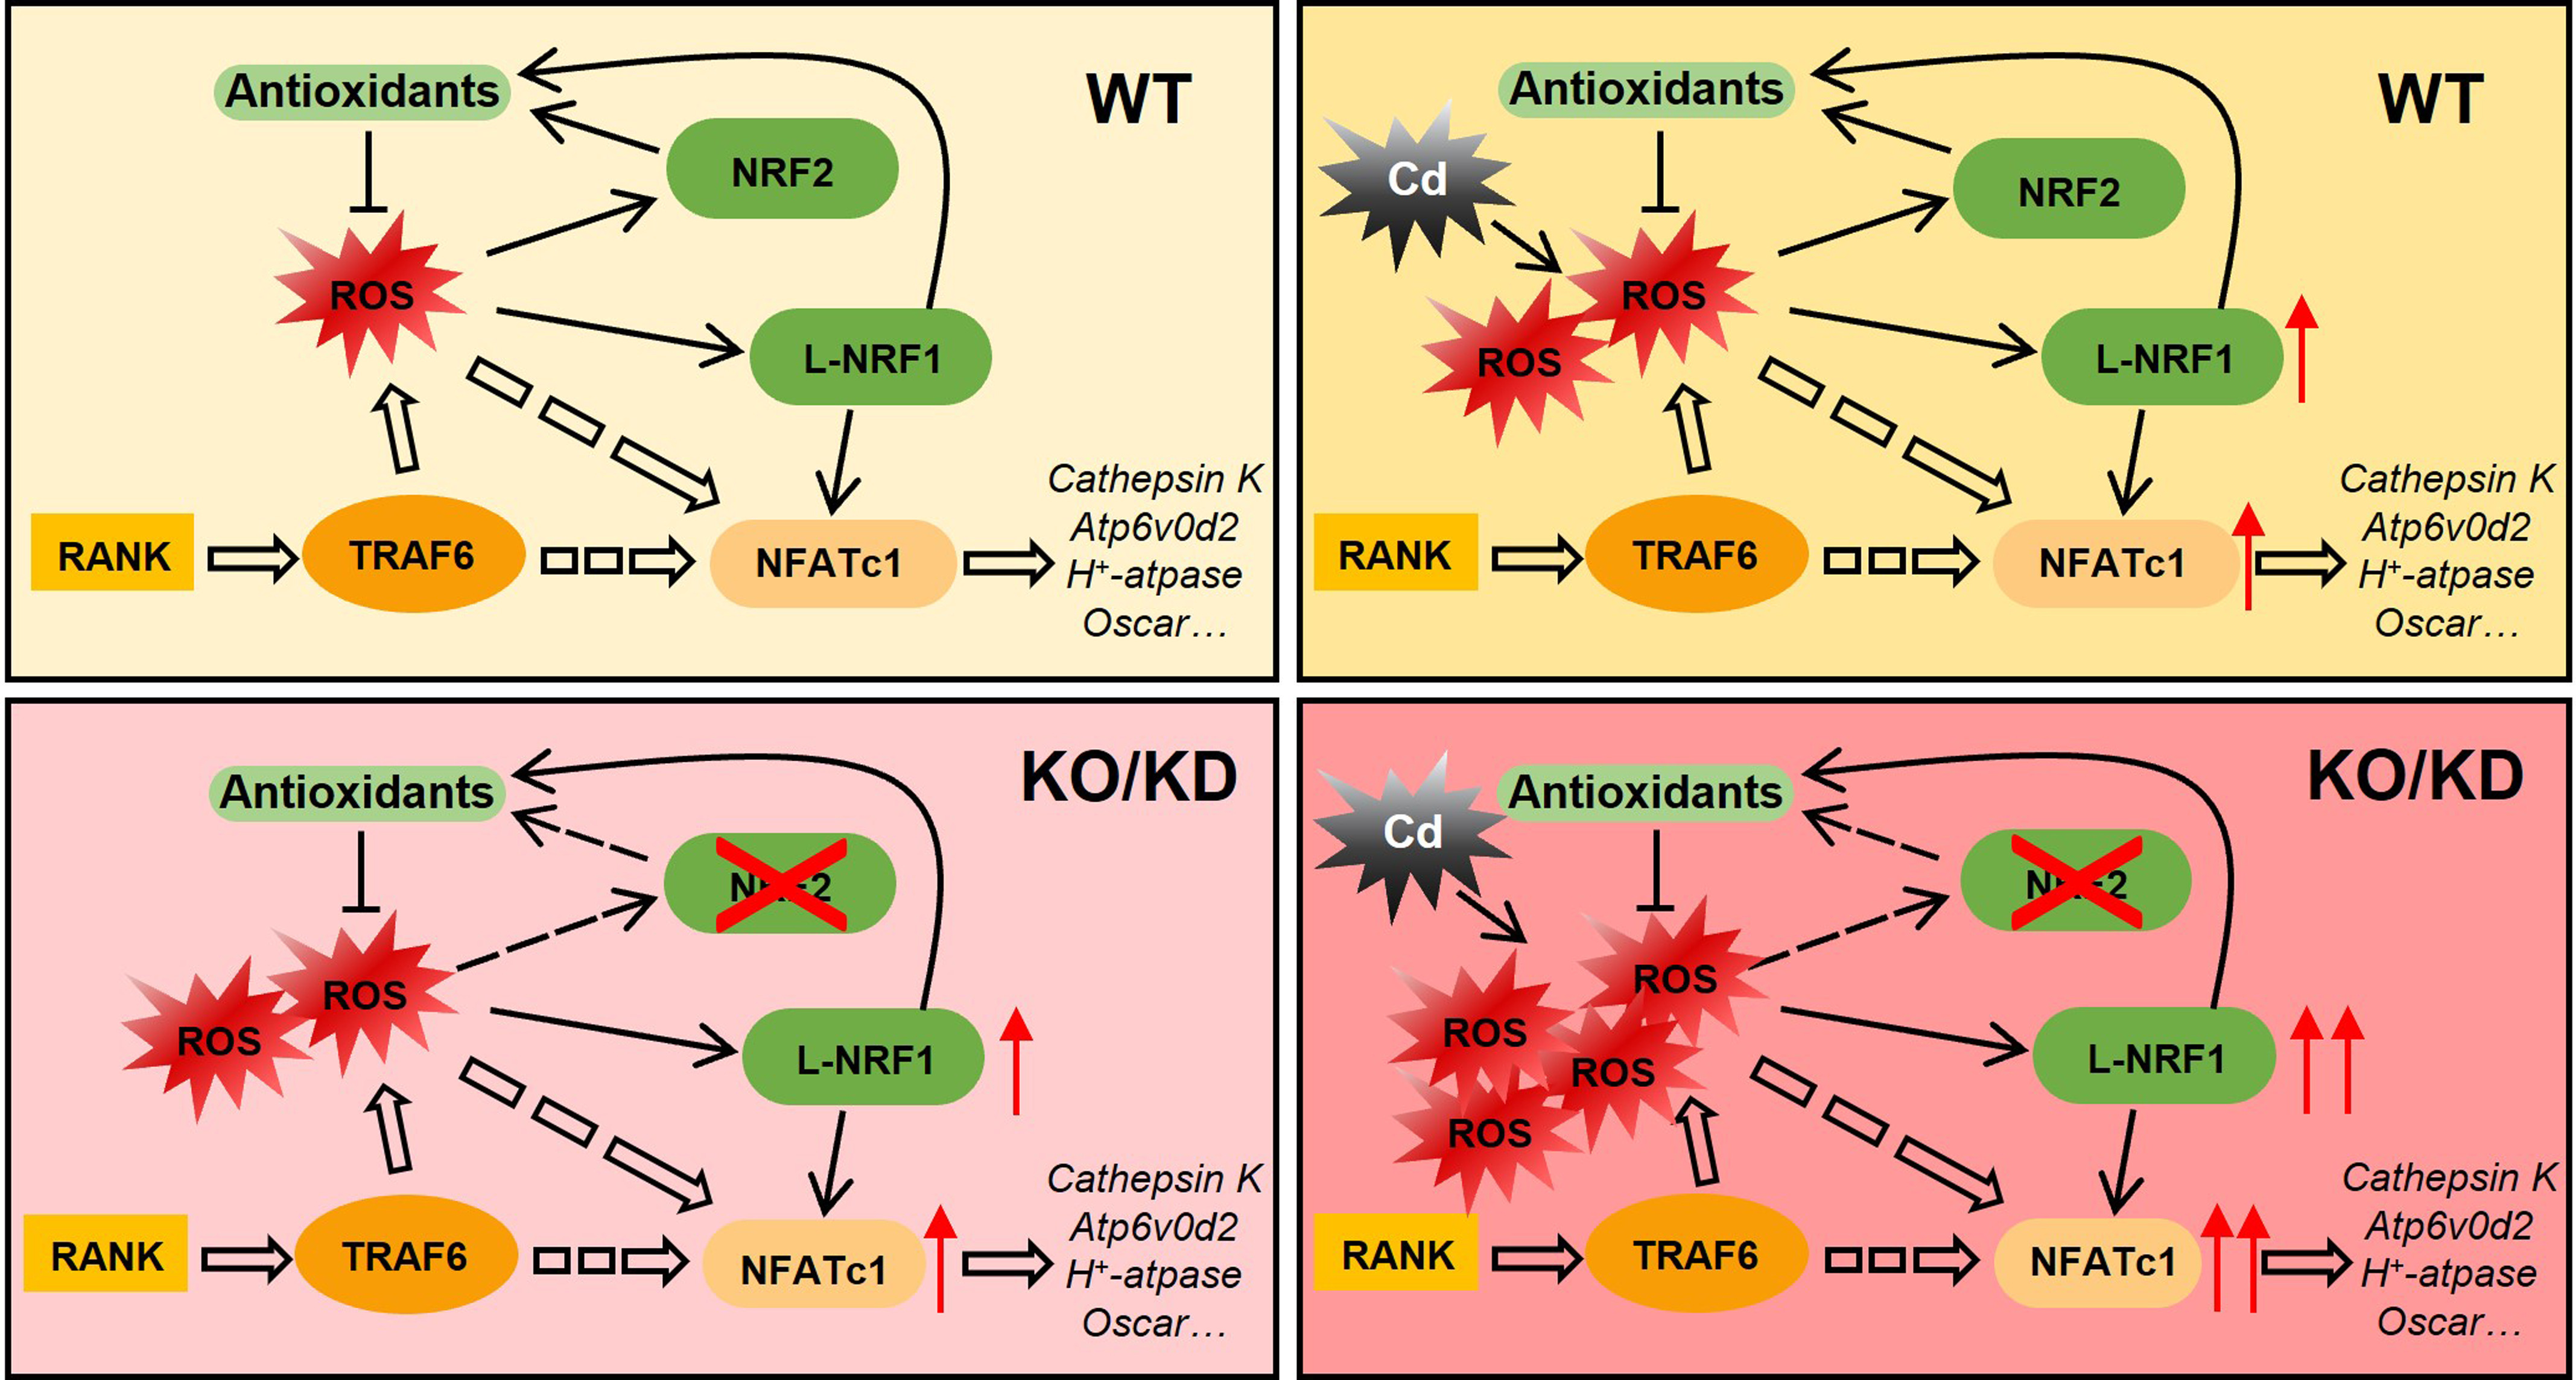
Conclusions: This in vivo and in vitro study supported the authors' hypothesis that Cd exposure caused bone loss, in which NRF2 and L-NRF1 responded to Cd and osteoclastogenic stimuli in a cooperative, but contradictive, manner to coordinate Nfatc1 expression, osteoclastogenesis and thus bone homeostasis. Our study suggests a novel strategy targeting NRF2 and L-NRF1 to prevent and treat the bone toxicity of Cd. https://doi.org/10.1289/EHP13849.


Figures

Figure 1A is a schematic illustration depicting the experiment on male mice, which examined the effects of cadmium exposure on bone metabolic homeostasis in global nuclear factor erythroid 2-related factor 2 knockout and wild-type littermate control. A timeline with a scale from 0 to 30 weeks is displayed. The experiment began at 14 weeks, when the two groups of mice were given 100 parts per million of cadmium chloride in their drinking water for 16 weeks. The mice were sacrificed at week thirty. Figure 1B is a stained tissue displaying two columns, namely, nuclear factor erythroid 2-related factor 2 begin superscript positive per positive end superscript and nuclear factor erythroid 2-related factor 2 begin superscript negative per negative end superscript, and two rows, namely, Control and Cadmium with a 0.5 millimeter scale bar. Figure 1C is a set of eight bar graphs, plotting Bone volume per tissue volume (percentage), ranging from 0 to 20 in increments of 5; Trabecular separation (micrometers), ranging from 0 to 450 in increments of 150; Trabecular thickness (micrometers), ranging from 0 to 80 in increments of 20; Trabecular number (millimeter begin superscript negative 1 end superscript), ranging from 0 to 4 in unit increments; Total area (millimeters begin superscript 2 end superscript), ranging from 0.0 to 1.5 in increments of 0.5; Cortical area (millimeters begin superscript 2 end superscript), ranging from 0.0 to 1.2 in increments of 0.4; Structure thickness (micrometer), ranging from 0.00 to 0.20 in increments of 0.05; and Cortical area per total area, ranging from 0.0 to 1.2 in increments of 0.4 (y-axis) across control and cadmium (x-axis) for nuclear factor erythroid 2-related factor 2 begin superscript positive per positive end superscript and nuclear factor erythroid 2-related factor 2 begin superscript negative per negative end superscript. Figure 1D is set of four bar graphs, plotting Maximum load (total number), ranging from 0 to 20 in increments of 5; Breaking load (total number), ranging from 0 to 12 in increments of 4; Energy absorption (millijoules), ranging from 0 to 8 in increments of 2; and Stiffness (total number per millimeter), ranging from 0 to 45 in increments of 15 (y-axis) across control and cadmium (x-axis) for nuclear factor erythroid 2-related factor 2 begin superscript positive per positive end superscript and nuclear factor erythroid 2-related factor 2 begin superscript negative per negative end superscript. Figure 1E is a set of two bar graphs, plotting Tartrate-resistant acid phosphatase 5 b (nanograms per milliliter), ranging from 0 to 20 in increments of 5; and C-terminal telopeptides of type I (nanograms per milliliter), ranging from 0 to 4 in unit increments (y-axis) across control and cadmium (x-axis) for nuclear factor erythroid 2-related factor 2 begin superscript positive per positive end superscript and nuclear factor erythroid 2-related factor 2 begin superscript negative per negative end superscript. Figure 1F is a stained tissue that displays two columns, namely, control and cadmium, each for nuclear factor erythroid 2-related factor 2 begin superscript positive per positive end superscript and nuclear factor erythroid 2-related factor 2 begin superscript negative per negative end superscript. Figure 1G is a set of two bar graphs, plotting Osteoclast number per bone perimeter, ranging from 0 to 15 in increments of 5 and osteoclast surface per bone surface (percentage), ranging from 0 to 30 in increments of 10 (y-axis) across control and cadmium (x-axis) for nuclear factor erythroid 2-related factor 2 begin superscript positive per positive end superscript and nuclear factor erythroid 2-related factor 2 begin superscript negative per negative end superscript.
Figure 1.
The effects of cadmium (Cd) exposure on bone metabolic homeostasis in global Nrf2 knockout (Nrf2/) and WT littermate (Nrf2+/+) control mice. (A) Schematic illustration of the experimental design. Male mice (14 wk old) were exposed to cadmium chloride (CdCl2; 100mg Cd/L) in drinking water for 16 wk. (B) Representative images of the left femur of mice examined by micro-CT. Scale bar: 0.5mm. (C) Bone density estimations, including bone volume per tissue volume (BV/TV), trabecular separation (Tb.Sp), trabecular thickness (Tb.Th), trabecular number (Tb.N), total area (Tt.Ar), cortical area (Ct.Ar), structure thickness (St.Th) and cortical area per total area (Ct.Ar/Tt.Ar), were calculated using the Skyscan CT-Analyser software (version 1.1.7; Skyscan CTAn) based on micro-CT measurements. n=69. Values are expressed as mean±SD. Two-way ANOVA with Bonferroni multiple comparison posttest was used. *p<0.05 vs. Nrf2+/+ with the same treatment; #p<0.05 vs. control (Cont) of the same genotype. (D) Results of the three-point bending test performed on the left femurs. The maximum load, breaking load, energy absorption, and stiffness were calculated using Bluehill Elements. n=45. Values are expressed as mean±SD. Two-way ANOVA with Bonferroni multiple comparison posttest was used for the maximum load and breaking load; Kruskal–Wallis test with Dunn’s multiple comparisons posttest was used for the energy absorption and stiffness. *p<0.05 vs. Nrf2+/+ with the same treatment. #p<0.05 vs. Cont of the same genotype. (E) Plasma levels of TRAP5b and CTX-I. n=56. Values are expressed as mean±SD. Two-way ANOVA with Bonferroni multiple comparison posttest was used. *p<0.05 vs. Nrf2+/+ with the same treatment; #p<0.05 vs. Cont of the same genotype. (F) Representative histological images of TRAP staining of the right femur of mice. Black arrow, osteoclasts. Scale bar: 1mm. (G) Osteoclast number (OcN) and osteoclast surface (OcS) in the femur sections with TRAP staining normalized to bone perimeter (Bpm) and bone surface (BS), respectively. n=46. Values are expressed as mean±SD. Two-way ANOVA with Bonferroni multiple comparison posttest was used. *p<0.05 vs. Nrf2+/+ with the same treatment; #p<0.05 vs. Cont of the same genotype. Summary data are provided in Tables S6–S21. Note: ANOVA, analysis of variance; CTX-I, C-terminal telopeptides of type I; micro-CT, micro-computed tomography; Nrf2, nuclear factor erythroid 2-related factor 2; SD, standard deviation; Trap, tartrate-resistant acid phosphatase; W, weeks; WT, wild type.
Figure 2A is a schematic illustration depicting the experiment on male mice, which examined the effects of cadmium exposure on bone metabolic homeostasis in global nuclear factor erythroid 2-related factor 2 knockout and littermate control. A timeline with a scale from 0 to 30 weeks is displayed. The experiment began at 14 weeks, when the two groups of mice, knock-in and knockout genotypes, were given 100 parts per million of cadmium chloride in their drinking water for 8 and 16 weeks, respectively. One group of mice was sacrificed at week twenty-two, and the other was sacrificed at week thirty. Figure 2B is a stained tissue with two columns, namely, knock-in and knockout, and three rows, namely, Control, 8 weeks, and 16 weeks with a 0.5 millimeter scale bar. Figure 2C is a set of eight bar graphs, plotting Bone volume per tissue volume (percentage), ranging from 0 to 24 in increments of 6; Trabecular separation (micrometers), ranging from 0 to 400 in increments of 100; Trabecular thickness (micrometers), ranging from 0 to 80 in increments of 20; Trabecular number (millimeter begin superscript negative 1 end superscript), ranging from 0 to 4 in unit increments; Total area (millimeters begin superscript 2 end superscript), ranging from 0.0 to 1.5 in increments of 0.5; Cortical area (millimeters begin superscript 2 end superscript), ranging from 0.0 to 1.2 in increments of 0.4; Structure thickness (micrometer), ranging from 0.00 to 0.20 in increments of 0.05; and Cortical area per total area, ranging from 0.0 to 1.2 in increments of 0.4 (y-axis) across control, 8 weeks, and 16 weeks (x-axis) for knock-in and knockout. Figure 2D is a stained tissue with two columns, namely, knock-in and knockout, and three rows, namely, Control, 8 weeks, and 16 weeks with a 1 millimeter scale bar. Figure 2E is a set of two bar graphs, plotting Osteoclast number per bone perimeter, ranging from 0 to 20 in increments of 5 and Osteoclast surface per bone surface (percentage), ranging from 0 to 20 in increments of 5 (y-axis) across control, 8 weeks, and 16 weeks (x-axis) for knock-in and knockout. Figure 2F is a set of two bar graphs, plotting Tartrate-resistant acid phosphatase 5 b (nanograms per milliliter), ranging from 0 to 8 in increments of 2; C-terminal telopeptides of type I (nanograms per milliliter), ranging from 0 to 8 in increments of 2 (y-axis) across control, 8 weeks, and 16 weeks (x-axis) for knock-in and knockout. Figure 2G is a set of two bar graphs, plotting Procollagen type 1 amino-terminal propertied (nanograms per milliliter), ranging from 0 to 40 in increments of 10 and Osteocalcin (nanograms per milliliter), ranging from 0 to 4 in unit increments (y-axis) across control, 8 weeks, and 16 weeks (x-axis) for knock-in and knockout. Figure 2H is a set of two graphs, plotting Receptor activator of nuclear factor kappa-Β ligand (nanograms per milliliter), ranging from 0 to 80 in increments of 20 and Osteoprotegerin (picograms per milliliter), ranging from 0 to 800 in increments of 200 (y-axis) across control, 8 weeks, and 16 weeks (x-axis) for knock-in and knockout.
Figure 2.
The impacts of cadmium (Cd) exposure on bone metabolic homeostasis in myeloid-specific Nrf2 knockout [Nrf2(M)-KO] and their littermate control (Cont) mice. (A) Schematic illustration of the experimental design. Male mice (14 wk old) were exposed to cadmium chloride (CdCl2; 100mg Cd/L) in drinking water for 8 or 16 wk. (B) Representative images of the left femur of mice examined by micro-CT. Scale bar: 0.5mm. (C) Bone density estimations, including bone volume per tissue volume (BV/TV), trabecular separation (Tb.Sp), trabecular thickness (Tb.Th), trabecular number (Tb.N), total area (Tt.Ar), cortical area (Ct.Ar), structure thickness (St.Th), and cortical area per total area (Ct.Ar/Tt.Ar), were calculated using the Skyscan CT-Analyser software (version 1.1.7; Skyscan CTAn) based on micro-CT measurements. n=59. Values are expressed as mean±SD. Two-way ANOVA with Bonferroni multiple comparison posttest was used for BV/TV, Tb.Sp, Tb.Th, and Tb.N; Kruskal–Wallis test with Dunn’s multiple comparisons posttest was used for Tt.Ar, Ct.Ar, St.Th, and Ct.Ar/Tt.Ar. *p<0.05 vs. KI with the same treatment; #p<0.05 vs. Cont of the same genotype. (D) Representative histological images of TRAP staining of the right femur of mice. Black arrow, osteoclasts. Scale bar: 1mm. (E) Osteoclast number (OcN) and osteoclast surface (OcS) in the femur sections with TRAP staining normalized to bone perimeter (Bpm) and bone surface (BS), respectively. n=45. Values are expressed as mean±SD. Two-way ANOVA with Bonferroni multiple comparison posttest was used. *p<0.05 vs. KI with the same treatment; #p<0.05 vs. Cont of the same genotype. (F–H) Plasma levels of TRAP5b and CTX-I (F), P1NP and OCN (G), and RANKL and OPG (H). n=57. Values are expressed as mean±SD. Two-way ANOVA with Bonferroni multiple comparison posttest was used for OcN/Bpm, OcS/BS, TRAP5b, CTX-I, P1NP, and OPG; Kruskal–Wallis test with Dunn’s multiple comparisons posttest was used for OCN and RANKL. *p<0.05 vs. KI with the same treatment; #p<0.05 vs. Cont of the same genotype. Summary data are provided in Tables S22–S37. Note: ANOVA, analysis of variance; CTX-I, C-terminal telopeptides of type I; KI, Nfe2l2LoxP/LoxP; KO, Nrf2(M)-KO (knockout); micro-CT, micro-computed tomography; Nrf2, nuclear factor erythroid 2-related factor 2; OCN, osteocalcin; OPG, osteoprotegerin; P1NP, procollagen type I N-terminal propeptide; RANKL, receptor activator of nuclear factor kappa-B ligand; SD, standard deviation; Trap, tartrate-resistant acid phosphatase; W, week.
Figure 3A is a stained tissue divided into two columns, namely, vehicle and cadmium (nanomolar), divided into two columns, namely, 10 and 20 nanomolar, and two rows, namely, Nuclear factor erythroid 2-related factor 2 begin superscript positive per positive end superscript and Nuclear factor erythroid 2-related factor 2 begin superscript negative per negative end superscript with a 200 micrometer scale bar. Figures 3B, 3C, 3D, 3E, 3H, 3I, 3J, 3K, 3N, 3O, 3P, and 3Q are bar graphs, plotting Tartrate-resistant acid phosphatase positive multinucleated cells (greater than 3 total number) per well, ranging from 0 to 150 in increments of 50; Messenger ribonucleic acid of Cathepsin K (fold of nuclear factor erythroid 2-related factor 2 begin superscript positive per positive end superscript with vehicle), ranging from 0 to 60 in increments of 20; Messenger ribonucleic acid of H positive-atpase (fold of nuclear factor erythroid 2-related factor 2 begin superscript positive per positive end superscript with vehicle), ranging from 0 to 20 in increments of 5; Messenger ribonucleic acid of ATPase H positive Transporting V 0 Subunit D 2 (fold of nuclear factor erythroid 2-related factor 2 begin superscript positive per positive end superscript with vehicle), ranging from 0 to 15 in increments of 5; Tartrate-resistant acid phosphatase positive multinucleated cells (greater than 3 total number) per well, ranging from 0 to 200 in increments of 50; Messenger ribonucleic acid of Cathepsin K (fold of Scramble with vehicle), ranging from 0 to 6 in increments of 2 and 80 to 160 in increments of 80; Messenger ribonucleic acid of H positive-atpase (fold of Scramble with vehicle), ranging from 0 to 4 in increments of 2 and 40 to 80 in increments of 40; Messenger ribonucleic acid of ATPase H positive Transporting V 0 Subunit D 2 (fold of Scramble with vehicle), ranging from 0 to 3 in increments of 3 and 30 to 60 in increments of 30; Tartrate-resistant acid phosphatase positive multinucleated cells (greater than 3 total number) per well, ranging from 0 to 90 in increments of 30; Messenger ribonucleic acid of Cathepsin K (fold of control with vehicle), ranging from 0 to 12 in increments of 4; Messenger ribonucleic acid of H positive-atpase (fold of control with vehicle), ranging from 0 to 8 in increments of 2; and Messenger ribonucleic acid of ATPase H positive Transporting V 0 Subunit D 2 (fold of control with vehicle), ranging from 0 to 9 in increments of 3 (y-axis) across vehicle, 10, and 20 nanomolar under cadmium (nanomolar) (x-axis) for control and overexpression. Figure 3F is a western blot divided into two columns, namely, nuclear factor erythroid 2-related factor 2 begin superscript positive per positive end superscript and nuclear factor erythroid 2-related factor 2 begin superscript negative per negative end superscript, each divided into three columns, namely, vehicle, 10, and 20 nanomolar, and three rows, namely, Cadmium (nanomolar), Nuclear factor of activated T cells, cytoplasmic 1, and Beta-actin. The molecular weight (kilodaltons) ranges approximately between 42, 90, 110, and 140. Figure 3G is a stained tissue displaying divided into two columns, namely, vehicle and cadmium (nanomolar), divided into two columns, namely, 10 and 20 nanomolar, and two rows, namely, Scramble and Knockdown. Figure 3L is a western blot divided into two columns, namely, Scramble and Knockdown, divided into three columns, namely, vehicle, 10, and 20 nanomolar, and three rows, namely, Cadmium (nanomolar), Nuclear factor of activated T cells, cytoplasmic 1, and Beta-actin. The molecular weight (kilodaltons) ranges approximately between 42, 90, 110, and 140. Figure 3M is a stained tissue displaying divided into two columns, namely, Vehicle and Cadmium (nanomolar), divided into two columns, namely, 10 and 20 nanomolar, and two rows, namely, Control and Overexpression. Figure 3R is a western blot divided into two columns, namely, Control and Overexpression, each divided into three columns, namely, vehicle, 10, and 20 nanomolar, and three rows, namely, Cadmium (nanomolar), Nuclear factor of activated T cells, cytoplasmic 1, and Beta-actin. The molecular weight (kilodaltons) ranges approximately between 42, 90, 110, and 140.
Figure 3.
The effects of low-level cadmium (Cd) exposure on osteoclastogenesis in BM-OPCs and RAW 264.7 cells with genetic manipulation of Nrf2 expression. (A,G,M) Representative images of BM-OPCs (A) and RAW 264.7 cells with Nrf2 silencing (G) and Nrf2 overexpression (M) treated with RANKL (50 ng/mL) and M-CSF (30 ng/mL) for 7 d in the presence of vehicle (Veh), 10 or 20 nM Cd, followed by TRAP staining. BM-OPCs were isolated from Nrf2+/+ and Nrf2/ mice and cultured as detailed in the “Methods” section. Scale bars: 200μm. (B,H,N) TRAP-positive multinucleated cells containing three or more nuclei counted in the images. n=36. Values are expressed as mean±SD. Two-way ANOVA with Bonferroni multiple comparison posttest was used. *p<0.05 vs. Nrf2+/+, Scr or Cont with the same treatments; #p<0.05 vs. Veh of the same cytotype. (C–F,I–L,O–R) mRNA expression of Cathepsin K, H+-atpase, and Atp6v0d2, as well as protein expression of NFATc1 in the cells following the osteoclastogenic treatments. n=36. Values are expressed as mean±SD. Two-way ANOVA with Bonferroni multiple comparison posttest was used. *p<0.05 vs. Nrf2+/+, Scr or Cont with the same treatments; #p<0.05 vs. Veh of the same cytotype. Summary data are provided in Tables S38–S49. Quantifications of (F), (L), and (R) are found in Figure S7. Note: ANOVA, analysis of variance; Atp6v0d2, ATPase H positive Transporting V 0 Subunit D 2; BM-OPCs, bone marrow-derived osteoclast progenitor cells; Cont, control; KD, Nrf2-knockdown (Nrf2-KD); M-CSF, macrophage colony-stimulating factor; MNC, multinucleated cells; NFATc1, nuclear factor of activated T cells, cytoplasmic, calcineurin dependent 1; Nrf2, nuclear factor erythroid 2-related factor 2; OE, overexpression; RANKL, receptor activator of nuclear factor kappa-B ligand; RAW 264.7, mouse leukemic monocyte/macrophage cells; Scr, Scramble; SD, standard deviation; Trap, tartrate-resistant acid phosphatase.
Figures 4A, 4D, 4E, 4F, 4G, 4J, 4K, 4L, and 4M are bar graphs, plotting messenger ribonucleic acid of Long isoform-nuclear respiratory factor 1 (fold of Scramble with D 0), ranging from 0 to 6 in increments of 2; Tartrate-resistant acid phosphatase positive multinucleated cells (greater than 3 total number) per well, ranging from 0 to 600 in increments of 200; Messenger ribonucleic acid of Cathepsin K (fold of Scramble with vehicle), ranging from 0 to 15 in increments of 5; Messenger ribonucleic acid of H positive-atpase (fold of Scramble with vehicle), ranging from 0 to 12 in increments of 4; Messenger ribonucleic acid of ATPase H positive Transporting V 0 Subunit D 2 (fold of Scramble with vehicle), ranging from 0 to 9 in increments of 3; Tartrate-resistant acid phosphatase positive multinucleated cells (greater than 3 total number) per well, ranging from 0 to 180 in increments of 60; Messenger ribonucleic acid of Cathepsin K (fold of Scramble with vehicle), ranging from 0 to 9 in increments of 3; Messenger ribonucleic acid of H positive-atpase (fold of Scramble with vehicle), ranging from 0 to 12 in increments of 4; and Messenger ribonucleic acid of ATPase H positive Transporting V 0 Subunit D 2 (fold of Scramble with vehicle), ranging from 0 to 15 in increments of 5 (y-axis) across Scramble, knockdown, and knockdown plus overexpression (x-axis) for vehicle and cadmium. Figure 4B is a western blot divided into two columns, namely, Scramble and Knockdown, each divided into three columns, namely, D 2, D 3, and D 4, and two rows, namely, Long isoform-nuclear respiratory factor 1 and Beta-actin. The molecular weight (kilodaltons) ranges approximately between 42, 95, and 120. Figure 4C is a stained tissue displaying three columns, namely, Scramble, Knockdown, and Double knockdown, and two rows, namely, Vehicle and Cadmium with a 200 micrometer scale bar. Figure 4H is a western blot divided into three columns, namely, Scramble, Knockdown, and Double knockdown, each divided into two columns, namely, vehicle and cadmium, and two rows, namely, Nuclear factor of activated T cells, cytoplasmic 1 and Beta-actin. Figure 4I is a stained tissue displaying three columns, namely, Scramble, Knockdown, and Knockdown plus overexpression, and two rows, namely, Vehicle and Cadmium with a 200 micrometer scale bar. Figure 4N is a western blot divided into three columns, namely, Scramble, Knockdown, and Knockdown plus overexpression, each divided into two columns, namely, vehicle and cadmium, and two rows, namely, Nuclear factor of activated T cells, cytoplasmic 1 and Beta-actin.
Figure 4.
Genetic manipulation of L-Nrf1 expression in Nrf2-deficient RAW 264.7 cells and osteoclast differentiation following cadmium exposure. The (A) mRNA (A) and (B) protein levels of L-NRF1 in RAW cells with lentiviral Nrf2 silencing treated with RANKL (50 ng/mL) and M-CSF (30 ng/mL) for indicated days in the presence of 20 nM Cd. n=39. Values are expressed as mean±SD. Two-way ANOVA with Bonferroni multiple comparison posttest was used. *p<0.05 vs. Scr with the same treatment; #p<0.05 vs. the same genotype of D0. (C,D,I,J) Representative images (C) and (I) and quantifications (D) and (J) of TRAP staining of RAW cells with Nrf2-KD and L-Nrf1 knockdown or overexpression treated with RANKL (50 ng/mL) and M-CSF (30 ng/mL) for 5 d in the presence (i.e., Cd) or absence (i.e., Veh) of 20 nM Cd. For quantification, TRAP-positive multinucleated cells containing three or more nuclei on the images were counted. n=34. Values are expressed as mean±SD. Two-way ANOVA with Bonferroni multiple comparison posttest was used. *p<0.05 vs. the same genotype with Veh; #p<0.05 vs. Scr with the same treatment; &p<0.05 vs. KD with the same treatment. (E–H, K–N) The mRNA expression of Cathepsin K, H+-atpase, and Atp6v0d2 (E–G) and (K-M), as well as the protein levels of NFATc1 (H) and (N) were measured by RT-qPCR and immunoblotting, respectively, in the cells treated as detailed in (C), (D), (I), and (J). n=34. Values are expressed as mean±SD. Two-way ANOVA with Bonferroni multiple comparison posttest was used. *p<0.05 vs. the same genotype with Veh; #p<0.05 vs. Scr with the same treatment; &p<0.05 vs. KD with the same treatment. Summary data are provided in Tables S50–S58. Quantifications of (B), (H), and (N) are found in Figure S10. Note: ANOVA, analysis of variance; Atp6v0d2, ATPase H positive Transporting V 0 Subunit D 2; D0–D5, the day following osteoclastogenic treatments; DKD, Nrf2 and L-Nrf1 double knockdown; KD, Nrf2-knockdown (Nrf2-KD); KD+OE, Nrf2-KD and L-NRF1-741 overexpression; L-NRF1, long isoform nuclear factor-erythroid 2-related factor 1; M-CSF, macrophage colony-stimulating factor; MNC, multinucleated cells; NFATc1, nuclear factor of activated T cells, cytoplasmic, calcineurin dependent 1; Nrf2, nuclear factor erythroid 2-related factor 2; RANKL, receptor activator of nuclear factor kappa-B ligand; RAW 264.7, mouse leukemic monocyte/macrophage cells; RT-qPCR, reverse transcription quantitative polymerase chain reaction; Scr, Scramble; SD, standard deviation; Trap, tartrate-resistant acid phosphatase; Veh, vehicle.
Figure 5A is a set of two western blots divided into two columns, namely, Scramble and Knockdown, each divided into four columns, namely, vehicle, cadmium, N-acetylcysteine, cadmium plus N-acetylcysteine, and four rows, namely, Long isoform-nuclear respiratory factor 1 and Beta-actin, and Nuclear factor of activated T cells, cytoplasmic 1 and Beta-actin. Figure 5B is a stained tissue displaying four columns, namely, vehicle, cadmium, N-acetylcysteine, cadmium plus N-acetylcysteine, and two rows, namely, Scramble and Knockdown with a 200 micrometer scale bar. Figures 5C, 5D, 5E, 5F, 5I, 5J, 5K, and 5L are bar graphs, plotting Tartrate-resistant acid phosphatase positive multinucleated cells (greater than 3 total number) per well, ranging from 0 to 180 in increments of 60; Messenger ribonucleic acid of Cathepsin K (fold of Scramble with vehicle), ranging from 0 to 60 in increments of 20; Messenger ribonucleic acid of H positive-atpase (fold of Scramble with vehicle), ranging from 0 to 30 in increments of 10; Messenger ribonucleic acid of ATPase H positive Transporting V 0 Subunit D 2 (fold of Scramble with vehicle), ranging from 0 to 20 in increments of 5; Tartrate-resistant acid phosphatase positive multinucleated cells (greater than 3 total number) per well, ranging from 0 to 240 in increments of 80; Messenger ribonucleic acid of Cathepsin K (fold of Scramble with vehicle), ranging from 0 to 90 in increments of 30; Messenger ribonucleic acid of H positive-atpase (fold of Scramble with vehicle), ranging from 0 to 30 in increments of 10; and Messenger ribonucleic acid of ATPase H positive Transporting V 0 Subunit D 2 (fold of Scramble with vehicle), ranging from 0 to 40 in increments of 10 (y-axis) across vehicle, cadmium, mitoquinone mesylate, and cadmium plus mitoquinone mesylate (x-axis) for scramble and knockdown. Figure 5H is a stained tissue displaying four columns, namely, vehicle, cadmium, mitoquinone mesylate, and cadmium plus mitoquinone mesylate, and two rows, namely, Scramble and Knockdown with a 200 micrometer scale bar. Figure 5G is a set of two western blots divided into two columns, namely, Scramble and Knockdown, each divided into four columns, namely, vehicle, cadmium, mitoquinone mesylate, and cadmium plus mitoquinone mesylate, and four rows, namely, Long isoform-nuclear respiratory factor 1 and Beta-actin, and Nuclear factor of activated T cells, cytoplasmic 1 and Beta-actin.
Figure 5.
Effects of N-acetyl-l-cysteine (NAC) and mitoquinone mesylate (MitoQ) treatment on the protein levels of L-NRF1 and NFATc1 and osteoclast differentiation in Nrf2-KD and Scr RAW 264.7 cells. The cells were treated with RANKL (50 ng/mL) and M-CSF (30 ng/mL) for 5 d in the presence of 20 nM cadmium (Cd) with NAC (2 mM) or MitoQ (0.2μM). (A,G) Representative images of immunoblotting of L-NRF1 (upper panels) and NFATc1 (lower panels). (B,C,H,I) Representative images of TRAP staining (B) and (H) and the quantification of TRAP-positive multinucleated cells containing three or more nuclei (C) and (I). n=35. Values are expressed as mean±SD. Two-way ANOVA with Bonferroni multiple comparison posttest was used. *p<0.05 vs. Scr with the same treatment; #p<0.05 vs. the same genotype with Veh; &p<0.05 vs. the same genotype with Cd alone. (D–F,J–L) mRNA expression of Cathepsin K, H+-atpase, and Atp6v0d2. n=34. Values are expressed as mean±SD. Two-way ANOVA with Bonferroni multiple comparison posttest was used, *p<0.05 vs. Scr with the same treatment; #p<0.05 vs. the same genotype with Veh; &p<0.05 vs. the same genotype with Cd alone. Summary data are provided in Tables S59–S66. Quantification of (A) and (G) is found in Figure S16. Note: ANOVA, analysis of variance; Atp6v0d2, ATPase H positive Transporting V 0 Subunit D 2; Cd, Cd alone; Cd+MitoQ, Cd and MitoQ co-treatment; Cd+NAC, Cd and NAC co-treatment; KD, Nrf2-knockdown (Nrf2-KD); L-NRF1, long isoform nuclear factor-erythroid 2-related factor 1; M-CSF, macrophage colony-stimulating factor; MitoQ, MitoQ alone; NAC, NAC alone; NFATc1, nuclear factor of activated T cells, cytoplasmic, calcineurin dependent 1; RANKL, receptor activator of nuclear factor kappa-B ligand; Scr, Scramble; SD, standard deviation; Trap, tartrate-resistant acid phosphatase; Veh, vehicle.
Figure 6 is divided into four schematic illustrations. On the top-left, the illustration titled Wild type displays a flowchart with five steps. Step 1: Receptor activator of nuclear factor kappa-Β leads to Tumor necrosis factor receptor-associated factor 6. Step 2: Tumor necrosis factor receptor-associated factor 6 leads to reactive oxygen species and nuclear factor of activated T cells, cytoplasmic, calcineurin dependent 1. Step 3: Reactive oxygen species is linked with Antioxidants and leads to Nuclear factor erythroid 2-related factor 2, Long isoform-Nuclear factor erythroid 2-related factor 1, and Nuclear factor of activated T cells, cytoplasmic, calcineurin dependent 1. Step 4: Nuclear factor erythroid 2-related factor 2 and Long isoform-nuclear factor erythroid 2-related factor 1 lead to Antioxidants. Step 5: nuclear factor of activated T cells, cytoplasmic, calcineurin dependent 1 leads to cathepsin K, ATPase H positive Transporting V 0 Subunit D 2, H positive-atpase, and Oscar. On the top-right, the illustration titled Wild type displays a flowchart with six steps. Step 1: Receptor activator of nuclear factor kappa-Β leads to Tumor necrosis factor receptor-associated factor 6. Step 2: Tumor necrosis factor receptor-associated factor 6 leads to Reactive oxygen species and Nuclear factor of activated T cells, cytoplasmic, calcineurin dependent 1. Step 3: Reactive oxygen species is linked with Antioxidants and leads to Nuclear factor erythroid 2-related factor 2, Long isoform-nuclear factor erythroid 2-related factor 1, and Nuclear factor of activated T cells, cytoplasmic, calcineurin dependent 1. Step 4: Cadmium leads to Reactive oxygen species. Step 5: Nuclear factor erythroid 2-related factor 2 and Long isoform-nuclear factor erythroid 2-related factor 1 lead to Antioxidants. Step 6: Nuclear factor of activated T cells, cytoplasmic, calcineurin dependent 1 leads to cathepsin K, ATPase H positive Transporting V 0 Subunit D 2, H positive-atpase, and Oscar. At the bottom-left, the illustration titled Knockout or knockdown displays a flowchart with five steps. Step 1: Receptor activator of nuclear factor kappa-Β leads to Tumor necrosis factor receptor-associated factor 6. Step 2: Tumor necrosis factor receptor-associated factor 6 leads to Reactive oxygen species and Nuclear factor of activated T cells, cytoplasmic, calcineurin dependent 1. Step 3: Reactive oxygen species is linked with Antioxidants and leads to Long isoform-nuclear factor erythroid 2-related factor 1 and Nuclear factor of activated T cells, cytoplasmic, calcineurin dependent 1. Step 4: Long isoform-nuclear factor erythroid 2-related factor 1 leads to Antioxidants. Step 5: Nuclear factor of activated T cells, cytoplasmic, calcineurin dependent 1 leads to cathepsin K, ATPase H positive Transporting V 0 Subunit D 2, H positive-atpase, and Oscar. At the bottom-right, the illustration titled Knockout or knockdown displays a flowchart with six steps. Step 1: Receptor activator of nuclear factor kappa-Β leads to Tumor necrosis factor receptor-associated factor 6. Step 2: Tumor necrosis factor receptor-associated factor 6 leads to Reactive oxygen species and Nuclear factor of activated T cells, cytoplasmic, calcineurin dependent 1. Step 3: Reactive oxygen species is linked with Antioxidants and leads to Long isoform-nuclear factor erythroid 2-related factor 1 and Nuclear factor of activated T cells, cytoplasmic, calcineurin dependent 1. Step 4: Cadmium leads to Reactive oxygen species. Step 5: Long isoform-nuclear factor erythroid 2-related factor 1 leads to Antioxidants. Step 6: Nuclear factor of activated T cells, cytoplasmic, calcineurin dependent 1 leads to cathepsin K, and ATPase H positive Transporting V 0 Subunit D 2, H positive-atpase, and Oscar.
Figure 6.
A schematic depiction of the potential molecular mechanisms underlying the cadmium (Cd) exposure-augmented osteoclastogenesis. NFATc1, which is a direct downstream transcriptional target of L-NRF1 and is also influenced by intracellular ROS levels, is a key driver controlling the osteoclastogenesis signaling cascade. NRF2, as a master transcription factor regulating many antioxidant genes, is involved in the regulation of osteoclast differentiation via the NRF2–antioxidants–ROS negative feedback loop. Cd exposure may stimulate intracellular ROS production via a complex mechanism and thus aggravate osteoclast differentiation, which can be mitigated by the NRF2-mediated antioxidant response. As a result, deficiency of Nrf2 augments Cd exposure-stimulated osteoclast differentiation in a ROS-dependent manner, in which ROS may up-regulate NFATc1 via L-NRF1-dependent and independent mechanisms. Note: Atp6v0d2, ATPase H positive Transporting V 0 Subunit D 2; KD, Nrf2-knockdown (Nrf2-KD); KO, myeloid-specific Nrf2 knockout [Nrf2(M)-KO]; L-NRF1, long isoform nuclear factor-erythroid 2-related factor 1; NFATc1, nuclear factor of activated T cells, cytoplasmic, calcineurin dependent 1; Nrf2, nuclear factor erythroid 2-related factor 2; RANK, receptor activator of nuclear factor kappa-B; ROS, reactive oxygen species; TRAF6, tumor necrosis factor receptor–associated factor 6; WT, wild type.

Similar articles

Cited by

References

    1. Järup L, Åkesson A. 2009. Current status of cadmium as an environmental health problem. Toxicol Appl Pharmacol 238(3):201–208, PMID: 19409405, 10.1016/j.taap.2009.04.020. - DOI - PubMed
    1. Landrigan PJ, Fuller R, Acosta NJR, Adeyi O, Arnold R, Basu NN, et al. . 2018. The Lancet Commission on pollution and health. Lancet 391(10119):462–512, PMID: 29056410, 10.1016/S0140-6736(17)32345-0. - DOI - PubMed
    1. Adams SV, Newcomb PA, Shafer MM, Atkinson C, Bowles EJA, Newton KM, et al. . 2011. Sources of cadmium exposure among healthy premenopausal women. Sci Total Environ 409(9):1632–1637, PMID: 21333327, 10.1016/j.scitotenv.2011.01.037. - DOI - PMC - PubMed
    1. Mezynska M, Brzóska MM. 2018. Environmental exposure to cadmium—a risk for health of the general population in industrialized countries and preventive strategies. Environ Sci Pollut Res Int 25(4):3211–3232, PMID: 29230653, 10.1007/s11356-017-0827-z. - DOI - PubMed
    1. Satarug S, Garrett SH, Sens MA, Sens DA. 2010. Cadmium, environmental exposure, and health outcomes. Environ Health Perspect 118(2):182–190, PMID: 20123617, 10.1289/ehp.0901234. - DOI - PMC - PubMed