. 2024 Aug;11(31):e2402716.
doi: 10.1002/advs.202402716. Epub 2024 Jun 19.

Spatial Transcriptome-Wide Profiling of Small Cell Lung Cancer Reveals Intra-Tumoral Molecular and Subtype Heterogeneity

Affiliations

Spatial Transcriptome-Wide Profiling of Small Cell Lung Cancer Reveals Intra-Tumoral Molecular and Subtype Heterogeneity

Zicheng Zhang et al. Adv Sci (Weinh). 2024 Aug.

Abstract

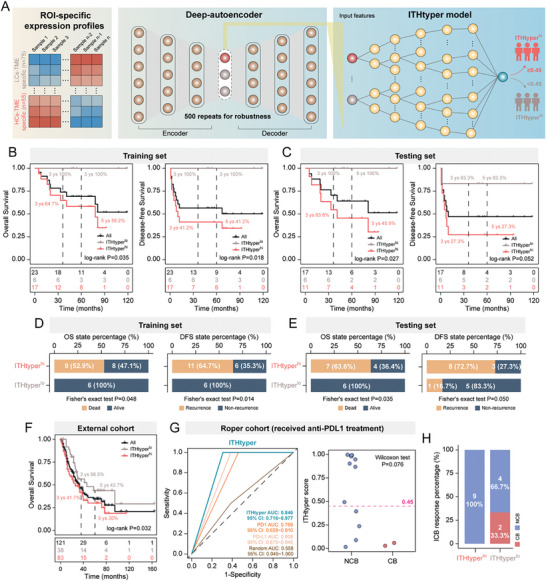
Small cell lung cancer (SCLC) is a highly aggressive malignancy characterized by rapid growth and early metastasis and is susceptible to treatment resistance and recurrence. Understanding the intra-tumoral spatial heterogeneity in SCLC is crucial for improving patient outcomes and clinically relevant subtyping. In this study, a spatial whole transcriptome-wide analysis of 25 SCLC patients at sub-histological resolution using GeoMx Digital Spatial Profiling technology is performed. This analysis deciphered intra-tumoral multi-regional heterogeneity, characterized by distinct molecular profiles, biological functions, immune features, and molecular subtypes within spatially localized histological regions. Connections between different transcript-defined intra-tumoral phenotypes and their impact on patient survival and therapeutic response are also established. Finally, a gene signature, termed ITHtyper, based on the prevalence of intra-tumoral heterogeneity levels, which enables patient risk stratification from bulk RNA-seq profiles is identified. The prognostic value of ITHtyper is rigorously validated in independent multicenter patient cohorts. This study introduces a preliminary tumor-centric, regionally targeted spatial transcriptome resource that sheds light on previously unexplored intra-tumoral spatial heterogeneity in SCLC. These findings hold promise to improve tumor reclassification and facilitate the development of personalized treatments for SCLC patients.

Keywords: digital spatial profiling (DSP); intra‐tumoral heterogeneity (ITH); small cell lung cancer (SCLC); spatial transcriptomics.


Conflict of interest statement

The authors declare no conflict of interest.

Figures

Figure 1
Figure 1
Transcriptome‐wide spatial profiling of SCLCs. A) Schematic of the study workflow. The whole process includes TMA construction, fluorescence antibody incubation, probe hybridization, ROI selection and segmentation, barcode sequencing, DSP data processing and analysis. B) Schematic representation of 79 ROIs from 25 SCLC patients. C) Histogram showing the distribution of pairwise spatial physical distance (SPD) between ROIs. Distance was used with µm. D) Histogram of the number of ROIs with the average expression presented in log format. The average expression was transformed with log2(x + 1). DSP, digital spatial profiling; TMA, tissue microarray; ROIs, regions of interest.
Figure 2
Figure 2
Distinct expression patterns associated with intra‐tumoral ROIs identified by DSP. A) 2D t‐SNE plot of all ROIs based on t‐SNE using the DSP transcriptomic profile. B) Heatmap showing the hierarchical clustering of 75 ROIs distributed across three distinct clusters based on the top 200 HVGs. C) Box plots showing the ITH scores among three ROI clusters. C1 is the high‐ITH phenotype (referred to as h‐ITH), C2 is the medium‐ITH phenotype (referred to as m‐ITH), and C3 is the low‐ITH phenotype (referred to as l‐ITH). p values were calculated with the Wilcoxon test (two clusters) and the Kruskal–Wallis test (three clusters); ns p > 0.05; * p < 0.05; ** p < 0.01, *** p < 0.001. D) H&E staining of the SCLC tumor tissue with ROI information. Red represents the h‐ITH ROIs; yellow represents the m‐ITH ROIs; blue represents the l‐ITH ROIs. E) Volcano plot showing differentially expressed genes among different ITH phenotypes (h‐ITH vs m‐ITH/ l‐ITH; m‐ITH vs h‐ITH/ l‐ITH and l‐ITH vs h‐ITH/ m‐ITH). The specific expressed genes (FC > 1.5, p ≤ 0.05) of each phenotype were highlighted with corresponding ITH phenotype color. F) Gene‐gene co‐expression network with color‐annotated ITH phenotype. G) Network plot showing the enriched biological process in h‐ITH phenotype, m‐ITH phenotype, and l‐ITH phenotype by ClueGO. DSP, digital spatial profiling; HVGs, highly variable genes; ITH, intra‐tumoral heterogeneity; PCA, principal component analysis; ROIs, regions of interest.
Figure 3
Figure 3
Characterization of immune features in the intra‐tumoral spatially sub‐tumor microenvironments. A) Bar plot showing the relative infiltration abundance of 22 immune cells estimated via spatial RNA expression using the CIBERSORT algorithm. B,C) Box plots showing infiltration abundance of CD8+ T cells among h‐ITH, m‐ITH, and l‐ITH phenotypes estimated by CIBERSORT, TIMER, and MCPCOUNTER algorithms. p values were calculated with the Wilcoxon test (two clusters) and the Kruskal‐Wallis test (three clusters); ns p > 0.05; * p < 0.05; ** p < 0.01, *** p < 0.001. D) IHC staining images of CD8 for h‐ITH, m‐ITH, and l‐ITH phenotypes. Bar plots showing the difference of CD8 H‐score among h‐ITH, m‐ITH and l‐ITH phenotypes. Error bars represent mean ± SEM. p values were calculated with the Wilcoxon test (two clusters) and the Kruskal–Wallis test (three clusters); ns p > 0.05; * p < 0.05; ** p < 0.01, *** p < 0.001. E) Heatmap showing expression levels of co‐stimulatory and co‐inhibitory molecules among h‐ITH, m‐ITH, and l‐ITH phenotypes. p values were calculated by the Wilcoxon test (two clusters) and the Kruskal‐Wallis test (three clusters); ns p > 0.05; * p < 0.05; ** p < 0.01, *** p < 0.001.
Figure 4
Figure 4
Spatial intra‐tumoral heterogeneity is associated with patient's survival and therapeutic outcome. A) The percentage of ROI ITH phenotypes at the SCLC patient's level. B) Bar plot showing the distribution of C‐score among different patient groups. p values were calculated with the Wilcoxon test (two clusters) and the Kruskal‐Wallis test (three clusters); ns p > 0.05; * p < 0.05; ** p < 0.01, *** p < 0.001. C) Kaplan–Meier analysis of OS and DFS between patients with HCs‐TME and LCs‐TME. P values were calculated with the log‐rank test. Stacked bar plots showing the distribution of OS and DFS status on HCs‐TME and LCs‐TME in SCLC patients. p values were calculated using Fisher's exact test. DFS, disease‐free survival; OS, overall survival.
Figure 5
Figure 5
Association of spatial intra‐tumoral heterogeneity with conventional molecular classification in SCLC. A) Heatmap showing the dominant transcriptional subtype of ROIs. B) Bar plot showing the percentage of transcriptional subtypes in ROIs at the SCLC patient level. C) Bar plots showing the distribution of NE subtype of ROIs. D) Bar plot showing the percentage of ROI NE subtype at SCLC patient level. E) Sankey diagram showing the association of the sub‐TME heterogeneous phenotypes with transcriptional or NE subtypes. F) Pie plots showing the distribution of conventional molecular subtypes in HCs‐TME and LCs‐TME. p values were calculated using Fisher's exact test. G) Kaplan–Meier analysis of disease‐free survival among different patient groups. p values were calculated with the log‐rank test.
Figure 6
Figure 6
Deep learning identified spatially resolved gene signatures. A) Workflow for the computational strategy used to identify gene signature in distinguishing HCs‐TME and LCs‐TME. B,C) Kaplan–Meier analysis of OS and DFS between ITHtyperlo phenotype and ITHtyperhi phenotype in the training and testing sets. P values were calculated with the log‐rank test. D,E) Bar plots showing the distribution of OS status and DFS status on the ITHtyperlo phenotype and ITHtyperhi phenotype. P values were calculated using Fisher's exact test. F) Kaplan‐Meier analysis of OS between ITHtyperlo phenotype and ITHtyperhi phenotype on George & Jiang cohort (n = 121). p‐value was calculated with the log‐rank test. G) ROC curves for ITHtyper on Roper cohort (received anti‐PDL1 treatment). Dot plot showing the difference in the ITHtyper score between the NCB group and the CB group receiving immunotherapy. p‐value was calculated using the Wilcoxon test. H) Bar plot showing the distribution of ICB response on ITHtyperlo phenotype and ITHtyperhi phenotype. DFS, disease‐free survival; OS, overall survival; ROC, Receiver operating characteristic; CB, clinical benefit; NCB, no clinical benefit.

References

    1. a) WHO Classification of Tumours Editorial Board , Thoracic Tumours, 5th ed., WHO classification of tumours series, Vol. 5, Lyon, France: International Agency for Research on Cancer 2021.
    2. b) Rudin C. M., Brambilla E., Faivre‐Finn C., Sage J., Nat. Rev. Dis. Primers 2021, 7, 3. - PMC - PubMed
    1. Horn L., Mansfield A. S., Szczęsna A., Havel L., Krzakowski M., Hochmair M. J., Huemer F., Losonczy G., Johnson M. L., Nishio M., Reck M., Mok T., Lam S., Shames D. S., Liu J., Ding B., Lopez‐Chavez A., Kabbinavar F., Lin W., Sandler A., Liu S. V., N. Engl. J. Med. 2018, 379, 2220. - PubMed
    1. Waqar S. N., Morgensztern D., Pharmacol. Ther. 2017, 180, 16. - PubMed
    1. a) Fisher R., Pusztai L., Swanton C., Br. J. Cancer 2013, 108, 479; - PMC - PubMed
    2. b) Marusyk A., Janiszewska M., Polyak K., Cancer Cell 2020, 37, 471; - PMC - PubMed
    3. c) McGranahan N., Swanton C., Cancer Cell 2015, 27, 15; - PubMed
    4. d) McGranahan N., Swanton C. J. C. c., Cancer Cell 2015, 27, 15. - PubMed
    1. George J., Lim J. S., Jang S. J., Cun Y., Ozretić L., Kong G., Leenders F., Lu X., Fernández‐Cuesta L., Bosco G., Müller C., Dahmen I., Jahchan N. S., Park K.‐S., Yang D., Karnezis A. N., Vaka D., Torres A., Wang M. S., Korbel J. O., Menon R., Chun S.‐M., Kim D., Wilkerson M., Hayes N., Engelmann D., Pützer B., Bos M., Michels S., Vlasic I., Nature 2015, 524, 47. - PMC - PubMed

LinkOut - more resources