. 2024 Aug;11(31):e2400185.
doi: 10.1002/advs.202400185. Epub 2024 Jun 19.

Patient-Derived Tumor Organoids Combined with Function-Associated ScRNA-Seq for Dissecting the Local Immune Response of Lung Cancer

Affiliations

Patient-Derived Tumor Organoids Combined with Function-Associated ScRNA-Seq for Dissecting the Local Immune Response of Lung Cancer

Chang Liu et al. Adv Sci (Weinh). 2024 Aug.

Abstract

In vitro models coupled with multimodal approaches are needed to dissect the dynamic response of local tumor immune microenvironment (TIME) to immunotherapy. Here the patient-derived primary lung cancer organoids (pLCOs) are generated by isolating tumor cell clusters, including the infiltrated immune cells. A function-associated single-cell RNA sequencing (FascRNA-seq) platform allowing both phenotypic evaluation and scRNA-seq at single-organoid level is developed to dissect the TIME of individual pLCOs. The analysis of 171 individual pLCOs derived from seven patients reveals that pLCOs retain the TIME heterogeneity in the parenchyma of parental tumor tissues, providing models with identical genetic background but various TIME. Linking the scRNA-seq data of individual pLCOs with their responses to anti-PD-1 (αPD-1) immune checkpoint blockade (ICB) allows to confirm the central role of CD8+ T cells in anti-tumor immunity, to identify potential tumor-reactive T cells with a set of 10 genes, and to unravel the factors regulating T cell activity, including CD99 gene. In summary, the study constructs a joint phenotypic and transcriptomic FascRNA-seq platform to dissect the dynamic response of local TIME under ICB treatment, providing a promising approach to evaluate novel immunotherapies and to understand the underlying molecular mechanisms.

Keywords: function‐associated single‐cell RNA sequencing; immune checkpoint blockade; local tumor immune microenvironment; primary lung cancer organoid; tumor micro‐niche.


Conflict of interest statement

The authors declare no conflict of interest.

Figures
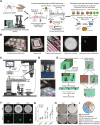
Figure 1
Figure 1
The single‐cell and single‐organoid distribution platform. A) Schematic design of the single‐pLCO analysis using FascRNA‐seq. After patient‐derived lung cancer organoids were generated, single pLCOs were distributed into MoSMAR‐chip microwells followed αPD‐1 or IgG treatment within a week. Individual pLCO was stained with Calcein‐AM/PI for phenotypic evaluation, then digested into single cells for FascRNA‐seq. The downstream bioinformatics analysis was conducted with phenotype supervision for immune process interpretation. B) Images of the MoSMAR‐chip and single‐cell culture within microwells. Eight reaction chips were installed on the chip frame and each reaction chip consists of 12×8 microwells, with corresponding droplets for cell culture, staining and observation. C) Schematic diagram and D) images of the automated single‐cell/organoid distribution instrument, consisting of the imaging, computing, motion control, mechanical arm, object stage, hydraulic and capillary modules. E) Schematic diagram of process for establishing the YOLO neural network for single cell/organoid recognition. The network was trained with ≈600 collected images to form the classifier, then the neural network classifier was applied to identify capillary, single cells, and single organoids. F) Images of single organoids distributed in the microwells and traced for seven days. At day‐7, the organoids were stained with Calcein‐AM to confirm their viability. Scale bar: 100 µm. G) Size of the traced single organoids at day‐1 and day‐7 post distribution (n = 36). H) Images of single cells disgested from L4853 organoids and cultured in the microwells of a MoSMAR‐chip. The circle indicates the single cell which is shown by the enlarged image at the upper right corner. Scale bar: 50 µm. I) Various circumstances of L4853‐derived single‐cell culture after seven days on a MoSMAR‐chip (n = 96).
Figure 2
Figure 2
Verification of FascRNA‐seq. A) Structure of the 3′ mRNA capture oligo for FascRNA‐seq. B) Violin plots of the number of genes (average 5380), mapped reads (average 30522), and ratio of mitochondria‐related genes (Mt. gene) detected by FascRNA‐seq for 192 H2122 cells. C) Ratio of mapped reads for 192 H2122 cells. D) Correlation between the average of 192 single‐cell transcriptomes and bulk RNA‐seq data. The top 1000 genes detected in FascRNA‐seq were compared. E) Numbers of reads and genes detected in single cells for three repeats of FascRNA‐seq (n = 576). F) Numbers of mouse reads and human reads detected in each microwell of a MoSMAR‐chip which is distributed with single mouse cells (NIH3T3) and human cells (H2122) in alternate lines (n = 192). G) Cell type profiling of the H2122 and Huh7 cell lines using FascRNA‐seq. Left: tSNE visualization of scRNA‐seq data from two types of cells. Right: violin plots showing the expression levels of signature genes for lung (H2122) and liver (Huh7) cells (n = 384). H) Representative images of 14 L4853 organoids cultured on chip for seven days. On day‐7, the organoids were stained with Calein‐AM/PI to verify their viability. Scale bar: 100 µm. I) Quantification of the growth rates (GR) of 14 organoids. Individual organoids were categorized into three groups according to their GR (Fast, GR ≥ 3; Medium, 1.5 < GR < 3; Slow, GR ≤ 1.5). J) UMAP visualization of 672 single cells derived from 14 L4853 organoids. Cells were color labeled with the unsupervised clusters (left) or the categories according to GR (right) of the parental organoids. K) Proportions of cells from four clusters in the 14 organoids. L) Average expression of selected reference gene (GAPDH), typical proliferation gene (MKI67) and malignancy related genes in 14 organoids. Individual organoids are color labeled according to their groups of GR. Note the upregulated expression of these genes in fast growing organoids.
Figure 3
Figure 3
Characterization of primary lung cancer organoids. A) Scheme for pLCO generation and characterization. The pLCOs were generated by mechanical grinding and filtering from lung cancer samples, characterized mainly by flow cytometry and FascRNA‐seq. Scale bars: 50 µm. B) Flow cytometry results from the tumor tissue and pLCOs paired sample, showing the presence of immune components in pLCOs, including T cells. C) Proportions of epithelial cells, lymphocytes, and subtypes of lymphocytes in pLCOs along with the parental tumor tissues detected by flow cytometry (paired student's t tests, n = 7). D) Pearson correlation coefficient between the major TIME components of pLCOs and parental tumor tissues detected by flow cytometry (n = 7). E) Immunofluorescent staining images of the cryosection of pLCOs. Note the presence of CD3+ T cells which is in direct contact with the EpCAM+ epithelial cells. Scale bar: 10 µm. F) tSNE visualization of the single‐cell landscape of ≈6000 cells from 171 pLCOs. The single cells were color labeled with the annotated cell types. G) Average expression levels of marker genes for the annotated cell types. H) PCC analysis between the flow cytometry and FascRNA‐seq results on the proportion of CD8+ T cells in pLCOs derived from different patient samples (n = 6). I) Proportions of the indicated immune cells in pLCOs derived from seven lung cancer samples. Samples are categorized into three types according to the frequencies of the immune cells (desert, no immune cells; cold, few T cells; hot, abundant T cells). J–L) H&E and mIHC images of the sections from tumor tissues P3 (J), P5 (K), and P7 (L). The mIHC of tumor tissue sections were stained with CD3, CD163, and PanCK to detect the T cells, macrophages, and cancer cells, respectively. Scale bars: 100 µm. M) PCC analysis revealed significant correlation of cell proportions between pLCOs and the parenchyma region of tissue sections (n = 5).
Figure 4
Figure 4
CD8+ T cells mediate the responses of pLCOs to αPD‐1 treatment. A) Scheme of the drug treatment experiment on individual pLCOs. B) Images of the individual pLCOs under IgG or αPD‐1 treatments. pLCOs were stained with Calcein‐AM/PI on day‐7. Scale bars: 50 µm. C) Heatmap showing the proportions of immune cells and the quantification of killing index among 171 pLCOs with or without αPD‐1 treatment. D) Comparison of the survival index of 171 individual organoids under αPD‐1 or control treatments. E) PCC analysis between immune cell proportion and the killing index. The X and Y axis show PCC for the αPD‐1 and control treatments, respectively. The data points are color labeled by the types of immune cells. The diameter of the point represents the geometric mean of the P value. Left: PCC analysis at the patient level where the average of organoids from the same patient sample was used as the patient data. Middle and right: PCC at the pLCO level of P5 and P7. F) Heatmap illustrating the average expression of T cell function‐associated genes in PITs of our dataset and the 14 T cell clusters reported in a pan‐cancer T cell atlas.[ 23 ] PCC analysis indicating the significant correlation between expression features of PITs and c2_Teff. G) Heatmap showing the average of normalized expression of T cell function‐related genes under two treatment conditions and the proportion of cells with positive expression. The boldfaces indicate genes with significantly different levels. H) PCC analysis between the average expression level of the effector molecules in single pLCOs and the killing index. I) Quantification of the frequency of CD8+ T cells expressing 0, 1, or 2 of the effector molecules GZMB and PRF1 in P5 (n = 38) and P7 (n = 31) pLCOs. J) Comparison of Ki with CD8+ T cells expression patterns of GZMB/PRF1 in P5 pLCOs and IFNG in both P5 (n = 38) and P7 (n = 31) pLCOs.
Figure 5
Figure 5
Identification of tumor‐reactive T cells and cell‐cell interactions promote T cell activation. A) Images of single pLCOs stained with Calcein‐AM/PI (top panels), bubble charts in the middle showing the expression levels of the 10 genes for calculating Tai (each column represent a single T cell), bar graph at the bottom showing Tai of each T cells. Scale bar: 100 µm. B) PCC analysis revealed significant correlation between average Tai and killing index for individual pLCOs (n = 69). C) Comparison of Tai for single CD8+ T cells under the two treatment conditions. D) Comparison of killing index for pLCOs with (w/) or without (w/o) high Tai (>0.5) cells. E) Comparison of the average expression levels (left) and frequencies (right) of the inhibitory receptors in high Tai cells and other CD8+ T cells. F) Comparison of cell death under the two treatment conditions in P5 (n = 38) and P7 (n = 31) pLCOs with different number of CD8+ T cells (one‐way ANOVA analysis for multiple groups). G) Upper panels: heatmap showing the dynamics of normalized gene expression in CD8+ T cells. Columns represent pLCOs ordered in treatment conditions and number of incorporated CD8+ T cells as indicated by the horizontal color bar at the bottom. All the genes are categorized into three groups. The c1 includes genes upregulated in IgG treated pLCOs, c2 includes genes upregulated in αPD‐1 treated pLCOs with 1–3 CD8+ T cells. c3 includes genes upregulated in αPD‐1 treated pLCOs with four or more CD8+ T cells. Lower panels: average level of all the genes from the indicated GO terms for the indicated pLCO groups. Background color represents the pLCO groups indicated on the right. Line colors indicate GO terms or the Tai. H) Pie charts showing the abundance of cell‐cell interactions received by CD8+ T cells and sent by different types of cells. I) Average communication scores of CD8+ T cell‐CD8+ T cell interactions for the indicated pLCO groups. Background color represents the same pLCO groups as in (G). J) PCC analysis between the communication scores of ligand‐receptor pairs and killing index of P5 pLCOs. Note the homophilic interaction of CD99 was the most significantly correlated with killing index. K) Correlation between CD99 homophilic interaction and killing index (left) or average Tai (right) of P5 pLCOs (n = 34). L) The Kaplan–Meier overall survival curves of TCGA lung cancer patients (n = 1089), grouped by the expression level of CD3 and CD99 genes. P value was calculated by multivariate Cox regression.
Figure 6
Figure 6
Gathering of M2‐like macrophages prevents the accumulation of CD8+ T cells. A) Heatmap showing PCC between the proportions of different immune cell types (n = 171). Note the negative correlation between Mphs and T cells. B) Dotplot showing the average proportions of T and Mph in the pLCOs from different patient samples. The lines on the dots represent the standard deviation and the color of the dots indicates the average Ki for pLCOs. C,D) mIHC images of P4 (C) and P5 (D) tumor tissue sections. Note the excluding of T cells from tumor parenchyma of P4 and the presence of both T and Mph in P5. Scale bars: 60 µm. E) Quantification of T cell and Mph proportions in individual pLCOs (upper panels, n = 57) and the CD3 and CD163 signals in randomly picked 0.2 mm × 0.2 mm regions of the parental tumor parenchyma (lower panels, n = 85). Note the similar trends of the T over Mph ratio in individual pLCOs and parenchyma regions of the same patient sample. F) tSNE visualization of Mphs from all pLCOs. Data points of each cell were labeled with patient ID or normalized expression of indicated genes. G) PCC between T cell number and average expression level of tumor immune related genes in the Mphs of pLCOs. H,I) The ligand‐receptor pairs between Mphs and ECs (H) or between Mphs and T cells (I) that had the most significant correlation with the number of T cells in pLCOs. Note the negative correlation for most of the ligand‐receptor pairs between Mphs and ECs.

References

    1. Hunter M. V., Moncada R., Weiss J. M., Yanai I., White R. M., Nat. Commun. 2021, 12, 6278. - PMC - PubMed
    1. Binnewies M., Roberts E. W., Kersten K., Chan V., Fearon D. F., Merad M., Coussens L. M., Gabrilovich D. I., Ostrand‐Rosenberg S., Hedrick C. C., Vonderheide R. H., Pittet M. J., Jain R. K., Zou W., Howcroft T. K., Woodhouse E. C., Weinberg R. A., Krummel M. F., Nat. Med. 2018, 24, 541. - PMC - PubMed
    1. Joshi K., de Massy M. R., Ismail M., Reading J. L., Uddin I., Woolston A., Hatipoglu E., Oakes T., Rosenthal R., Peacock T., Ronel T., Noursadeghi M., Turati V., Furness A. J. S., Georgiou A., Wong Y. N. S., Ben Aissa A., Sunderland M. W., Jamal‐Hanjani M., Veeriah S., Birkbak N. J., Wilson G. A., Hiley C. T., Ghorani E., Guerra‐Assuncao J. A., Herrero J., Enver T., Hadrup S. R., Hackshaw A., Peggs K. S., et al., Nat. Med. 2019, 25, 1549. - PMC - PubMed
    1. Gaglia G., Burger M. L., Ritch C. C., Rammos D., Dai Y., Crossland G. E., Tavana S. Z., Warchol S., Jaeger A. M., Naranjo S., Coy S., Nirmal A. J., Krueger R., Lin J. R., Pfister H., Sorger P. K., Jacks T., Santagata S., Cancer Cell 2023, 41, 871. - PMC - PubMed
    1. Tuveson D., Clevers H., Science 2019, 364, 952. - PubMed

MeSH terms

Substances

LinkOut - more resources