. 2024 Aug;11(31):e2400260.
doi: 10.1002/advs.202400260. Epub 2024 Jun 19.

A Non-Coding Oligonucleotide Recruits Cutaneous CD11b+ Cells that Inhibit Thelper Responses and Promote Tregs

Affiliations

A Non-Coding Oligonucleotide Recruits Cutaneous CD11b+ Cells that Inhibit Thelper Responses and Promote Tregs

Kahkashan Kamal et al. Adv Sci (Weinh). 2024 Aug.

Abstract

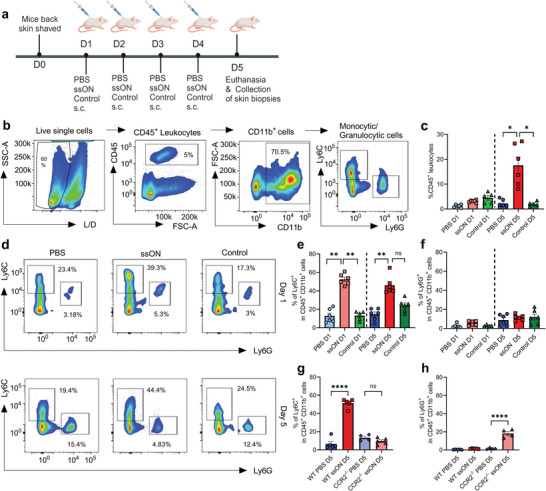
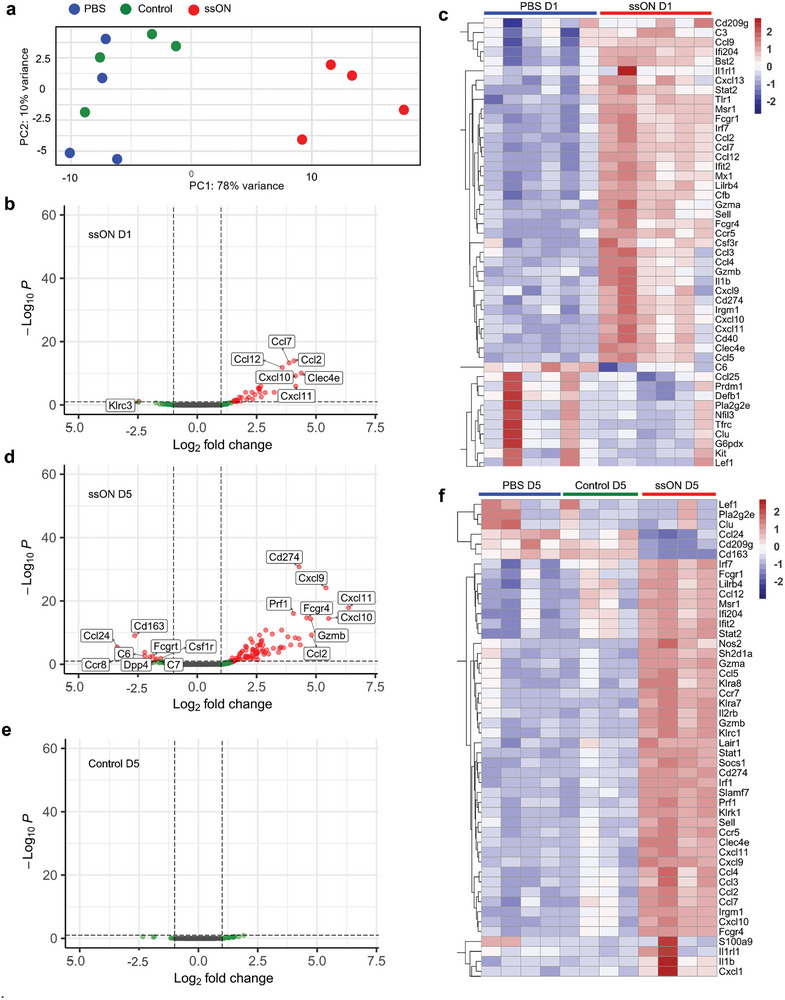
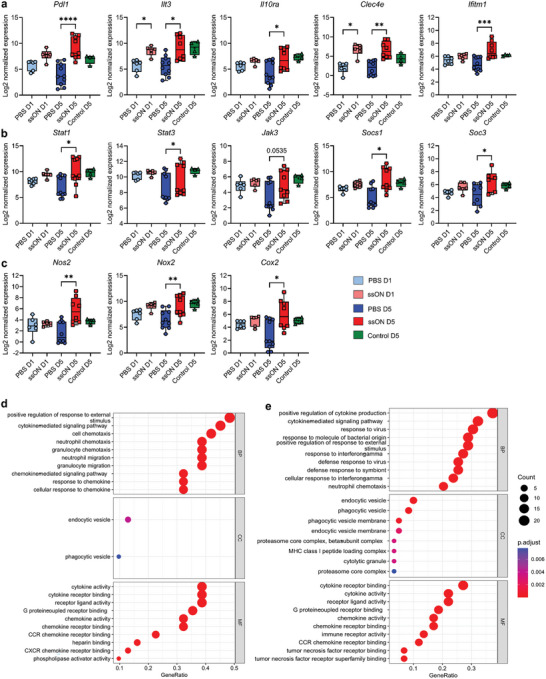
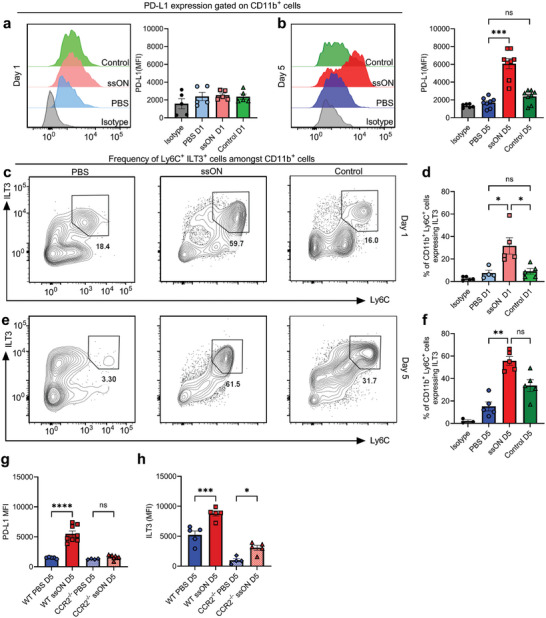
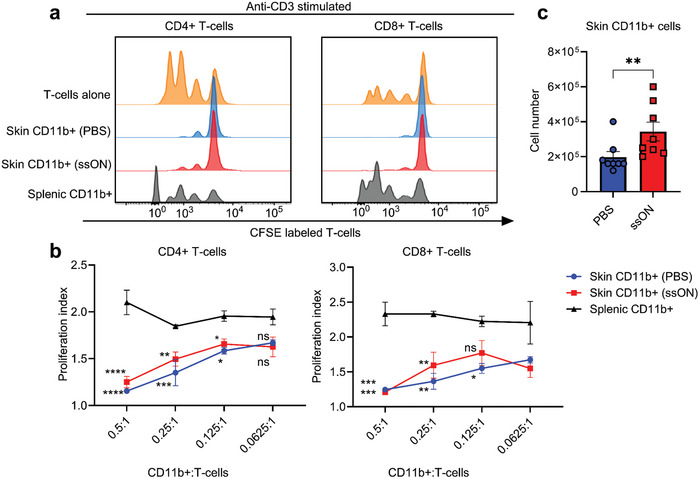
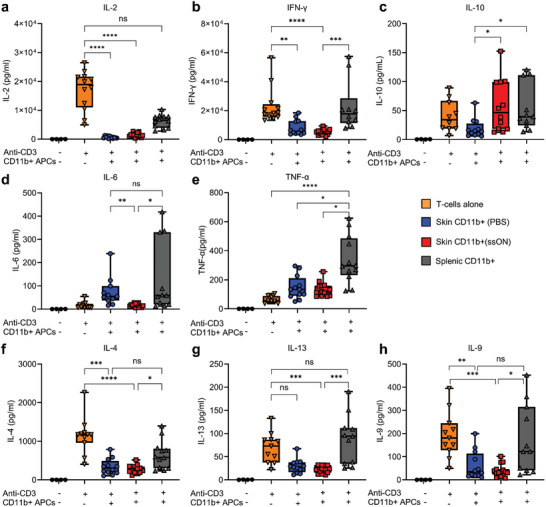
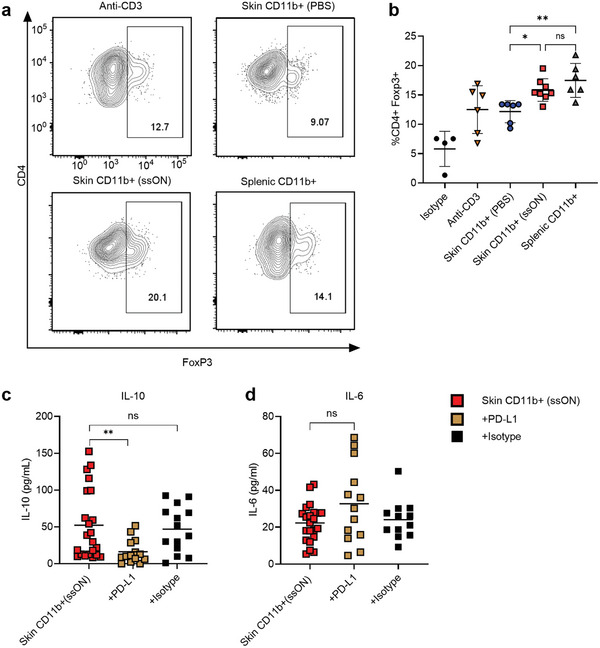
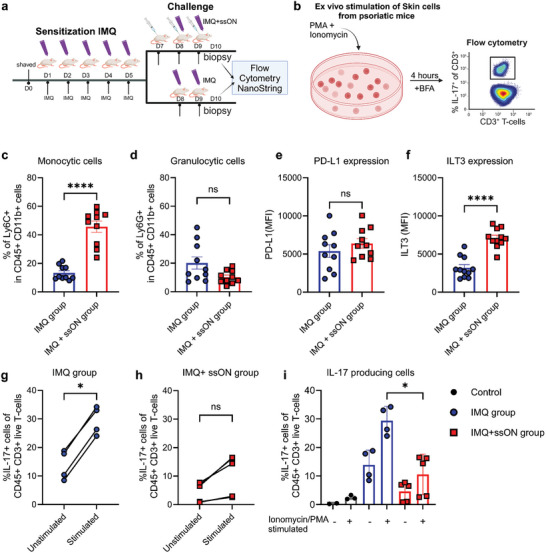
Skin-resident antigen-presenting cells (APC) play an important role in maintaining peripheral tolerance via immune checkpoint proteins and induction of T regulatory cells (Tregs). However, there is a lack of knowledge on how to expand or recruit immunoregulatory cutaneous cells without causing inflammation. Here, it is shown that administration of a non-coding single-stranded oligonucleotide (ssON) leads to CCR2-dependent accumulation of CD45+CD11b+Ly6C+ cells in the skin that express substantial levels of PD-L1 and ILT3. Transcriptomic analyses of skin biopsies reveal the upregulation of key immunosuppressive genes after ssON administration. Functionally, the cutaneous CD11b+ cells inhibit Th1/2/9 responses and promote the induction of CD4+FoxP3+ T-cells. In addition, ssON treatment of imiquimod-induced inflammation results in significantly reduced Th17 responses. It is also shown that induction of IL-10 production in the presence of cutaneous CD11b+ cells isolated after ssON administrations is partly PD-L1 dependent. Altogether, an immunomodulatory ssON is identified that can be used therapeutically to recruit cutaneous CD11b+ cells with the capacity to dampen Th cells.

Keywords: T helper cells; antigen‐presenting cells; cytokines; oligonucleotides; programmed‐death ligand 1; skin.


Conflict of interest statement

A.L.S. and A.D. declare ownership in TIRmed Pharma having IPR related to ssON. K.K., E.A.R., and M.W.H. declares no conflict of interest.

Figures

Figure 1
Figure 1
Accumulation of CD45+CD11b+ cells in the skin after injection with ssON. a) Experimental schedule. Created in BioRender. b) Single‐cell suspensions were prepared by enzymatic digestion and gentle dissociation of skin from the injection site. Gating strategy for the identification of myeloid cells. c) Frequency of CD45+ cells infiltrating the skin D1 and D5. d) Flow cytometry of CD11b+Ly6C+ and CD11b+Ly6G+ in the skin after single or multiple injections. e) Frequencies of CD11b+Ly6C+ and f) CD11b+Ly6G+ cells. g) Frequencies of CD11b+ Ly6C+ cells and h) CD11b+ Ly6G+ in WT and CCR2−/− mice. Statistical significance differences between groups were measured by using the One‐way ANOVA test for non‐parametric and unpaired data (Kruskal Wallis test). Data are mean± SEM. n = 6 per group representative from >3 independent experiments. * p < 0.05, ** p < 0.01, *** p < 0.001.
Figure 2
Figure 2
Transcriptomic analysis of ssON‐treated skin tissue reveals immunomodulatory changes. a) PCA of NanoString immune gene expression data from the skin of mice on D5 after repeated control oligonucleotide, ssON, or PBS injections. b) Volcano plots depicting the DEGs, and c) top 50 significantly up‐ or down‐regulated genes (adjusted P‐value < 0.05) in the skin on D1 after ssON‐treatment. d) Volcano plots showing the DEGs on D5 after ssON treatment and in (e), after injections with control oligonucleotide. The horizontal dotted line represents the threshold adjusted P‐value (<0.05) and the vertical dotted lines represent the threshold Log2fold change set at 1. f) Heatmaps of top 50 significantly up‐ or down‐regulated genes (P‐value < 0.05) in the skin of mice on D5 after ssON‐treatment or control oligonucleotide in comparison with PBS. n = 4–6 per group. Data from D5 is representative of 2 independent experiments.
Figure 3
Figure 3
mRNA expression characteristics of cutaneous myeloid suppressor cell‐associated genes after single or repeated ssON injections. a) Log2 of normalized expression of genes Pdl1, Ilt3, Il10ra, Clec4e, and Ifitm1. b) Stat1, Stat3, Jak3, Socs1, and Socs3. c) Nos2 (iNos), Nox2, and Cox2. d) GO term Analysis of differentially expressed genes showing top enriched pathways corresponding to biological process (BP), cellular component (CC), and molecular function (MF) after treatment with ssON on D1 and e) D5. Statistical non‐parametric analyses were made using the Mann–Whitney test, and multiple comparisons using One‐Way ANOVA (Kruskal–Wallis test). n = 4–10 mice per group. Data representative of 2 experiments on D5. * p < 0.05, ** p < 0.01, *** p < 0.001.
Figure 4
Figure 4
ssON injections result in the upregulation of PD‐L1 and ILT3 on cutaneous CD11b+ cells. a) Expression of PD‐L1 on CD11b+ skin cells on D1 and b) D5. c) Contour plots showing the frequency of Ly6C+ILT3+ cells in cutaneous CD11b+ cells after treatments with PBS, control oligonucleotide or ssON on D1 and e) D5. Frequencies of CD11b+Ly6C+ cells expressing ILT3 on d) D1 and f) D5. g) PD‐L1 and h) ILT3 expression in CD11b+ cells from WT and CCR2−/− murine skin after repeated PBS or ssON injections. Data are mean ±SEM. n = 5 per group representative from >2 independent experiments. Pairwise comparisons were made by non‐parametric Mann‐Whitney test and multiple comparisons were made using non‐parametric One‐way ANOVA (Kruskal Wallis test with Dunn's multiple comparison test). ns non‐significant, * p < 0.05, ** p < 0.01, *** p < 0.001, ****p < 0.0001.
Figure 5
Figure 5
Cutaneous CD11b+ cells inhibit anti‐CD3‐mediated T‐cell proliferation. a) Histograms showing CFSE‐labeled T‐cells undergoing proliferation after anti‐CD3 stimulation in either the absence (orange) or the presence of CD11b+ cells from skin injected with PBS (blue) or ssON (red). The anti‐CD3 stimulated T‐cells were co‐cultured with splenic CD11b+ cells as a control (grey). b) Proliferation indices representing the frequencies of CD4+ and CD8+ T‐cells undergoing division in varying ratios of CD11b+ cells. Cutaneous cells were pooled n = 5 from each group. c) Number of CD11b+ cells obtained D5 from the skin of mice injected with PBS or ssON. The trypan blue method was used to count the cells and each data point represents cell numbers (mean ± SEM) obtained from n = 5 mice in each group. Data from one experiment is shown here out of three independent experiments. Multiple comparisons were made using a two‐way ANOVA test (Tukeys's test). **** p < 0.0001, *** p < 0.001, ** p < 0.01, * p < 0.05, and ns p > 0.05.
Figure 6
Figure 6
CD11b+ cells isolated from ssON‐treated skin promote IL‐10 production. Quantification of cytokines in cell culture supernatants obtained from co‐cultures with cutaneous CD11b+ cells and autologous T‐cells in the presence of anti‐CD3 stimulation. Cytokines levels of a) IL‐2, b) IFN‐γ, c) IL‐10, d) IL‐6, e) TNF‐α, f) IL‐4, g) IL‐13, and h) IL‐9. Data are mean ± SEM from 3 independent experiments, each well was run in duplicates. Comparisons between groups were made using the one‐way ANOVA test using the Kruskal–Wallis test. **** p < 0.0001, *** p < 0.001, ** p < 0.01, * p < 0.05, and ns p > 0.05.
Figure 7
Figure 7
Induction of CD4+FoxP3+ T‐cells and PD‐L1‐dependent IL‐10 production by cutaneous CD11b+ cells after ssON treatment. a) Contour plots representing the intracellular staining of transcription factor FoxP3 in T‐cells derived from cultures as indicated in the presence of anti‐CD3 stimulation. b) Percentage of CD4+FoxP3+ T‐cells among T‐cells stimulated with anti‐CD3 alone, in the presence of CD11b+ cells isolated from the skin after injections with PBS or ssON, or CD11b+ cells from the spleen of BALB/c mice. Multiple comparisons were done using one‐way ANOVA, the Kruskal–Wallis test. c) Displays effects of blocking antibody PD‐L1 or isotype control in ssON‐derived skin CD11b+: T‐cell co‐cultures regarding IL‐10 production and d) IL‐6 production. An outlier was excluded in c using the outlier test (ROUTS method). Pairwise comparisons were made using the non‐parametric Mann–Whitney test. Data are mean + SEM from 3 independent experiments. **** p < 0.0001, *** p < 0.001, ** p < 0.01, * p < 0.05, and ns p > 0.05.
Figure 8
Figure 8
Inhibition of IMQ‐mediated Th17 responses in mice treated with ssON. a) Schematic representation of experimental scheme of IMQ‐induced psoriasis model in mice. Created in BioRender. b) Ex vivo stimulation of skin T‐cells with PMA and ionomycin. Frequency of c) CD11b+Ly6C+ monocytes and d) CD11b+ Ly6G+ granulocytes. Expression of e) PD‐L1 and f) ILT3 in cutaneous CD11b+ cells from IMQ‐treated mice. g) Ex vivo stimulation of skin cells with PMA/ionomycin from IMQ‐induced psoriatic mice and h) IMQ‐induced ssON‐treated mice. i) Comparison between groups. Data are representative of 2 independent experiments, pooled from several mice, n = 5–10 per group. Pairwise comparisons were made using the Mann–Whitney test. ****p < 0.0001, * p < 0.05, and ns p > 0.05.

Similar articles

References

    1. Ou L.‐S., Huang J.‐L., Clin. Rev. Allergy Immunol. 2007, 33, 191. - PubMed
    1. Kolkhir P., Akdis C. A., Akdis M., Bachert C., Bieber T., Canonica G. W., Guttman‐Yassky E., Metz M., Mullol J., Palomares O., Renz H., Ständer S., Zuberbier T., Maurer M., Nat. Rev. Drug Discovery 2023, 22, 743. - PubMed
    1. Brembilla N. C., Boehncke W.‐H., Front. Immunol. 2023, 14, 1186455. - PMC - PubMed
    1. Leung D. Y. M., Jain N., Leo H. L., Curr. Opin. Immunol. 2003, 15, 634. - PubMed
    1. Nicolàs L. S. S., Czarnowicki T., Akdis M., Pujol R. M., Lozano‐Ojalvo D., Leung D. Y. M., Guttman‐Yassky E., Santamaria‐Babí L. F., Allergy 2023, 14, 15. - PubMed

LinkOut - more resources