. 2024 Jun 18;5(6):101610.
doi: 10.1016/j.xcrm.2024.101610.

Microenvironment shapes small-cell lung cancer neuroendocrine states and presents therapeutic opportunities

Affiliations

Microenvironment shapes small-cell lung cancer neuroendocrine states and presents therapeutic opportunities

Parth Desai et al. Cell Rep Med. .

Abstract

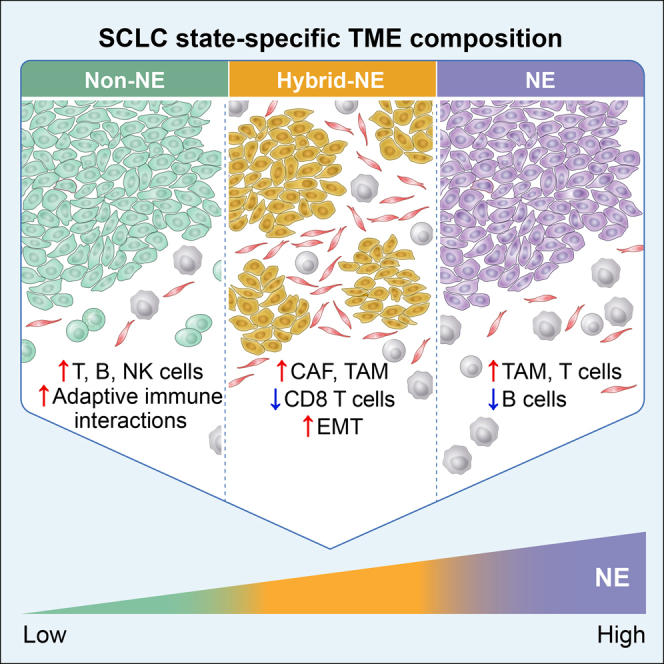
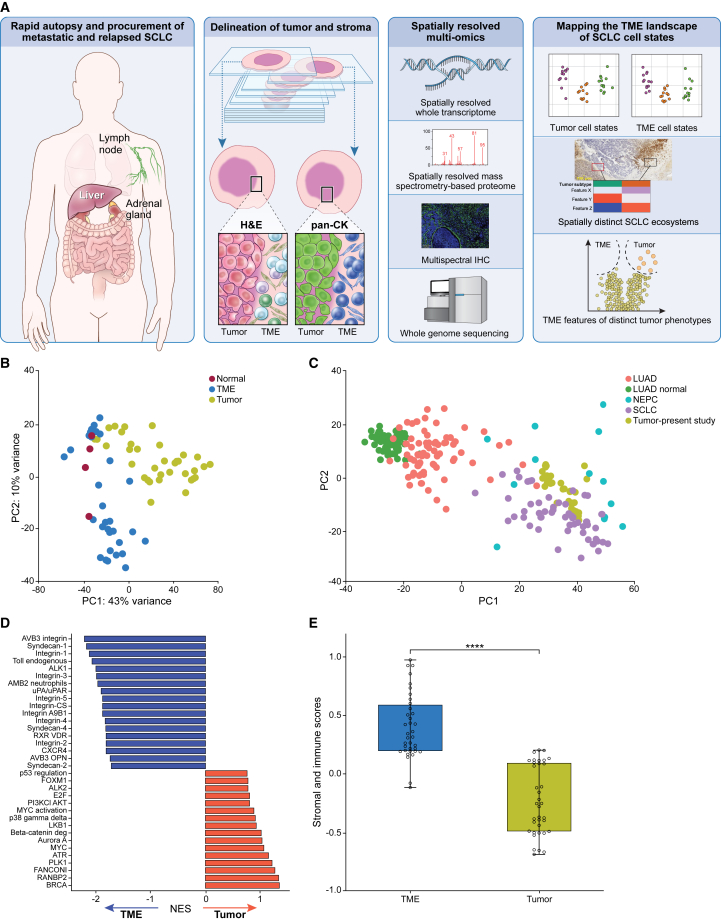
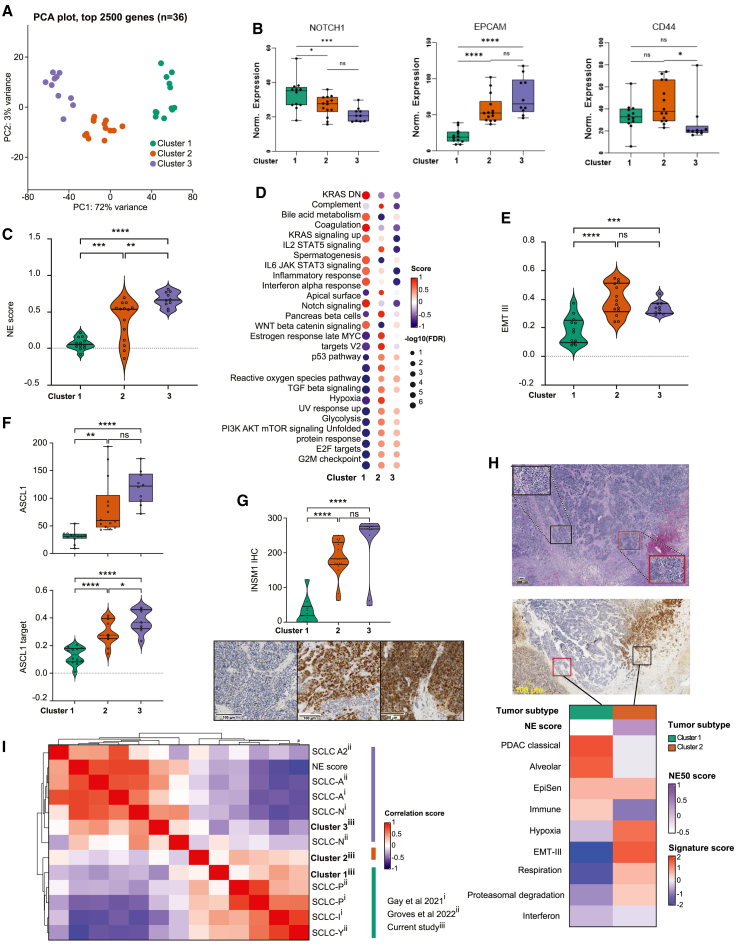
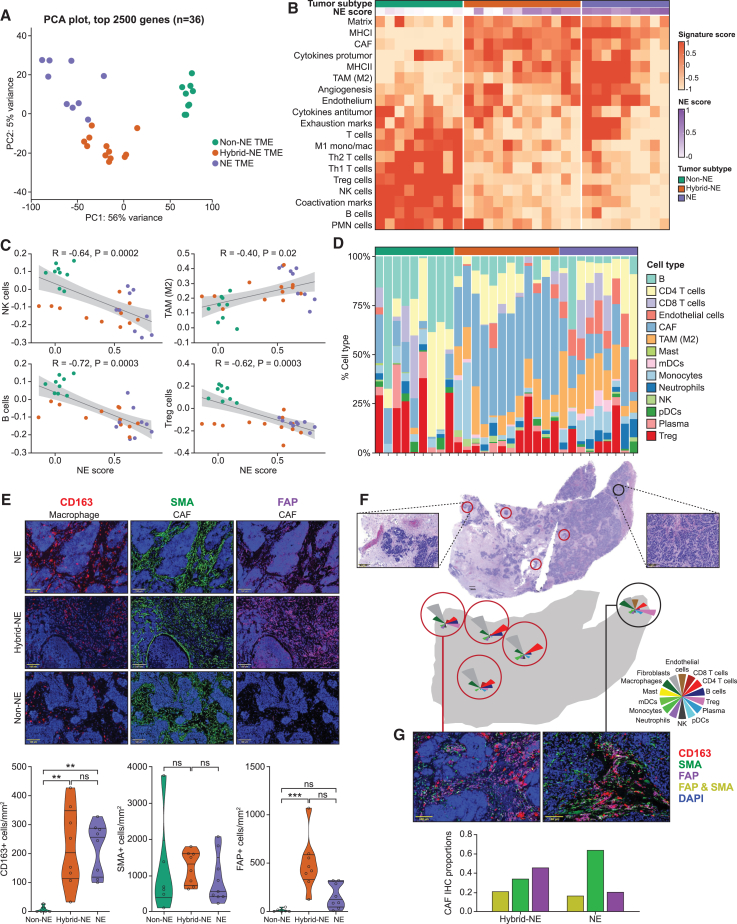
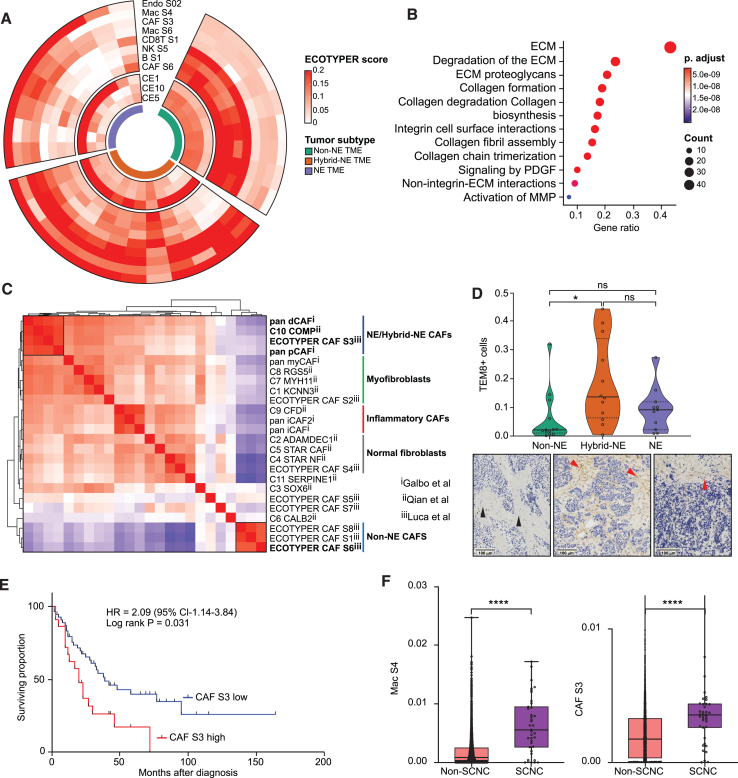
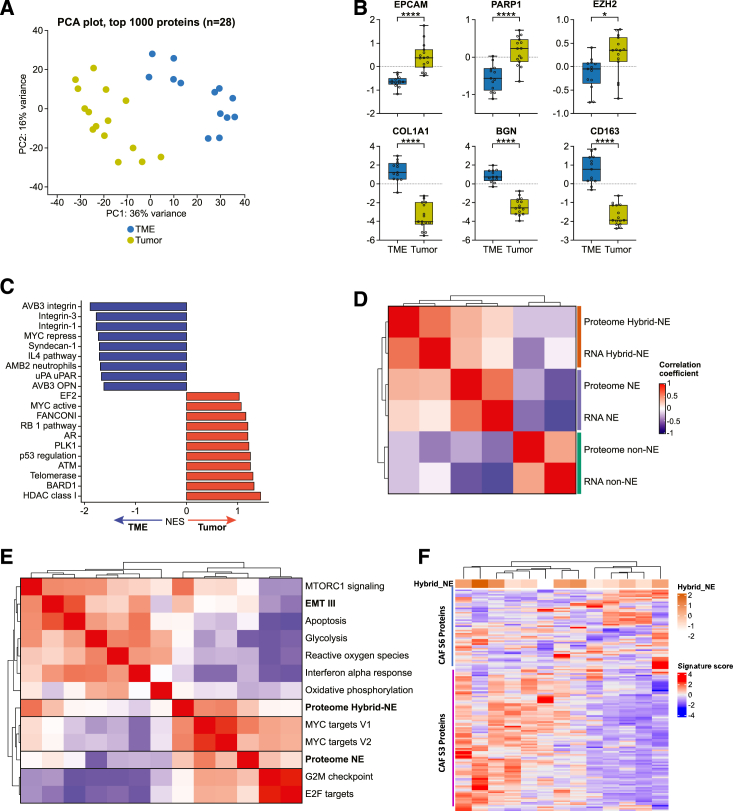
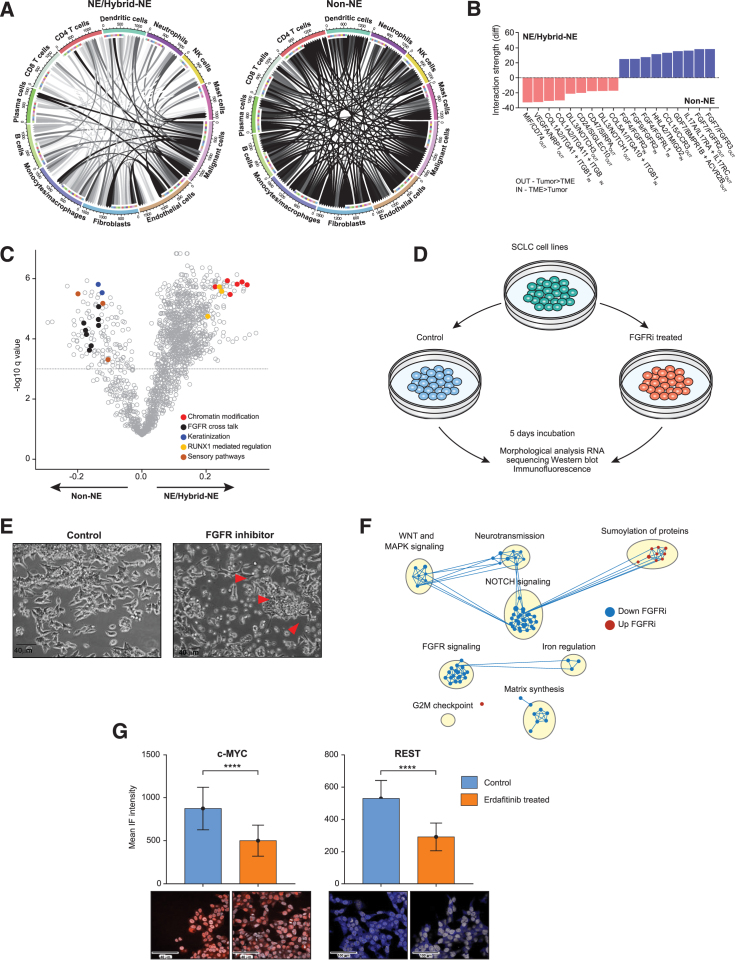
Small-cell lung cancer (SCLC) is the most fatal form of lung cancer. Intratumoral heterogeneity, marked by neuroendocrine (NE) and non-neuroendocrine (non-NE) cell states, defines SCLC, but the cell-extrinsic drivers of SCLC plasticity are poorly understood. To map the landscape of SCLC tumor microenvironment (TME), we apply spatially resolved transcriptomics and quantitative mass spectrometry-based proteomics to metastatic SCLC tumors obtained via rapid autopsy. The phenotype and overall composition of non-malignant cells in the TME exhibit substantial variability, closely mirroring the tumor phenotype, suggesting TME-driven reprogramming of NE cell states. We identify cancer-associated fibroblasts (CAFs) as a crucial element of SCLC TME heterogeneity, contributing to immune exclusion, and predicting exceptionally poor prognosis. Our work provides a comprehensive map of SCLC tumor and TME ecosystems, emphasizing their pivotal role in SCLC's adaptable nature, opening possibilities for reprogramming the TME-tumor communications that shape SCLC tumor states.

Keywords: cancer-associated fibroblasts; intercellular communication; rapid research autopsy; small-cell lung cancer; spatial transcriptomics; tumor heterogeneity; tumor microenvironment.


Conflict of interest statement

Declaration of interests A.T. received grants to NCI from EMD Serono Research & Development, AstraZeneca, Gilead Sciences, and ProLynx during the conduct of the study.

Figures

None
Graphical abstract
Figure 1
Figure 1
Dissection of metastatic and relapsed SCLC using spatial transcriptomics (A) Workflow of SCLC tumor sampling, tissue sectioning, genomics, and spatially resolved transcriptomics and proteomics. (B) PCA of gene expression derived from tumor (n = 36), TME (n = 30), and normal (n = 4) segments, 2,500 genes with highest variance. (C) Projection of tumor segments (n = 36) to PCA performed on lung adenocarcinoma, NEPC, SCLC, and adjacent normal lung gene expression. (D) NES (GSEA) of differentially expressed PID pathways between tumor and TME segments. (E) Stromal and immune score (ssGSEA) computed for TME and tumor segments# Abbreviations: Pan CK, pan-cytokeratin; SCLC, small-cell lung cancer; NEPC, neuroendocrine prostate cancer; LUAD, lung adenocarcinoma; LUAD normal, adjacent normal lung; NES, normalized enrichment score; TME, tumor microenvironment; GSEA, gene set enrichment analysis; ssGSEA, single-sample gene set enrichment analysis; PID, pathway interaction database; ∗∗∗∗ statistical significance at p < 0.0001; # Student’s t test.
Figure 2
Figure 2
Spatial intratumoral heterogeneity of SCLC neuroendocrine differentiation (A) PCA of 2,500 genes with highest variance across tumor segments (n = 36). (B) Normalized expression of Notch1, EPCAM, and CD44 for the three tumor segment clusters#. (C) NE scores across the tumor clusters#. (D) Differentially enriched hallmark pathways (GSEA) across the tumor clusters$. (E) EMT-III (ssGSEA) scores across the tumor clusters#. (F) ASCL1 expression (top, Q3 value) and ASCL1 target scores (bottom, ssGSEA) across the three tumor segment clusters#. (G) INSM1 protein expression across the tumor clusters. H-score ranges from 0 to 300#. (H) Hybrid-NE (red square) and non-NE (black square) regions in morphologically similar and spatially proximate segments of the same tumor (patient #10). H/E, INSM1 IHC, and differentially upregulated cancer metaprograms shown. Medium power (20×), high power (40×) inset. Scale bar at 100 μm. (I) Pairwise correlation of tumor-cluster signatures from current study and previously published SCLC gene signatures,, computed on SCLC tumor transcriptomes (n = 81). Abbreviations: SCLC, small-cell lung carcinoma; PCA, principal-component analysis; ssGSEA, single-sample gene set enrichment analysis; FDR, false discovery rate; EMT, epithelial-mesenchymal transformation; TF, transcription factors; ASCL1, Achaete-scute complex homolog 1; NEUROD1, neuronal differentiation 1; YAP1, yes-associated protein 1; POU2F3, POU class 2 homeobox 3; Q3, third quantile value; UMAP, uniform manifold approximation and projection; NE, neuroendocrine; INSM1, insulinoma-associated protein 1; NES, normalized enrichment score; IHC, immunohistochemistry; KRAS DN, KRAS downregulation; ns, statistically non-significant; H&E,hematoxylin and eosin; ∗statistical significance at p < 0.05; ∗∗statistical significance at p < 0.001; ∗∗∗statistical significance at p < 0.001; ∗∗∗∗statistical significance at p < 0.0001; #Tukey’s multiple comparison test; $FDR correction using Benjamini and Hochberg (BH) method.
Figure 3
Figure 3
Tumor heterogeneity-linked reprogramming of SCLC TME (A) PCA of 5,000 genes with highest variance across the TME segments (n = 30). (B) Pan-cancer TME signatures enriched across the TME subtype segments (n = 30). (C) Correlation between tumor segment NE scores and immune cell (NK cell, TAM, B cell, T-reg) signatures of the spatially proximate TME segment. NE subtypes are indicated in colors (color code as in Figure 3A). (D) Relative proportion of TME non-malignant cell types sorted by NE subtype of the spatially proximate tumor segments (n = 30), estimated using CIBERSORT. (E) Representative single-component multiplex immunofluorescence images showing CD163 (left), SMA (center), and FAP (right) expression across TME subtypes (n = 30). Quantification shown below cells/mm2#. DAPI filter (nuclear stain) is applied on all the images. Scale bar, 100 μm. (F) Heterogeneity across spatially proximate hybrid-NE (n = 4) (red circles) and NE (n = 1) (black circle) TME within tumor from patient #5. Top panel shows bird’s eye view (4× magnification) H&E image of the tumor section with insets highlighting hybrid-NE (left) and NE (right) regions. Bottom panel shows CIBERSORT-derived relative TME cell type abundance. Inset scale bar, 100 μm. (G) Enrichment of FAP+ cells in hybrid-NE TME. Representative (40× magnification) multispectral mIF images of hybrid-NE (left) and NE (right) TME from patient #5 in Figure 3F. Bar plot (below) demonstrating proportion of FAP+ cells, SMA+ cells, and combined FAP and SMA+ cells in hybrid-NE (left) and NE (right) TME regions. DAPI (nuclear) filter is on in all the images. Abbreviations: PCA, principal-component analysis; TME, tumor microenvironment; NE, neuroendocrine; mIF, multiplex immunofluorescence; ns, non-significant; DAPI, 4′,6-diamidino-2-phenylindole; NE, neuroendocrine; FAP, fibroblast activation protein; SMA, smooth muscle actin; TAM, tumor-associated macrophages; T-reg, regulatory T cells; pDC; plasmacytoid dendritic cells; mDC, myeloid dendritic cells; H&E, hematoxylin and eosin; ∗statistical significance at p < 0.05; ∗∗statistical significance at p < 0.01; ∗∗∗statistical significance at p < 0.001; R = Spearman’s correlation co-efficient; #Tukey’s multiple comparison test.
Figure 4
Figure 4
Immunosuppressive CAF cell state enriched in hybrid-NE SCLC (A) Differentially enriched cancer ecotypes and cell states across TME (n = 30) subtypes.. (B) Expression programs enriched in CAF S3. (C) SCLC mesenchymal cells characterized using CAF signatures,, overlayed on scRNA-seq data of mesenchymal cells extracted from the HTAN dataset. Pairwise correlation heatmap of ssGSEA-derived enrichment scores are shown. (D) TEM8 protein expression by IHC (% TEM8-expressing cells) across TME subtypes (n = 30) on sublevel sections of tumors profiled using spatially resolved transcriptomics%. Representative images (below) showing absence of TEM8 expression in non-NE TME (black arrows) and membranous and cytoplasmic expression in hybrid-NE and NE TME (red arrows). Color codes as for Figure 6A. Scale bar set at 100 μm. Also see Figure S4E. (E) Kaplan-Meier curves showing survival (months) of patients with SCLC (n = 81) with high and low CAF S3 expression (cutoff at 75% percentile). (F) Enrichment of CAF S3 (right) and Mac S4 (left) in SCNC pan-cancer.# Abbreviations: SCLC, small-cell lung cancer; TME, tumor microenvironment; ST, spatial transcriptomics; Endo, endothelial; CAF, cancer-associated fibroblasts; Mac, monocytes/macrophages; ssGSEA, single-sample gene set enrichment; SCNC, small-cell neuroendocrine carcinoma; OS, overall survival; HR, hazards ratio; CI, confidence interval; IHC, immunohistochemistry; TEM8, tumor endothelial marker 8; ECM, extracellular matrix; MMP, matrix-metalloproteinases; PDGF, platelet-derived growth factor; Diff, difference; ∗statistical significance at p < 0.05, ∗∗∗∗ statistical significance at p < 0.0001; % Tukey’s multiple comparison test; # Student’s t test.
Figure 5
Figure 5
Proteomic characterization of tumor heterogeneity-linked reprogramming of SCLC TME (A) PCA of 1,000 proteins with highest variance between tumor (n = 15) and TME (n = 13). (B) Distribution of tumor (above) and TME (below)-associated proteins#. (C) NES (GSEA) of differentially expressed pathways between tumor and TME. (D) Tumor transcript-protein correlation for NE and hybrid-NE subtypes. Pairwise correlation of matched tumor proteome and bulk RNA-seq (n = 12) derived NE, non-NE, and hybrid-NE signature scores. (E) Pairwise correlation of tumor proteome-derived NE and hybrid-NE signatures with selected hallmark pathways (ssGSEA). (F) Heatmap showing CAF S3 and CAF S6 proteins enrichment in TME proteome and their association with hybrid-NE signatures of corresponding tumor proteome. Abbreviations: SCLC, small-cell lung cancer; BGN, biglycan; EZH2, enhancer of zeste homolog 2; MS, mass spectrometry; PCA, principal-component analysis; GSEA, gene set enrichment analysis; TME, tumor microenvironment; ssGSEA, single-sample GSEA; NE, neuroendocrine; ns, non-significant at p < 0.05; ∗statistical significance p < 0.05; ∗∗∗∗ statistical significance at p < 0.0001; # Student’s t test.
Figure 6
Figure 6
SCLC cell states modulated by FGFR inhibition (A) Intercellular tumor-TME interactions, of NE/hybrid-NE (left) and non-NE tumor-TME (right) ecosystems. (B) Differentially over-represented ligand-receptor interactions in NE/hybrid-NE and non-NE tumor ecosystems. Directionality of interaction specified for each pair as in (TME> tumor) and out (tumor>TME). (C) Differentially enriched expression programs (ssGSEA) between non-NE and NE/hybrid-NE TMEs. Recurrent and SCLC-relevant programs are highlighted. (D) Workflow of FGFR inhibition in SCLC cell lines using pan-FGFR inhibitor erdafitinib. (E) DMS-273 cell line treated with FGFR inhibitor (erdafitinib, 33.33 nM). Representative microscopic images (40× magnification) of untreated (left) and treated cells (right). Red arrows showing cells in suspension state. (F) Pathways altered following treatment of DMS-273 with FGFR inhibitor (erdafitinib, 33.33 nM). Network enrichment plot of GSEA is shown. Blue dots indicate pathways downregulated, and red dots indicate upregulated pathways compared with control cells. (G) c-Myc (left) and REST (right) mean IF intensity following treatment of DMS-273 with FGFR inhibitor (erdafitinib, 33.33 nM). % Abbreviations: FGF8, fibroblast growth factor 8; RNA ISH, ribonucleic acid in situ hybridization; FGFR, fibroblast growth factor receptor; ssGSEA, single-sample gene set enrichment analysis; NE, neuroendocrine; nM/L, nanomoles/liter; IF, immunofluorescence; ∗∗p < 0.01; ∗∗∗∗p < 0.0001; ns, not significant; R, Spearman’s correlation co-efficient; #Tukey’s multiple comparison test; % Student’s t test.

Similar articles

Cited by

References

    1. McGranahan N., Swanton C. Clonal Heterogeneity and Tumor Evolution: Past, Present, and the Future. Cell. 2017;168:613–628. doi: 10.1016/j.cell.2017.01.018. - DOI - PubMed
    1. Gupta P.B., Pastushenko I., Skibinski A., Blanpain C., Kuperwasser C. Phenotypic Plasticity: Driver of Cancer Initiation, Progression, and Therapy Resistance. Cell Stem Cell. 2019;24:65–78. doi: 10.1016/j.stem.2018.11.011. - DOI - PMC - PubMed
    1. Boumahdi S., de Sauvage F.J. The great escape: tumour cell plasticity in resistance to targeted therapy. Nat. Rev. Drug Discov. 2020;19:39–56. doi: 10.1038/s41573-019-0044-1. - DOI - PubMed
    1. Rudin C.M., Brambilla E., Faivre-Finn C., Sage J. Small-cell lung cancer. Nat. Rev. Dis. Prim. 2021;7:3. doi: 10.1038/s41572-020-00235-0. - DOI - PMC - PubMed
    1. George J., Lim J.S., Jang S.J., Cun Y., Ozretić L., Kong G., Leenders F., Lu X., Fernández-Cuesta L., Bosco G., et al. Comprehensive genomic profiles of small cell lung cancer. Nature. 2015;524:47–53. doi: 10.1038/nature14664. - DOI - PMC - PubMed

MeSH terms