. 2024 Jul 25;187(15):4078-4094.e21.
doi: 10.1016/j.cell.2024.05.038. Epub 2024 Jun 18.

Therapeutic potential of co-signaling receptor modulation in hepatitis B

Affiliations

Therapeutic potential of co-signaling receptor modulation in hepatitis B

Francesco Andreata et al. Cell. .

Abstract

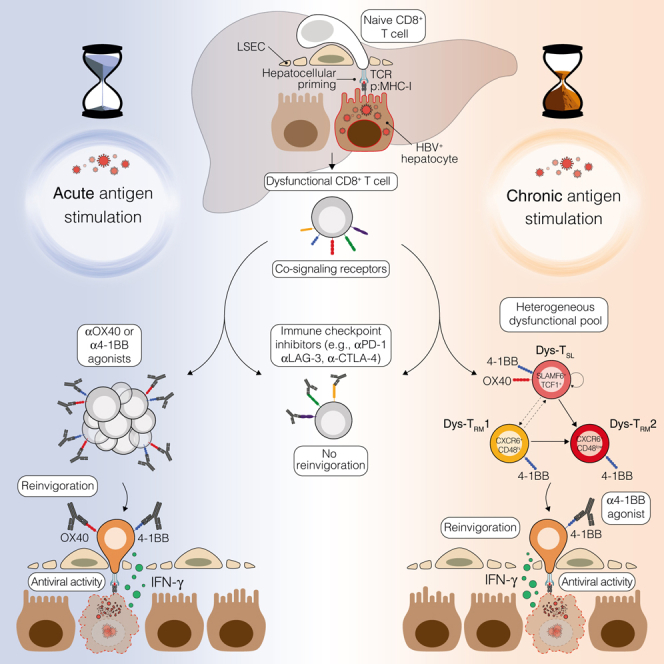
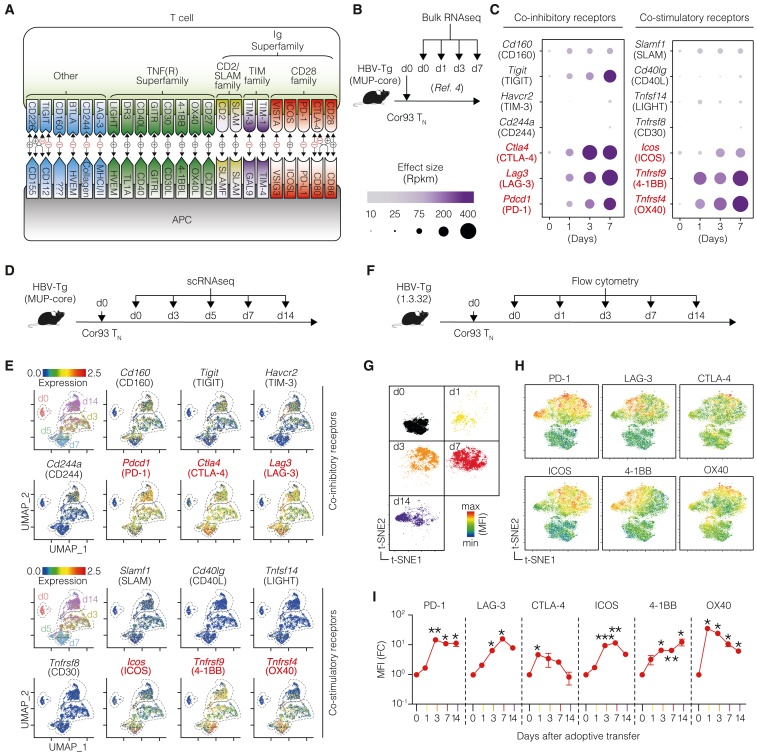
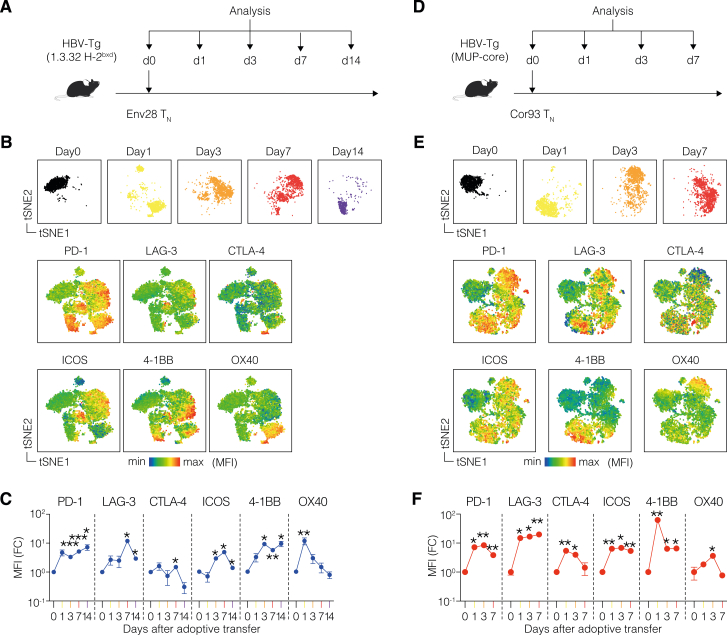
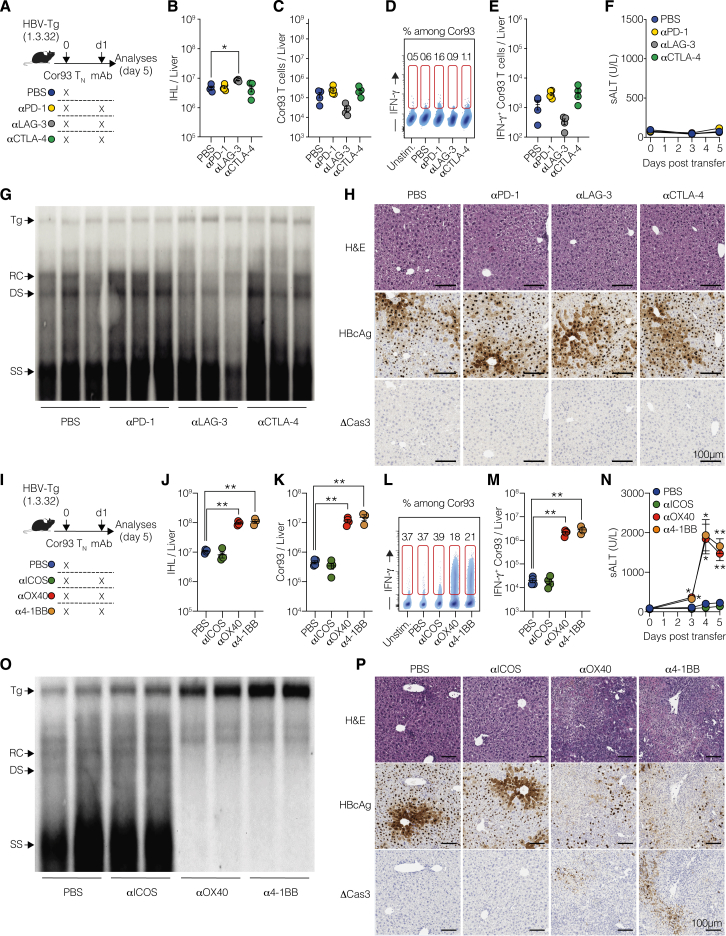
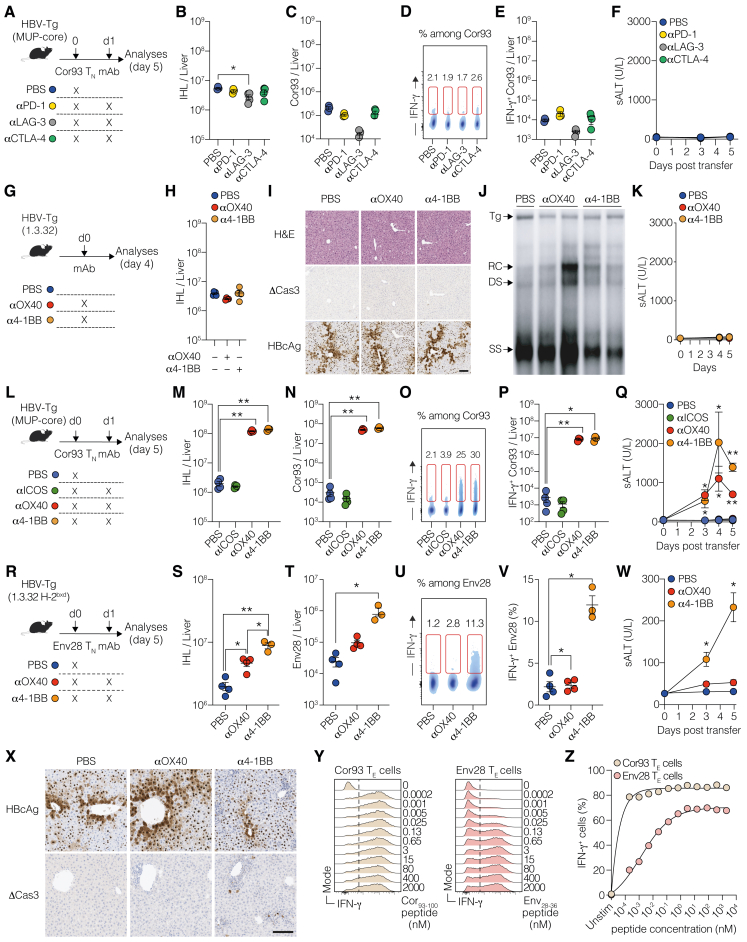
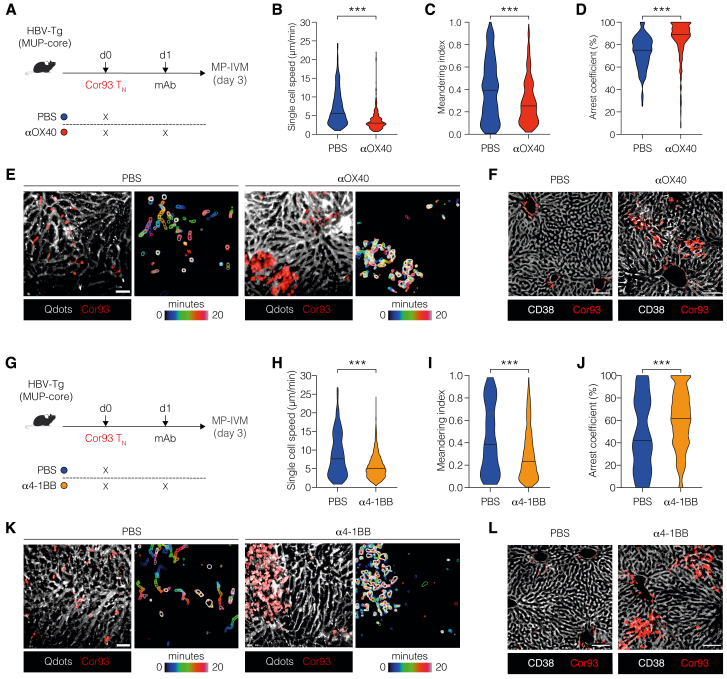
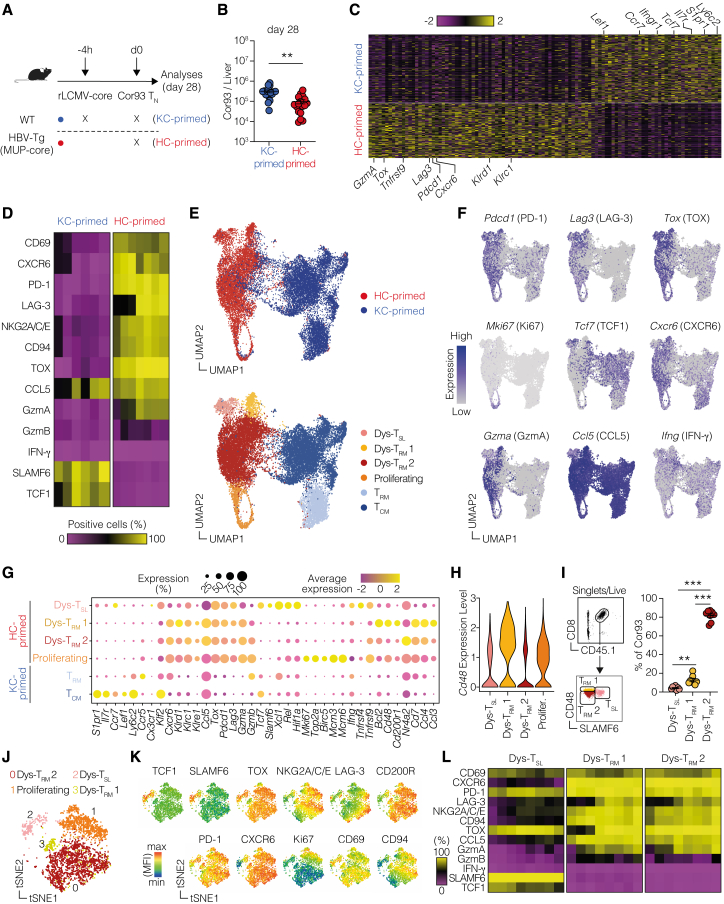
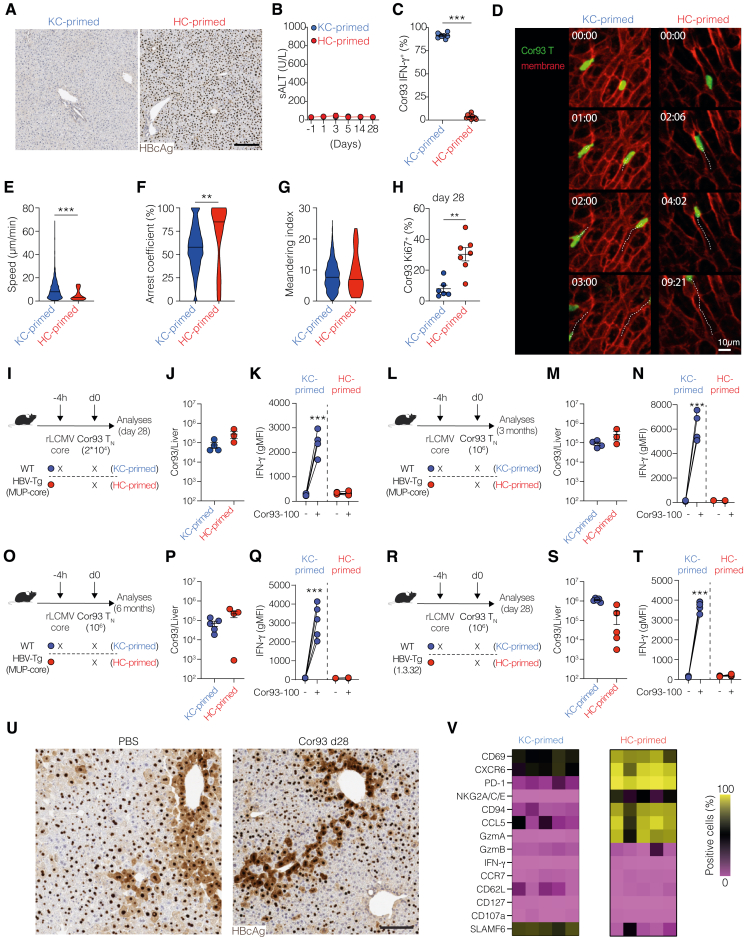
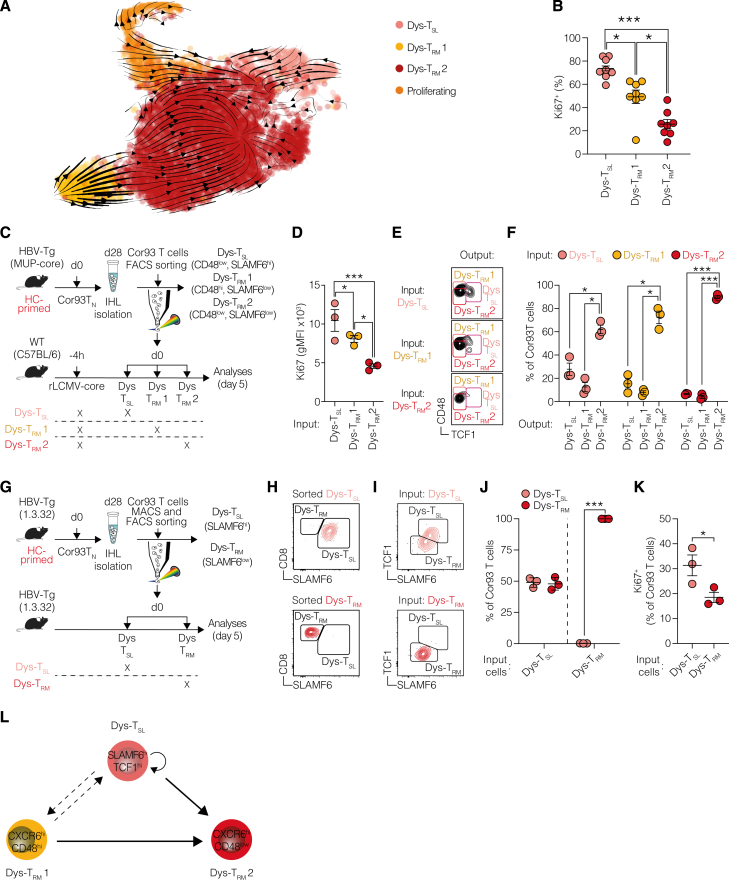
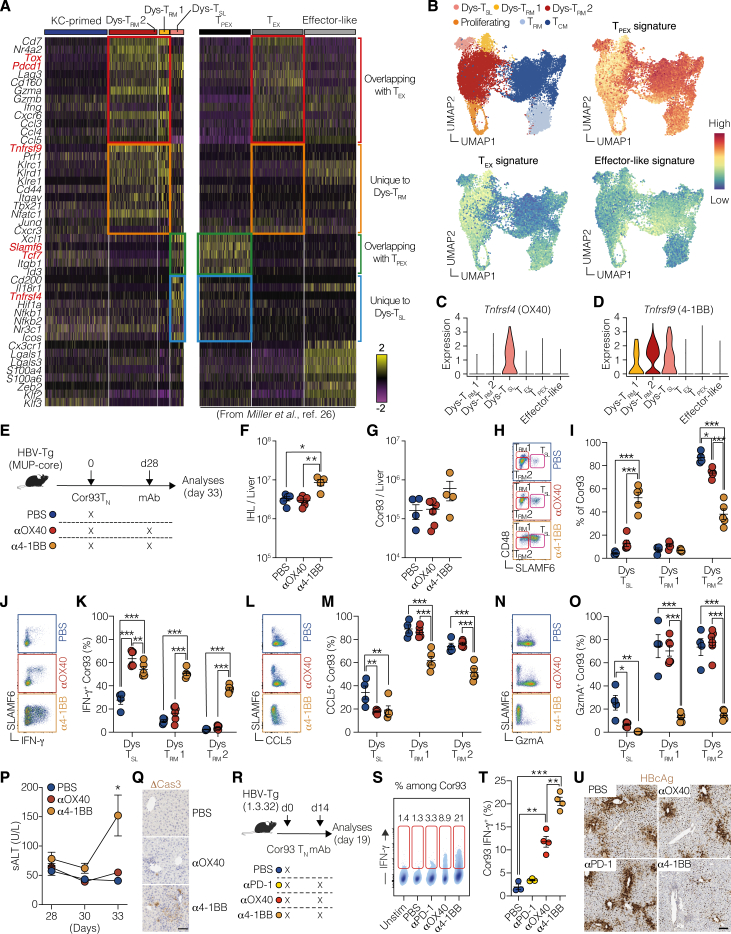
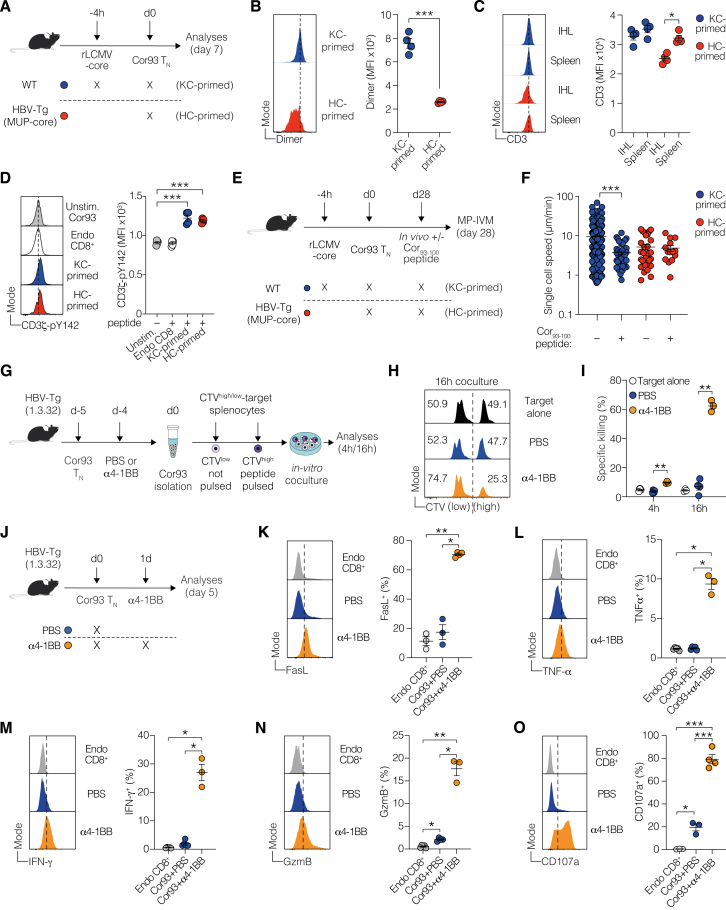
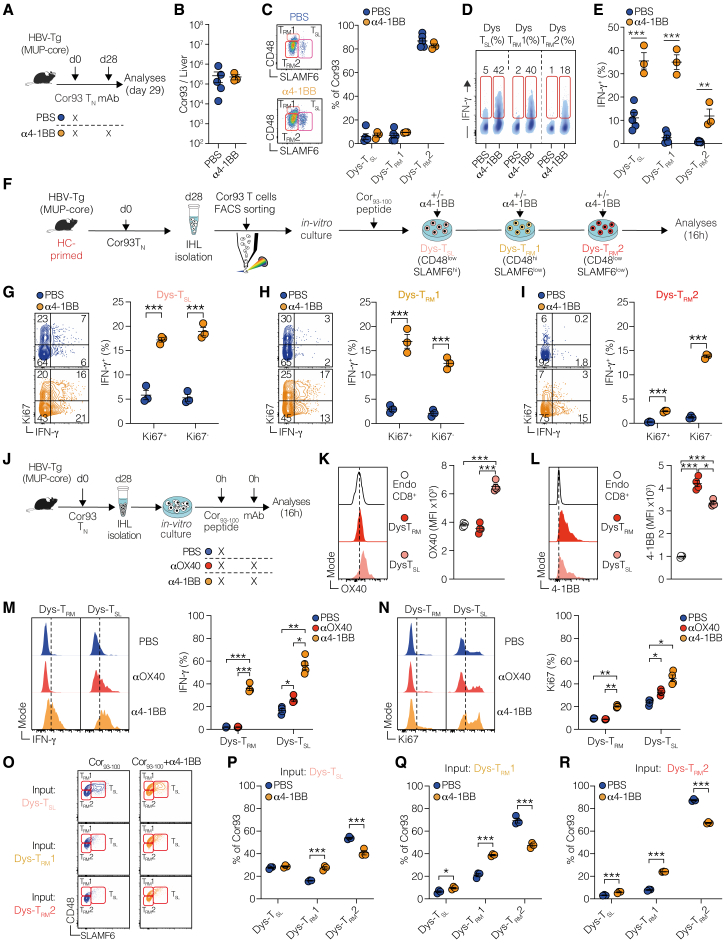
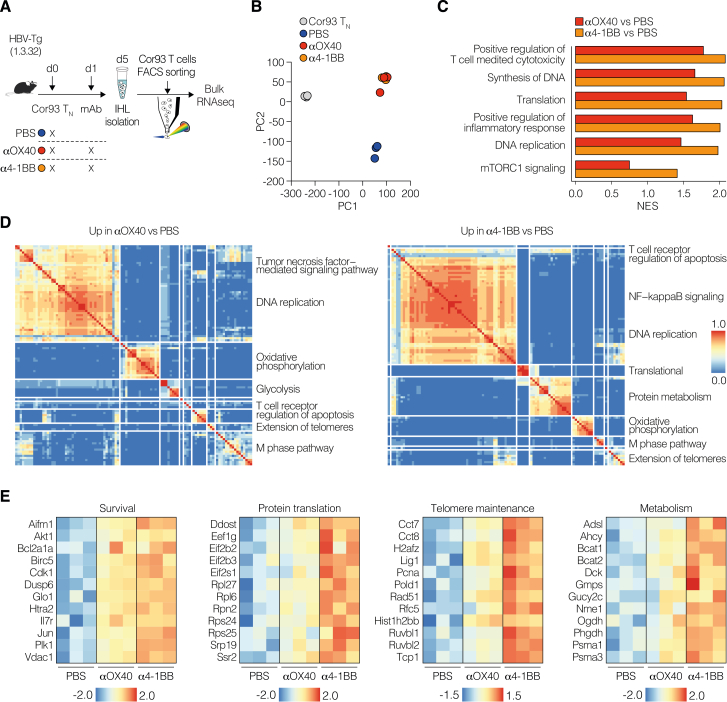
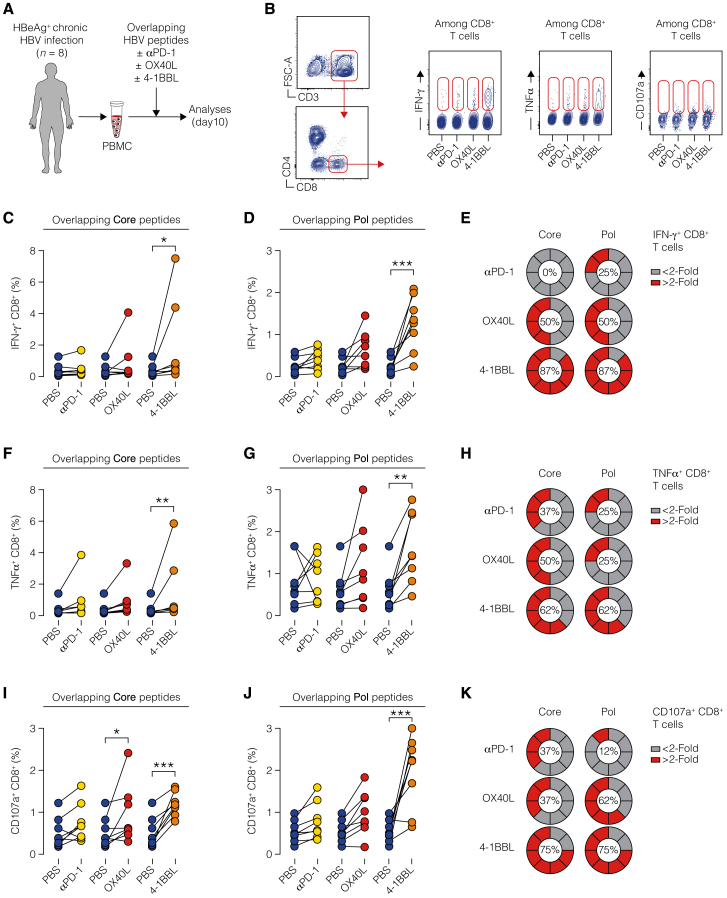
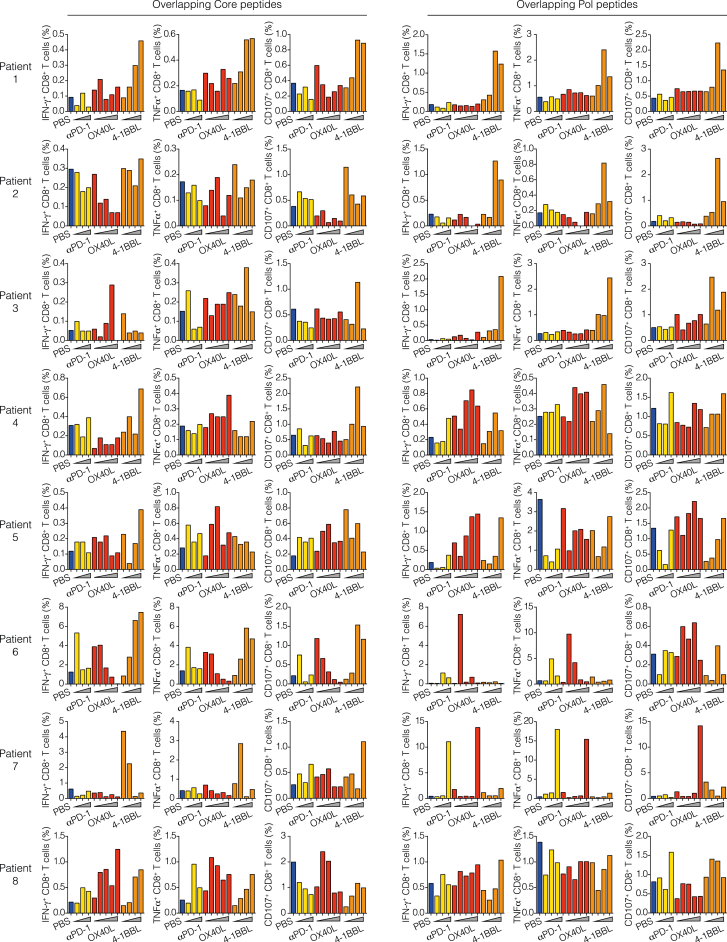
Reversing CD8+ T cell dysfunction is crucial in treating chronic hepatitis B virus (HBV) infection, yet specific molecular targets remain unclear. Our study analyzed co-signaling receptors during hepatocellular priming and traced the trajectory and fate of dysfunctional HBV-specific CD8+ T cells. Early on, these cells upregulate PD-1, CTLA-4, LAG-3, OX40, 4-1BB, and ICOS. While blocking co-inhibitory receptors had minimal effect, activating 4-1BB and OX40 converted them into antiviral effectors. Prolonged stimulation led to a self-renewing, long-lived, heterogeneous population with a unique transcriptional profile. This includes dysfunctional progenitor/stem-like (TSL) cells and two distinct dysfunctional tissue-resident memory (TRM) populations. While 4-1BB expression is ubiquitously maintained, OX40 expression is limited to TSL. In chronic settings, only 4-1BB stimulation conferred antiviral activity. In HBeAg+ chronic patients, 4-1BB activation showed the highest potential to rejuvenate dysfunctional CD8+ T cells. Targeting all dysfunctional T cells, rather than only stem-like precursors, holds promise for treating chronic HBV infection.

Keywords: 4-1BB; CD8(+) T cells; OX40; T cell dysfunction; chronic viral infection; hepatitis B virus; immunotherapy; liver.


Conflict of interest statement

Declaration of interests M. Iannacone participates in advisory boards/consultantship for Asher Biotherapeutics, GentiBio, BlueJay Therapeutics, and Aligos Therapeutics. L.G.G. participates in boards/consultantship for Genenta Science, Epsilen Bio, Aligos Therapeutics, Medicxi, Chroma Medicine, and Ananda Immunotherapies.

Figures

None
Graphical abstract
Figure 1
Figure 1
Immune co-signaling landscape of HBV-specific dysfunctional CD8+ T cells uncovers targets for therapeutic intervention (A) Schematic representation of co-signaling molecules. (B) Experimental setup. Naive Cor93 T cells (Cor93 TN) were transferred into HBV-transgenic (HBV-Tg, lineage MUP-core) recipients. At the indicated time points, Cor93 T cells were sorted from the livers and processed for bulk RNA-seq. From Bénéchet et al. (C) Bubble plot of the upregulated co-inhibitory (left) and co-stimulatory (right) genes expressed by Cor93 T cells upon hepatocellular priming. Data are displayed according to the time point of analysis and represent normalized expression using bubble size and a color scale ranging from low (gray) to high (purple). (D) Experimental setup. (E) Uniform manifold approximation and projection (UMAP) representation of sorted cells (top left). Each dot corresponds to a single cell, and cells belonging to the same time point are encircled by dotted lines. Feature plots showing the expression of the most upregulated co-signaling receptor genes modulated after hepatocellular priming. (F) Experimental setup. (G and H) t-Distributed stochastic neighbor embedding (t-SNE) analysis clustered according to the time point (G) and showing the expression of the indicated co-signaling receptors (H) in Cor93 T cells. (I) Mean fluorescence intensity (MFI) fold change (FC) of the indicated markers at the indicated time points compared with day 0. n = 3 per time point; two-way ANOVA test with Geisser-Greenhouse correction. Statistical significance compared with day 0 is shown. See also Figure S1.
Figure S1
Figure S1
Analysis of co-signaling receptors induced in CD8+ T cells upon hepatocellular priming, related to Figure 1 (A) Experimental setup. 106 naive Env28 CD8+ T cells (Env28 TN) were adoptively transferred into HBV replication-competent transgenic mice (lineage 1.3.32; background C57BL/6 × BALB/c H-2bxd hybrids) mice. At the indicated time points, intrahepatic leukocytes were isolated and processed for multicolor flow cytometry. n = 3–4 per group. (B) t-Distributed stochastic neighbor embedding (t-SNE) analysis of Env28 T cells (gates as live/CD90.1+/CD8+ cells) showing expression of selected co-signaling receptors at the indicated time point upon T cell transfer. (C) Mean fluorescence intensity (MFI) of the indicated co-signaling receptors at the indicated time points after T cell transfer expressed as fold change (FC) relative to day 0. (D) Experimental setup. 106 naive Cor93 T cells (Cor93 TN) were adoptively transferred into HBV-Tg mice (lineage MUP-core). At the indicated time points, intrahepatic leukocytes were isolated and processed for multicolor flow cytometry. n = 3 per group. (E) t-SNE analysis of Cor93 T cells (gated as live/CD45.1+/CD8+ cells) showing expression of selected co-signaling receptors at the indicated time point upon T cell transfer. (F) MFI of the indicated co-signaling receptors at the indicated time points after T cell transfer expressed as fold change (FC) relative to day 0. For (C) and (F), two-way ANOVA test with Geisser-Greenhouse correction. Statistical significance compared with day 0 is shown.
Figure 2
Figure 2
Intrahepatically primed, dysfunctional CD8+ T cells are unresponsive to co-inhibitory receptor blockade but can be revived by OX40 and 4-1BB agonism (A) Experimental setup. (B) Numbers of IHL isolated from the indicated mice. (C) Numbers of Cor93 T cells in the livers of the indicated mice. (D) Representative plots of IFN-γ expression among Cor93 T cells in the liver of the indicated mice. (E) Number of IFN-γ-producing Cor93 T cells in the livers of the indicated mice upon ex vivo cognate peptide stimulation. n = 4–5; one-way Brown-Forsythe and Welch ANOVA test with Dunnett correction. Each group was compared with PBS-injected controls. (F) Serum alanine transaminases (sALTs) of the indicated groups of mice at the indicated time points. (G) HBV DNA quantification by southern blot analysis of liver lysates from the indicated mice. Bands corresponding to the size of the integrated transgene (Tg), relaxed circular (RC), double-stranded (DS) linear, and single-stranded (SS) HBV DNAs are indicated. (H) Representative micrographs of liver sections from the indicated groups of mice. Upper panels show hematoxylin-eosin (H&E) staining, middle panels show staining for HBcAg, and lower panels show staining for cleaved caspase 3 (ΔCas3). Scale bars represent 100 μm. (I) Experimental setup. (J) Numbers of IHL isolated from the indicated mice. (K) Numbers of Cor93 T cells isolated from the liver of the indicated mice. (L) Representative plots of IFN-γ expression among Cor93 T cells in the liver of the indicated mice. (M) Number of IFN-γ-producing Cor93 T cells in the livers of the indicated mice upon ex vivo cognate peptide stimulation. n = 4–5; one-way Brown-Forsythe and Welch ANOVA test with Dunnett correction. Each group was compared with PBS-injected controls. (N) sALT of the indicated group of mice at the indicated time points. n = 4–5; two-way ANOVA test with Dunnett correction. Each group was compared with PBS-injected controls. (O) HBV DNA quantification by southern blot analysis of liver lysates from the indicated mice. (P) Representative micrographs of liver sections from the indicated groups of mice with the indicated stainings. Scale bars represent 100 μm. See also Figures S2 and S3.
Figure S2
Figure S2
Validation of co-signaling receptor modulation in independent mouse models, related to Figure 2 (A) Experimental setup. 106 naive Cor93 T (Cor93 TN) cells were adoptively transferred into HBV-Tg mice (lineage MUP-core). 24 h later, indicated groups of mice were injected intraperitoneally with PBS or 100 μg of monoclonal antibodies (mAbs) blocking PD-1, LAG-3, or CTLA-4. Livers were collected and analyzed at day 5. (B) Total numbers of intrahepatic leukocytes (IHLs) isolated from the indicated mice. (C) Total numbers of Cor93 T cells in the livers of the indicated mice. (D) Representative density plots of IFN-γ expression among Cor93 T cells in the liver of the indicated mice. Numbers represent the percentage of cells within the indicated gates. (E) Total number of IFN-γ-producing Cor93 T cells in the livers of the indicated mice upon ex vivo cognate peptide stimulation. n = 3–4; one-way Brown-Forsythe and Welch ANOVA test with Dunnett correction. Each group was compared with PBS-injected controls. (F) Amount of serum alanine transaminases (sALTs) in the serum of the indicated groups of mice at the indicated time points. (G) Experimental setup. HBV replication-competent transgenic mice (lineage 1.3.32) were injected intraperitoneally with PBS or with 100 μg of agonist mAbs activating OX40 or 4-1BB. Livers were collected and analyzed at day 4. (H) Total numbers of IHL isolated from the indicated mice. (I) Representative micrographs of liver sections from the indicated groups of mice. The upper panels show hematoxylin-eosin (H&E) staining, the middle panels show immunohistochemical staining for cleaved caspase 3 (ΔCas3, brown), and the lower panels show immunohistochemical staining for HBcAg (brown). Scale bar represents 100 μm. (J) HBV DNA quantification by southern blot analysis of liver lysates from the indicated mice. Bands corresponding to the expected size of the integrated transgene (Tg), relaxed circular (RC), double-stranded (DS) linear, and single-stranded (SS) HBV DNAs are indicated. (K) Amount of sALT in the serum of the indicated groups of mice at the indicated time points. (L) Experimental setup. 106 Cor93 TN cells were adoptively transferred into HBV-Tg mice (lineage MUP-core). 24 h later, selected groups of mice were injected intraperitoneally with PBS or 100 μg of mAbs activating ICOS, OX40, or 4-1BB. Livers were collected and analyzed at day 5. (M) Total numbers of IHL isolated from the indicated mice. (N) Numbers of Cor93 T cells isolated from the liver of the indicated mice. (O) Representative density plots of IFN-γ expression among Cor93 T cells in the liver of the indicated mice. (P) Total number of IFN-γ-producing Cor93 T cells in the livers of the indicated mice upon ex vivo cognate peptide stimulation. n = 3–4; one-way Brown-Forsythe and Welch ANOVA test with Dunnett correction for multiple comparisons. Each group was compared with control. (Q) Amount of sALT in the serum of the indicated group of mice at the indicated time points. n = 3–4; two-way ANOVA test with Dunnett correction for multiple comparisons. Each group was compared with control group (simple effect within row). (R) Experimental setup. 106 naive Env28 CD8+ TCR transgenic cells (Env28 TN) were adoptively transferred into HBV replication-competent transgenic mice (lineage 1.3.32; background C57BL/6 × BALB/c H-2bxd hybrids). 24 h later, selected groups of mice were injected intraperitoneally with PBS or 100 μg of mAbs activating OX40 or 4-1BB. Livers were collected and analyzed at day 5. (S) Numbers of IHL isolated from the indicated mice. (T) Numbers of Env28 T cells isolated from the liver of the indicated mice. (U) Representative density plots of IFN-γ expression among Env28 T cells in the liver of the indicated mice. (V) Percentages of IFN-γ-producing Env28 T cells in the livers of the indicated mice upon ex vivo cognate peptide stimulation. n = 3–4; one-way Brown-Forsythe and Welch ANOVA test with Dunnett correction. Each group was compared with PBS-injected controls. (W) Amount of sALT in the serum of the indicated groups of mice at the indicated time points. n = 3–4; two-way ANOVA test with Dunnett correction for multiple comparisons. Each group was compared with PBS-injected controls (simple effect within row). (X) Representative micrographs of liver sections from the indicated groups of mice. The upper panels show staining for HBcAg, and the lower panels show staining for cleaved caspase 3 (ΔCas3). Scale bar represents 100 μm. (Y and Z) Representative histograms (Y) and percentages (Z) of in vitro differentiated Cor93 T effector (Cor93 TE) or Env28 T effector (Env28 TE) cells producing IFN-γ upon cognate in vitro peptide stimulation at the indicated concentrations. Results are representative of two independent experiments giving similar results.
Figure S3
Figure S3
Spatiotemporal dynamics of HBV-specific CD8+ T cells upon 4-1BB and OX40 activation, related to Figure 2 (A) Experimental setup. 106 fluorescent naive Cor93 T (Cor93 TN) cells were adoptively transferred into HBV-Tg mice (lineage MUP-core). 24 h later, selected group of mice were injected intraperitoneally with 100 μg of monoclonal agonist antibody against OX40. 2 days later, mice were injected with Qtracker quantum dots (Qdots) to visualize blood vessels, and the dynamics of Cor93 T cells were assessed by multiphoton intravital microscopy (MP-IVM). (B–D) Quantitative analyses of Cor93 T cell behavior in the mouse liver. Single-cell speed (B), meandering index (C), and arrest coefficient (D, calculated for a threshold of 3 μm/min). Mann-Whitney test. (E) Representative time-lapse images (left) showing Cor93 T cells (red) and sinusoids (white) in PBS-injected controls or αOX40-treated mice. Scale bar represents 50 μm. Time-color coding is used to superimpose frames, providing a visualization of cell movement over time, with the outlines of the cells clearly delineated (right). (F) Representative confocal micrograph of the liver of the indicated mice 3 days after T cell transfer. Sinusoids are stained with anti-CD38 Abs (white), while Cor93 T cells are depicted in red. Scale bars represent 100 μm. (G) 106 fluorescent Cor93 TN were adoptively transferred into HBV-Tg mice (lineage MUP-core). 24 h later, selected group of mice were injected intraperitoneally with 100 μg of monoclonal agonist antibodies against 4-1BB. 2 days later, mice were injected with Qtracker quantum dots (Qdots) to visualize blood vessels, and the dynamics of Cor93 T cells were assessed by MP-IVM. (H–J) Quantitative analyses of Cor93 T cell behavior in the mouse liver. Single-cell speed (H), meandering index (I), and arrest coefficient (J, calculated for a threshold of 3 μm/min). Two-tailed Mann-Whitney test. (K) Representative time-lapse images (left) showing Cor93 T cells (red) and sinusoids (white) in PBS-injected controls or α4-1BB-treated mice. Scale bar represents 50 μm. Time-color coding is used to superimpose frames, providing a visualization of cell movement over time, with the outlines of the cells clearly delineated. (L) Representative confocal microscopy of the liver of the indicated mice 3 days after T cell transfer. Sinusoids are stained with anti-CD38 Abs (white), while Cor93 T cells are red. Scale bars represent 100 μm.
Figure 3
Figure 3
Intrahepatic priming generates a stable and heterogeneous pool of dysfunctional memory-like CD8+ T cells (A) Experimental setup. 106 Cor93 TN cells were adoptively transferred into WT mice (C57BL/6) previously transduced with rLCMV-core 4 h before or into HBV-Tg mice (MUP-core). Cor93 T cells from the first group (rLCMV-core) will be referred to as “KC-primed” (blue), while those from the HBV-Tg group will be labeled “HC-primed” (red). Livers were collected at day 28, and Cor93 T cells were analyzed or FACS-sorted and processed for scRNA-seq. (B) Number of Cor93 T cells in the liver of the indicated mice 28 days after transfer. n = 17, pooled from 4 independent experiments; two-tailed Mann-Whitney test. (C) Heatmap of normalized and scaled expression values of 106 marker genes characterizing the 2 groups. Genes representative of each group are indicated. (D) Heatmap showing the frequency of Cor93 T cells expressing the indicated markers by flow cytometry. n = 6–7, pooled from 2 experiments. (E) UMAP projection of 18,489 sorted and sequenced Cor93 T cells. Each dot corresponds to a single cell, colored according to experimental groups (upper) or unbiasedly clustered using Louvain algorithm (lower). Dys-TSL, dysfunctional stem-like T cells; Dys-TRM1 and Dys-TRM2, dysfunctional tissue-resident memory T cells subset 1 and subset 2, respectively; TRM, tissue-resident memory T cells; TCM, central-memory T cells. (F) Feature plot representation of the normalized expression level of selected genes. (G) Bubble plot representation of the scaled expression level of a manually curated list of genes in clusters identified in (E). Dot size correlates with cell marker expression percentage per cluster, while color scale indicates average gene expression per cluster. (H) Violin plots showing the normalized expression of Cd48 in the HC-primed clusters. (I) Representative gating strategy (left) and frequencies (right) of the three subpopulations among total Cor93 T cells determined by flow cytometry. n = 8; one-way Brown-Forsythe and Welch ANOVA test with Dunnett correction. (J) t-SNE representation of Cor93 T cell subpopulations determined by flow cytometry. (K) t-SNE representation of the expression of indicated markers on Cor93 T cell clusters. (L) Frequency of expression of the indicated markers in the three subpopulations determined by flow cytometry. n = 8, pooled from 2 independent experiments. See also Figure S4.
Figure S4
Figure S4
HC priming generates a long-lived and heterogeneous pool of dysfunctional memory-like CD8+ T cells, related to Figure 3 (A) Representative immunohistochemical micrographs of liver sections from the indicated groups of mice at day 28, showing HBcAg expression (brown). Scale bar represents 200 μm. (B) Amount of sALT in the serum of the indicated group of mice at the indicated time points. n = 9–12. (C) Percentage of IFN-γ-producing Cor93 T cells in the livers of the indicated mice upon ex vivo cognate peptide stimulation. n = 8–10, pooled from 3 independent experiments; Mann-Whitney test. (D) Multiphoton intravital microscopy was performed between days 28 and 35. Representative time-lapse images showing Cor93 T cells (green) and membranes of host cells (red) in the indicated groups (scale bars represent 10 μm, time mm:ss). Cell motion during time is visualized by white dotted tracks. (E–G) Quantitative analyses of Cor93 T cell behavior in the mouse liver 28–35 days after T cell transfer. n = 11–14 mice pooled from 3 independent experiments. Single-cell speed (E), arrest coefficient (F, calculated for a threshold of 3 μm/min), and meandering index (G). Mann-Whitney test. (H) Fraction of Ki67+ Cor93 T cells isolated from the liver of the indicated mice 28 days after adoptive transfer. n = 6–7 per group, pooled from 2 experiments; unpaired two-tailed t test. (I) Experimental setup. 2 × 104 CD8+ Cor93 TN cells were adoptively transferred into HBV-Tg (MUP-core, HC-primed) or WT (C57BL/6) mice that had been transduced with rLCMV-HBc 4 h before (KC-primed). Livers were collected and analyzed on day 28. (J) Total numbers of Cor93 T cells per liver in the indicated groups. (K) Geometric mean fluorescent intensity (gMFI) of IFN-γ in Cor93 T cells isolated from the liver in the indicated groups at the indicated time point upon ex vivo stimulation with or without cognate peptide. n = 3–4; two-way ANOVA. (L) Experimental setup. 106 naive CD8+ Cor93 TN cells were adoptively transferred into HBV-Tg (MUP-core, HC-primed) or WT (C57BL/6) mice that had been transduced with rLCMV-HBc 4 h before (KC-primed). Livers were analyzed after 3 months. (M) Total numbers of Cor93 T cells per liver in the indicated groups. (N) gMFI of IFN-γ in Cor93 T cells isolated from the liver in the indicated groups at the indicated time point upon stimulation with or without cognate peptide. n = 3–4; two-way ANOVA. (O) Experimental setup. 106 CD8+ Cor93 TN cells were adoptively transferred into HBV-Tg (MUP-core, HC-primed) or WT (C57BL/6) mice that had been transduced with rLCMV-HBc 4 h before (KC-primed). Livers were analyzed after 6 months. (P) Total numbers of Cor93 T cells per liver in the indicated groups. (Q) gMFI of IFN-γ in Cor93 T cells isolated from the liver in the indicated groups at the indicated time point upon stimulation with or without cognate peptide. n = 4–5; two-way ANOVA. (R) Experimental setup. 106 CD8+ Cor93 TN cells were adoptively transferred into HBV replication-competent transgenic (1.3.32, HC-primed) or WT (C57BL/6) mice that had been transduced with rLCMV-HBc 4 h before (KC-primed). Livers were analyzed after 28 days. (S) Numbers of Cor93 T cells per liver in the indicated groups. (T) gMFI of IFN-γ in Cor93 T cells isolated from the liver in the indicated groups at the indicated time point upon 4 h stimulation with or without cognate peptide. n = 5–6; two-way ANOVA. (U) Representative immunohistochemical micrographs of liver sections from the indicated groups of mice, showing HBcAg expression (brown). Scale bar represents 100 μm. (V) Heatmap showing the percentages of Cor93 T cells expressing the indicated markers in the indicated groups as determined by flow cytometry. Each column represents an individual mouse.
Figure 4
Figure 4
Developmental relationship between the three subpopulations induced by hepatocellular priming (A) RNA velocity plotted in the UMAP space for HC-primed Cor93 T cells at day 28. Arrows indicate the location of the estimated future cell state. Each dot corresponds to a single cell, colored according to the unbiased clusters identified in Figure 3E. (B) Frequencies of Ki67+ Dys-TSL, Dys-TRM1, and Dys-TRM2 cell populations 28 days after transfer. n = 8; one-way Brown-Forsythe and Welch ANOVA test with Dunnett correction. (C) Experimental setup. Cor93 T cells were isolated from the livers at day 28 after HC priming, and Dys-TSL, Dys-TRM1, and Dys-TRM2 were FACS-sorted according to the expression of CD48 and SLAMF6. Sorted populations were transferred into rLCMV-core-transduced WT recipients analyzed 5 days later. (D) Ki67 expression of Cor93 T cells recovered in the liver of the indicated mice 5 days after transfer of FACS-sorted Dys-TSL, Dys-TRM1, or Dys-TRM2. n = 3; one-way Brown-Forsythe and Welch ANOVA test with Dunnett correction. (E and F) Representative plots (E) and frequencies (F) of Dys-TSL, Dys-TRM1, and Dys-TRM2 output subpopulations recovered in the livers of mice injected with the indicated input cell populations. n = 3 per group; two-way ANOVA. (G) Experimental setup. Cor93 T cells were isolated from the livers at day 28 after HC priming, and Dys-TSL and Dys-TRM were CD45.1 MACS-enriched and then FACS-sorted according to the expression of SLAMF6. Sorted subpopulations were transferred into HBV-Tg mice (lineage 1.3.32), and the recipients were analyzed 5 days later. (H) Representative plots indicating the purity of the indicated cells after sorting. (I and J) Representative plots (I) and frequencies (J) of Dys-TSL and Dys-TRM output subpopulations recovered in the livers of mice injected with the indicated input cell populations. n = 3 per group; two-way ANOVA. (K) Percentage of Ki67+ Cor93 T cells recovered from the liver of the indicated mice 5 days after transfer. n = 3 per group; two-tailed Mann-Whitney test. (L) Graphical representation depicting the current model of Dys-T developmental hierarchy.
Figure 5
Figure 5
Upon chronic antigenic stimulation, only 4-1BB but not OX40 stimulation results in significant T cell reinvigoration (A) Heatmap displaying the expression of a selection of genes. Data on the left derived from the scRNA-seq dataset conducted in our study, while the data on the right originates from the dataset presented in Miller et al. Specific cell subsets are labeled above the heatmap. Highlighted squares indicate comparisons between subsets identified in both studies: genes common to both the Dys-TRM and TEX subsets (red), genes exclusive to the Dys-TRM subsets (orange), genes shared between the Dys-TSL and TPEX subsets (green), and genes specific to Dys-TSL (blue). Color scale indicates the normalized/scaled expression. (B) UMAP projection (top left) and feature plots of signatures extracted from the re-analysis of the scRNA-seq dataset of Miller et al., showing the enrichment of the TPEX (top right), TEX (bottom left), and effector-like (bottom right) signatures on the UMAP from Figure 3E. Color scale indicates the signature score. (C and D) Violin plots showing the normalized expression profile of Tnfrsf4 (C) and Tnfrsf9 (D) on the subsets described in (A). (E) Experimental setup. (F) Numbers of IHL isolated from the liver of the indicated mice. (G) Numbers of Cor93 T cells isolated from the liver of the indicated mice. n = 4–5; one-way Brown-Forsythe and Welch ANOVA test with Dunnett correction. Each group was compared with PBS-injected controls. (H and I) Representative FACS plots (H) and percentages (I) of Dys-TSL, Dys-TRM1, and Dys-TRM2 Cor93 T cell subpopulations in the groups described in (E). (J and K) Representative plots (J) and fractions (K) of IFN-γ-producing Dys-TSL, Dys-TRM1, and Dys-TRM2 Cor93 T cell subpopulations in the groups described in (E). (L and M) Representative plots (L) and percentages (M) of CCL5+ Dys-TSL, Dys-TRM1, and Dys-TRM2 Cor93 T cell subpopulations in the groups described in (E). (N and O) Representative plots (N) and percentages (O) of Granzyme A (GzmA)+ Dys-TSL, Dys-TRM1, and Dys-TRM2 Cor93 T cell subpopulations in the groups described in (E). n = 4–5; one-way Brown-Forsythe and Welch ANOVA test with Dunnett correction. Each group was compared with PBS-injected controls. (P) sALT of the indicated groups of mice at the indicated time points. n = 4–5; two-way ANOVA test with Dunnett correction. Each group was compared with PBS-injected controls (simple effect within row). (Q) Representative immunohistochemical micrographs of liver sections from the indicated groups of mice stained for cleaved caspase 3 (ΔCas3). Scale bar represents 100 μm. (R) Experimental setup. (S) Representative plots of IFN-γ expression among Cor93 T cells in the liver of the indicated mice. Numbers represent the percentage of cells within the indicated gates. (T) Frequencies of IFN-γ-producing Cor93 T cells in the livers of the indicated mice upon ex vivo cognate peptide stimulation. n = 3–4; one-way Brown-Forsythe and Welch ANOVA test with Dunnett correction. Each group was compared with PBS-injected controls. (U) Representative micrographs of liver sections from the indicated groups of mice showing immunohistochemical staining for HBcAg. Scale bars represent 100 μm.
Figure S5
Figure S5
Antigen sensing, cytolytic function, and effector molecule expression in HC-primed CD8+ T cells before and after 4-1BB treatment, related to Figure 6 (A) Experimental setup. 106 Cor93 TN cells were adoptively transferred into WT mice (C57BL/6 background) previously transduced with rLCMV-core 4 h before (KC-primed) or into HBV-Tg mice (MUP-core). Livers were collected and analyzed at day 7. (B) Representative histograms (left) and median fluorescence intensity (MFI, right) of Cor93–100:Dimer staining on Cor93 T cells (defined as live/CD45.1+/CD8+) isolated from the liver of the indicated mice. (C) Representative histograms (left) and MFI (right) of CD3 staining on Cor93 T cells isolated from the liver or the spleen of the indicated mice. (D) Representative histograms (left) and MFI quantification (right) of CD3ζ-pY142 detected by BD Phosflow protocol on Cor93 T cells isolated from the liver of the indicated mice at the indicated conditions. n = 3/4 per group; one-way Brown-Forsythe and Welch ANOVA test with Dunnett correction for multiple comparisons. (E) Experimental setup. 106 fluorescent Cor93 TN cells were adoptively transferred into WT mice (C57BL/6 background) previously transduced with rLCMV-core 4 h before or into HBV-Tg mice (lineage MUP-core). Mice were injected or not with Cor93–100 peptide at day 28, and Cor93 T cell behavior was assessed by multiphoton intravital microscopy (MP-IVM) 4 h later. (F) Single-cell speed of Cor93 T cells in the liver of the indicated mice in the indicated condition. Mann-Whitney test. (G) Schematic representation of the experimental setup. HBV-Tg mice (1.3.32 lineage) were adoptively transferred with Cor93 TN and challenged 24 h later with or without 4-1BB agonist antibody. 5 days after T cell transfer, intrahepatic Cor93 T cells were isolated and plated with a mixture of C57BL/6 splenocytes pulsed or not with cognate Cor93–100 peptide. Unpulsed and pulsed target cell populations were labeled with low or high amount of cell trace violet (CTV), respectively, and mixed at 1:1 ratio prior to coculture. Cocultured cells were incubated for 4 or 16 h and analyzed by flow cytometry. (H and I) Representative histograms (H) and quantification (I) depicting the specific killing of CTVhigh peptide-pulsed population in the indicated conditions. n = 3/4 per group; two-way ANOVA test with Geisser-Greenhouse correction. (J) Schematic representation of the experimental setup. HBV replication-competent transgenic mice (lineage 1.3.32) were adoptively transferred with Cor93 TN and challenged 24 h later with or without 4-1BB agonist antibody. Livers were collected and analyzed 5 days after adoptive transfer. (K–O) Representative histograms (left) and fractions (right) of FasL (K), TNF-α (L), IFN-γ (M), GzmB (N), and CD107a (O) in the indicated cell populations isolated from the liver of the indicated mice. n = 3/4 per group; one-way Brown-Forsythe and Welch ANOVA test with Dunnett correction. Each group was compared with PBS-injected controls.
Figure 6
Figure 6
Mechanism of action and plasticity of dysfunctional T cell subpopulations to 4-1BB agonism upon chronic antigenic stimulation (A) Experimental setup. (B) Numbers of Cor93 T cells isolated from the liver of the indicated mice. (C) Representative FACS plots (left) and percentages (right) of Dys-TSL, Dys-TRM1, and Dys-TRM2 Cor93 T cell subpopulations in the indicated groups. (D and E) Representative FACS plots (D) and fractions (E) of IFN-γ-producing Dys-TSL, Dys-TRM1, and Dys-TRM2 Cor93 T cell subpopulations in the indicated groups. n = 3–5; one-way Brown-Forsythe and Welch ANOVA test with Dunnett correction. (F) Experimental setup. 106 Cor93 TN cells were adoptively transferred in HBV-Tg mice (MUP-core). 28 days later, Dys-TSL, Dys-TRM1, and Dys-TRM2 subsets were FACS-sorted. Cells were cultured in the presence of cognate Cor93–100 peptide with or without 4-1BB antibody and analyzed 16 h later. (G–I) Fractions of proliferating Ki67+ and non-proliferating Ki67 IFN-γ-producing cells among Dys-TSL (G), Dys-TRM1 (H), and Dys-TRM2 (I). n = 3/group; one-way Brown-Forsythe and Welch ANOVA test with Dunnett correction. (J) Experimental setup. Cor93 TN cells were transferred in HBV-Tg mice. 28 days later, livers were collected, and IHL were cultured in the presence of cognate Cor93–100 peptide with or without αOX40 or α4-1BB agonist antibody. Cells were analyzed 16 h later by flow cytometry. (K and L) Representative histograms (left) and MFI quantification (right) of OX40 (K) and 4-1BB (L) basal expression levels in endogenous CD8+ T cells, Dys-TRM (TCF1 SLAMF6), and Dys-TSL (TCF1+ SLAMF6+) Cor93 T cells in unstimulated conditions. (M and N) Representative histograms (left) and frequencies (right) of IFN-γ (M) and Ki67 (N) expression in Dys-TRM and Dys-TSL Cor93 T cells in the indicated conditions. n = 4 per group; two-way ANOVA. (O) Representative plots showing different dysfunctional T cell population in the indicated conditions with the same experimental design depicted in (F). (P–R) Fractions of different CD8+ T cell subsets recovered after culture of FACS-sorted Dys-TSL (P), Dys-TRM1 (Q), and Dys-TRM2 (R) in the indicated conditions. n = 3 per group; two-way ANOVA test with Geisser-Greenhouse correction. See also Figures S5 and S6.
Figure S6
Figure S6
Differential gene expression induced by 4-1BB vs. OX40 stimulation in dysfunctional T cells, related to Figure 6 (A) Experimental setup. 106 Cor93 TN cells were adoptively transferred into HBV replication-competent transgenic mice (lineage 1.3.32). 24 h later, indicated groups of mice were injected intraperitoneally with PBS or 100 μg of αOX40 or α4-1BB agonist. Livers were collected and analyzed at day 5, and bulk RNA-seq was performed on FACS-sorted Cor93 T cells. (B) Principal-component analysis (PCA) of samples in the indicated conditions. (C) Bar plots displaying a manually curated set of pathways enriched in Cor93 T cells upon in vivo αOX40 (red) and α4-1BB (orange) treatment compared with PBS HC-primed condition. Pathways were retrieved from the MSigDB database and belong to Gene Ontology, Reactome, and Hallmarks collections. NES, normalized enrichment score. (D) Clustering of top significant (EnrichR combined score > 100, false discovery rate [FDR] < 0.05) Gene Ontology biological processes, BioPlanet, and MSigDB Hallmark pathways of processes upregulated in Cor93 T cells upon in vivo αOX40 (left) and α4-1BB (right) treatment compared with PBS HC-primed condition. The thermal scale represents the Jaccard similarity coefficient between every gene set pair (blue representing a similarity coefficient of 0 and red a similarity coefficient of 1). (E) Heatmaps of manually curated list of genes linked to the indicated pathway comparing PBS, αOX40, and α4-1BB treatments. Values are Z scores, calculated from scaling by row the log2(TPM) values.
Figure 7
Figure 7
4-1BB agonism reinvigorates dysfunctional CD8+ T cells from patients with HBeAg+ chronic HBV infection (A) Experimental setup. (B) Gating strategy (left) and representative plots (right) of cytokine production and CD107a upregulation on day 10. (C and D) Paired percentages of IFN-γ-producing CD8+ T cells in short-term T cell lines generated by HBV core (C) or polymerase (Pol, D) peptide stimulation in the presence or absence of α-PD-1, OX40L, or 4-1BBL. One PBS control per patient is used for pairwise comparison against each of the other conditions. Figure S7 presents all individual patient data along with dose-response curves. For each stimulation, the dosage yielding the maximum enhancement for every cytokine was chosen. n = 8; two-way ANOVA. (E) Pie charts represent the percentage of patients showing an increase in IFN-γ production by CD8+ T cells generated in short-term T cell lines by HBV core (left) or polymerase (right) peptide stimulation in the presence or absence of α-PD-1, OX40L, or 4-1BBL. Results are percentage of patients showing fold increase <2 (gray) or >2 (red). (F and G) Paired percentages of TNF-α+ CD8+ cells in short-term T cell lines generated by HBV core (F) or polymerase (G) peptides as in (C) and (D). (H) Pie charts represent the increase of TNF-α production by CD8+ T cells as in (E). (I and J) Percentage of CD107a+ CD8+ cells in short-term T cell lines generated by HBV core (I) or polymerase (J) peptides as in (C) and (D). (K) Pie charts represent CD107a upregulation in CD8+ T cells as in (E). See also Figure S7.
Figure S7
Figure S7
4-1BB agonism reinvigorates dysfunctional CD8+ T cells from patients with HBeAg+ chronic HBV infection, related to Figure 7 Percentage of IFN-γ, TNF-α, and CD107a-positive CD8+ cells in short-term T cell lines for each patient (n = 8) with HBeAg+ chronic HBV infection in the presence or absence of anti-PD-1 (yellow histograms; 1, 5, and 10 μg/mL), recombinant OX40L (red histograms; 30, 50, 100, 500, and 1,000 ng/mL), or recombinant 4-1BBL (orange histograms; 0.5, 1, 2, and 4 μg/mL). T cell lines were generated by HBV core (left) or polymerase (right) peptide pool stimulation.

Similar articles

Cited by

References

    1. Iannacone M., Guidotti L.G. Immunobiology and pathogenesis of hepatitis B virus infection. Nat. Rev. Immunol. 2022;22:19–32. doi: 10.1038/s41577-021-00549-4. - DOI - PubMed
    1. Kawashima K., Andreata F., Beccaria C.G., Iannacone M. Priming and Maintenance of Adaptive Immunity in the Liver. Annu. Rev. Immunol. 2024 doi: 10.1146/annurev-immunol-090122-041354. Published online February 15, 2024. - DOI - PubMed
    1. Isogawa M., Chung J., Murata Y., Kakimi K., Chisari F.V. CD40 Activation Rescues Antiviral CD8+ T Cells from PD-1-Mediated Exhaustion. PLoS Pathog. 2013;9 doi: 10.1371/journal.ppat.1003490. - DOI - PMC - PubMed
    1. Bénéchet A.P., De Simone G., Di Lucia P., Cilenti F., Barbiera G., Le Bert N., Fumagalli V., Lusito E., Moalli F., Bianchessi V., et al. Dynamics and genomic landscape of CD8+ T cells undergoing hepatic priming. Nature. 2019;574:200–205. doi: 10.1038/s41586-019-1620-6. - DOI - PMC - PubMed
    1. Guidotti L.G., Inverso D., Sironi L., Di Lucia P., Fioravanti J., Ganzer L., Fiocchi A., Vacca M., Aiolfi R., Sammicheli S., et al. Immunosurveillance of the Liver by Intravascular Effector CD8+ T Cells. Cell. 2015;161:486–500. doi: 10.1016/j.cell.2015.03.005. - DOI - PMC - PubMed

MeSH terms

Substances