

In vitro to in vivo extrapolation from 3D hiPSC-derived cardiac microtissues and physiologically based pharmacokinetic modeling to inform next-generation arrhythmia risk assessment
- PMID: 38897660
- PMCID: PMC11347779
- DOI: 10.1093/toxsci/kfae079
In vitro to in vivo extrapolation from 3D hiPSC-derived cardiac microtissues and physiologically based pharmacokinetic modeling to inform next-generation arrhythmia risk assessment
Abstract
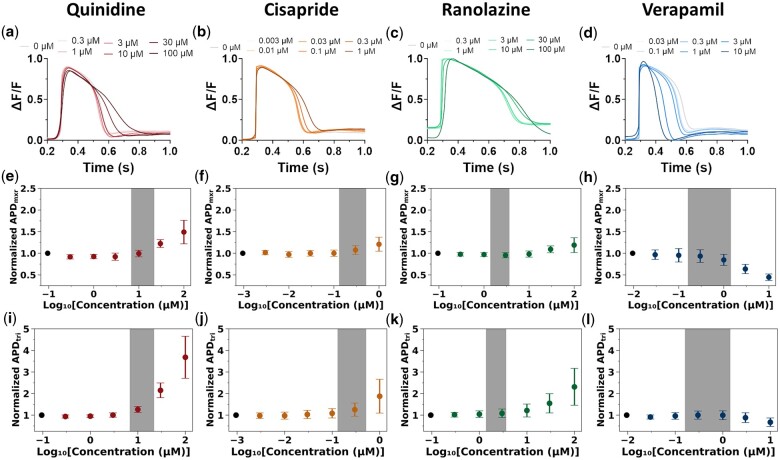
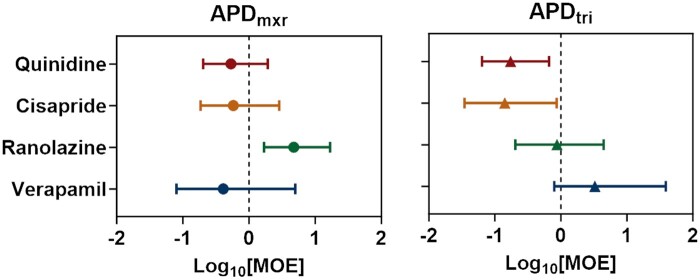
Proarrhythmic cardiotoxicity remains a substantial barrier to drug development as well as a major global health challenge. In vitro human pluripotent stem cell-based new approach methodologies have been increasingly proposed and employed as alternatives to existing in vitro and in vivo models that do not accurately recapitulate human cardiac electrophysiology or cardiotoxicity risk. In this study, we expanded the capacity of our previously established 3D human cardiac microtissue model to perform quantitative risk assessment by combining it with a physiologically based pharmacokinetic model, allowing a direct comparison of potentially harmful concentrations predicted in vitro to in vivo therapeutic levels. This approach enabled the measurement of concentration responses and margins of exposure for 2 physiologically relevant metrics of proarrhythmic risk (i.e. action potential duration and triangulation assessed by optical mapping) across concentrations spanning 3 orders of magnitude. The combination of both metrics enabled accurate proarrhythmic risk assessment of 4 compounds with a range of known proarrhythmic risk profiles (i.e. quinidine, cisapride, ranolazine, and verapamil) and demonstrated close agreement with their known clinical effects. Action potential triangulation was found to be a more sensitive metric for predicting proarrhythmic risk associated with the primary mechanism of concern for pharmaceutical-induced fatal ventricular arrhythmias, delayed cardiac repolarization due to inhibition of the rapid delayed rectifier potassium channel, or hERG channel. This study advances human-induced pluripotent stem cell-based 3D cardiac tissue models as new approach methodologies that enable in vitro proarrhythmic risk assessment with high precision of quantitative metrics for understanding clinically relevant cardiotoxicity.
Keywords: cardiac arrhythmias; cardiovascular toxicity; human risk assessment; in vitro to in vivo extrapolation; physiologically based pharmacokinetics; tissue engineering.
© The Author(s) 2024. Published by Oxford University Press on behalf of the Society of Toxicology. All rights reserved. For permissions, please e-mail: journals.permissions@oup.com.
Conflict of interest statement
The authors declare no conflicts of interest.
Figures


Similar articles
-
Computationally-informed point of departure evaluation for proarrhythmic cardiotoxicity assessment using 3D engineered cardiac microtissues from human iPSC-derived cardiomyocytes.Toxicol Sci. 2025 Jul 22:kfaf094. doi: 10.1093/toxsci/kfaf094. Online ahead of print. Toxicol Sci. 2025. PMID: 40692085
-
Delayed Repolarization Caused by hERG Block With Different Drug Modalities Can Be Detected in Stem Cell-Derived Cardiomyocytes: Incubation Time Matters.Clin Transl Sci. 2025 Sep;18(9):e70283. doi: 10.1111/cts.70283. Clin Transl Sci. 2025. PMID: 40848285 Free PMC article.
-
CiPA-qualified human iPSC-derived cardiomyocytes: A new frontier in toxicity testing by evaluating drug-induced arrhythmias.Toxicol In Vitro. 2025 Oct;108:106100. doi: 10.1016/j.tiv.2025.106100. Epub 2025 Jun 5. Toxicol In Vitro. 2025. PMID: 40482844
-
An overview of drug-induced sodium channel blockade and changes in cardiac conduction: Implications for drug safety.Clin Transl Sci. 2024 Dec;17(12):e70098. doi: 10.1111/cts.70098. Clin Transl Sci. 2024. PMID: 39660576 Free PMC article. Review.
-
Assessing the comparative effects of interventions in COPD: a tutorial on network meta-analysis for clinicians.Respir Res. 2024 Dec 21;25(1):438. doi: 10.1186/s12931-024-03056-x. Respir Res. 2024. PMID: 39709425 Free PMC article. Review.
References
-
- Adashi EY, O'Mahony DP, Cohen IG.. 2023. The FDA modernization act 2.0: drug testing in animals is rendered optional. Am J Med. 136(9):853–854. - PubMed
-
- Ando H, Yoshinaga T, Yamamoto W, Asakura K, Uda T, Taniguchi T, Ojima A, Shinkyo R, Kikuchi K, Osada T, et al. 2017. A new paradigm for drug-induced torsadogenic risk assessment using human iPS cell-derived cardiomyocytes. J Pharmacol Toxicol Methods. 84:111–127. - PubMed
MeSH terms
Grants and funding
LinkOut - more resources
Full Text Sources
Medical
