. 2024 Jul 24;44(30):e2192232024.
doi: 10.1523/JNEUROSCI.2192-23.2024.

A Light-Responsive Neural Circuit Suppresses Feeding

Affiliations

A Light-Responsive Neural Circuit Suppresses Feeding

Hailan Liu et al. J Neurosci. .

Abstract

Light plays an essential role in a variety of physiological processes, including vision, mood, and glucose homeostasis. However, the intricate relationship between light and an animal's feeding behavior has remained elusive. Here, we found that light exposure suppresses food intake, whereas darkness amplifies it in male mice. Interestingly, this phenomenon extends its reach to diurnal male Nile grass rats and healthy humans. We further show that lateral habenula (LHb) neurons in mice respond to light exposure, which in turn activates 5-HT neurons in the dorsal Raphe nucleus (DRN). Activation of the LHb→5-HTDRN circuit in mice blunts darkness-induced hyperphagia, while inhibition of the circuit prevents light-induced anorexia. Together, we discovered a light-responsive neural circuit that relays the environmental light signals to regulate feeding behavior in mice.

Keywords: 5-HT; LHb; feeding; light.


Conflict of interest statement

The authors declare no competing financial interests.

Figures

Figure 1.
Figure 1.
Light decreases feeding in mice. A, B, Food intake during 6–10 P.M. (A, n = 8) or 2–6 A.M. (B, n = 8) in the absence or presence of light (300 lux). C, D, Food intake during 6–10 A.M. (C, n = 12) or 2–6 P.M. (D, n = 8) in the presence or absence of light (300 lux). E, Fasting-induced refeeding during 6–8 P.M. with or without light exposure (300 lux, n = 9 per group). F, Fasting-induced refeeding during 6–8 A.M. with or without light exposure (300 lux, n = 9 per group). Data are expressed as mean ± SEM and individual data points. Paired (A–D) or unpaired (E, F) Student's t tests. *p < 0.05, **p < 0.01, ***p < 0.001.
Figure 2.
Figure 2.
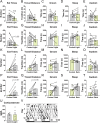
Light manipulation affects eating and locomotion without significantly altering grooming and sleeping. A–E, HomeCageScan revealing the number of eating times (A), travel distance (B), duration for grooming (C), sleeping (D), and awakening (E) in mice during 6–10 P.M. in the absence or presence of light (300 lux, n = 8). F–J, HomeCageScan revealing the number of eating times (F), travel distance (G), duration for grooming (H), sleeping (I), and awakening (J) in mice during 2–6 A.M. in the absence or presence of light (300 lux, n = 8). K–O, HomeCageScan revealing the number of eating times (K), travel distance (L), duration for grooming (M), sleeping (N), and awakening (O) in mice during 2–6 P.M. with overhead lights on or off (300 lux, n = 8). P–T, HomeCageScan revealing the number of eating times (P), travel distance (Q), duration for grooming (R), sleeping (S), and awakening (T) in mice during 6–10 A.M. with overhead lights on or off (300 lux, n = 8). U, Serum corticosterone levels after light exposure (300 lux) from 6 to 10 P.M. V, Double-plotted actogram showing wheel-running activities of WT mice that were constantly exposed to light (300 lux) for 2 weeks. Data are expressed as mean ± SEM and individual data points. Paired Student's t tests (A–T). Unpaired Student's t tests (U) *p < 0.05, **p < 0.01.
Figure 3.
Figure 3.
Light decreases feeding independent of the circadian clock in mice. A, B, Food intake during 2–6 P.M. (A) or 6–10 A.M. (B) with or without light exposure (300 lux) in mice after a 2-week constant light exposure (300 lux, n = 12). C, Fasting-induced refeeding during 6–8 A.M. with or without light exposure (300 lux) in mice after a 2-week constant light exposure (300 lux, n = 6 per group). Data are expressed as mean ± SEM and individual data points. Paired (A, B) or unpaired (C) Student's t tests. *p < 0.05, **p < 0.01.
Figure 4.
Figure 4.
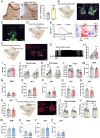
An LHb→DRN circuit mediates light-induced anorexia. A, Representative c-fos immunoreactivity and quantification in the LHb from mice in darkness or after 1 h light exposure (300 lux, n = 5 per group). B, Scheme for AAV-CaMKII-ChR2-GFP virus injection into the LHb of WT mice and ChR2-GFP-labelled cell bodies in the LHb. C, ChR2-GFP–labeled fibers/terminals in the DRN. D, Scheme for GCaMP6m expression in DRN-projecting LHb neurons. E, GCaMP6m signals in DRN-projecting LHb neurons in response to light stimulation (300 lux, n = 6) and changes in calcium fluorescence of DRN-projecting LHb neurons from six individual mice. Time 0 marks the start of light exposure (300 lux). F, Scheme for specific infection of DRN-projecting LHb neurons with hM3Dq or mCherry and a representative image showing hM3Dq expression in the LHb. G–I, Typical action potential traces (G), firing frequency (H), and resting membrane potential (I) of DRN-projecting LHb neurons expressing hM3Dq in response to 10 µM CNO. J, Food intake during 2–6 P.M. in saline-treated mCherry or hM3Dq mice with overhead lights on or off (300 lux, n = 7 per group). K, Food intake during 2–6 P.M. in CNO-treated mCherry or hM3Dq mice with overhead lights on or off (300 lux, n = 7 per group). L, Food intake during 6–8 P.M. in saline- or CNO-treated mCherry and hM3Dq mice (n = 7 per group). M, N, Traveling distance (M) and time spent in the open arm (N) during EPM test in mCherry and hM3Dq mice after CNO treatment (n = 7 per group). O, P, Traveling distance (O) and time spent in the center (P) during the open field test in mCherry and hM3Dq mice after CNO treatment (n = 7 per group). Q, The immobility time during forced swimming test in mCherry and hM3Dq mice after CNO treatment (n = 7 per group). R, The immobility time during tail suspension test in mCherry and hM3Dq mice after CNO treatment (n = 7 per group). S, Time spent in CNO-paired side in mCherry and hM3Dq mice after conditioning (n = 7 per group). T, Scheme for specific infection of DRN-projecting LHb neurons with hM4Di or mCherry and a representative image showing hM4Di expression in the LHb. U, Food intake during 6–10 P.M. in saline-treated mCherry or hM4Di mice with overhead lights on or off (300 lux, n = 7 per group). V, Food intake during 6–10 P.M. in CNO-treated mCherry or hM4Di mice with overhead lights on or off (300 lux, n = 7 per group). W, X, Traveling distance (W) and time spent in the open arm (X) during the EPM test in mCherry and hM4Di mice after CNO treatment (n = 7 per group). Y, Z, Traveling distance (Y) and time spent in the center (Z) during the open field test in mCherry and hM4Di mice after CNO treatment (n = 7 per group). Data are expressed as mean ± SEM and individual data points. Two-way ANOVA with Tukey's test (J–L, U, V) or unpaired Student's t test (A, M–S, W–Z) or paired Student's t tests (H, I). *p < 0.05, **p < 0.01, ***p < 0.001 (see Extended Data Figs. 4-1 and 4-2 for more details).
Figure 5.
Figure 5.
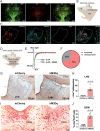
5-HTDRN neurons receive excitatory inputs from the LHb. A, Immunofluorescence images showing the close localization of LHb-originated fibers and 5-HT neurons in the DRN. B, Scheme for the labeling of DRN-projecting LHb neurons with mCherry. C, RNAscope showing mCherry, vGLUT2, and vGAT in the LHb. D, Scheme for AAV-CaMKII-ChR2-GFP virus injection into the LHb of TPH2-CreER/Rosa26-LSL-tdTomato mice. E, Light-evoked EPSCs in 5-HT neurons in the presence or absence of DNQX (n = 10 neurons from 3 mice). F, The percentage of 5-HTDRN neurons in response to blue light stimulation (n = 10 neurons from 3 mice). G, H, Representative c-fos immunoreactivity (G) and quantification for the number of c-fos+ cells (H) in the LHb from mCherry (n = 6) and hM3Dq (n = 5) mice after CNO treatment. I, J, Double staining for TPH2 (red) and c-fos (brown) in the DRN of mCherry (n = 6) and hM3Dq (n = 5) mice after CNO treatment (I) and quantification for the number of c-fos+ cells in 5-HT neurons (J). Data are expressed as mean ± SEM and individual data points. Unpaired Student's t test (H, J). ***p < 0.001.
Figure 6.
Figure 6.
An LHb→5-HTDRN circuit mediates light-induced anorexia. A, B, Representative fluorescence images (A) and quantification (B) showing c-fos and TPH2 expression in the DRN of male wild-type mice after 1 h light exposure (300 lux, n = 3 per group). C, Scheme for AAV-Cre-GFP virus injection into the DRN of TPH2 flox/flox mice. D, E, TPH2 staining (D) and quantification (E) in the DRN of control and TPH2DRN-KO mice (n = 8 per group). F, Food intake during 6–10 P.M. in control (n = 7) and TPH2DRN-KO (n = 7) mice with or without light exposure (300 lux). G, H, TPH2 staining (G) and quantification of TPH2+ cells (H) in the DRN of control and TPH2DRN-KO mice (n = 7 per group). I, Scheme for the creation of control and TPH2DRN-KO mice with specific expression of hM3Dq or mCherry in DRN-projecting LHb neurons. J, Flp-dependent hM3Dq expression in the LHb. K–M, Representative c-fos immunoreactivity (K, L) and quantification (M) in the LHb from mCherry and hM3Dq mice after CNO treatment (n = 7 per group). N–P, Typical action potential traces (N), firing frequency (O), and resting membrane potential (P) of DRN-projecting LHb neurons expressing Flp-dependent hM3Dq in response to 10 µM CNO (n = 6 neurons). Q, Food intake during 2–6 P.M. in saline-treated control and TPH2DRN-KO mice that were infected with mCherry or hM3Dq, in the presence or absence of light (300 lux, n = 7 per group). R, Food intake during 2–6 P.M. in CNO-treated control and TPH2DRN-KO mice that were infected with mCherry or hM3Dq, in the presence or absence of light (300 lux, n = 7 per group). S, Food intake during 6–8 P.M. in saline- or CNO-treated control and TPH2DRN-KO mice infected with hM3Dq (n = 7 per group). Data are expressed as mean ± SEM and individual data points. Two-way ANOVA with Tukey's test (F, Q–S) or paired Student's t test (O, P) or unpaired Student's t test (B, E, H, M). #p < 0.05 for the effect of CNO in control versus TPH2DRN-KO mice. *p < 0.05, **p < 0.01, ***p < 0.001.
Figure 7.
Figure 7.
Light suppresses feeding in diurnal Nile grass rats. A, Food intake at the onset of light (6–9 A.M.) or dark (6–9 P.M.) cycle in Nile grass rats (n = 6). B, Food intake during 6–7 A.M. in Nile grass rats under strong (3,000 lux), normal (300 lux), and dim (50 lux) light conditions after an overnight fasting (n = 6). C, Representative c-fos immunoreactivity in the LHb from Nile grass rats perfused under the dark condition or 30 min after light exposure (3,000 lux). D, Representative TPH2 (red) and c-fos (brown) immunoreactivity in the DRN of the same Nile grass rats described in C. E, Quantification for the number of c-fos+ cells in the LHb (n = 3 per group). F, Quantification for the number of 5-HT neurons that are c-fos+ (n = 3 per group). G, H, Food intake after saline or lorcaserin administration in WT mice (n = 9 per group, G) or Nile grass rats (n = 6 per group, H). Data are expressed as mean ± SEM and individual data points. Unpaired Student's t tests (A, E–H) or one-way ANOVA (B). *p < 0.05, **p < 0.01, ***p < 0.001.
Figure 8.
Figure 8.
Light suppresses feeding in humans. A–D, Height (A), weight (B), BMI (C), and waist circumference (D) of the recruited individuals eating in normal or dim light environments. E–H, Total energy (E), Protein (F), fat (G), and carbohydrate (H) consumed by humans under normal (1,677 lux) or dim (100 lux) light illumination states. Data are expressed as mean ± SEM and individual data points. Unpaired Student's t tests (A–H). *p < 0.05, **p < 0.01.

References

    1. Adamovich Y, Rousso-Noori L, Zwighaft Z, Neufeld-Cohen A, Golik M, Kraut-Cohen J, Wang M, Han X, Asher G (2014) Circadian clocks and feeding time regulate the oscillations and levels of hepatic triglycerides. Cell Metab 19:319–330. 10.1016/j.cmet.2013.12.016 - DOI - PMC - PubMed
    1. Afkhami-Ardekani M, Sedghi H (2005) Effect of fluoxetine on weight reduction in obese patients. Indian J Clin Biochem 20:135–138. 10.1007/BF02893059 - DOI - PMC - PubMed
    1. Aizawa H, Amo R, Okamoto H (2011) Phylogeny and ontogeny of the habenular structure. Front Neurosci 5:138. 10.3389/fnins.2011.00138 - DOI - PMC - PubMed
    1. Aizawa H, Cui W, Tanaka K, Okamoto H (2013) Hyperactivation of the habenula as a link between depression and sleep disturbance. Front Hum Neurosci 7:826. 10.3389/fnhum.2013.00826 - DOI - PMC - PubMed
    1. Aklan I, et al. (2020) NTS catecholamine neurons mediate hypoglycemic hunger via medial hypothalamic feeding pathways. Cell Metab 31:313–326.e5. 10.1016/j.cmet.2019.11.016 - DOI - PMC - PubMed

LinkOut - more resources