. 2024 Jul 17;44(29):e0020242024.
doi: 10.1523/JNEUROSCI.0020-24.2024.

Distinct Action Signals by Subregions in the Nucleus Accumbens during STOP-Change Performance

Affiliations

Distinct Action Signals by Subregions in the Nucleus Accumbens during STOP-Change Performance

Sydney E Ashton et al. J Neurosci. .

Abstract

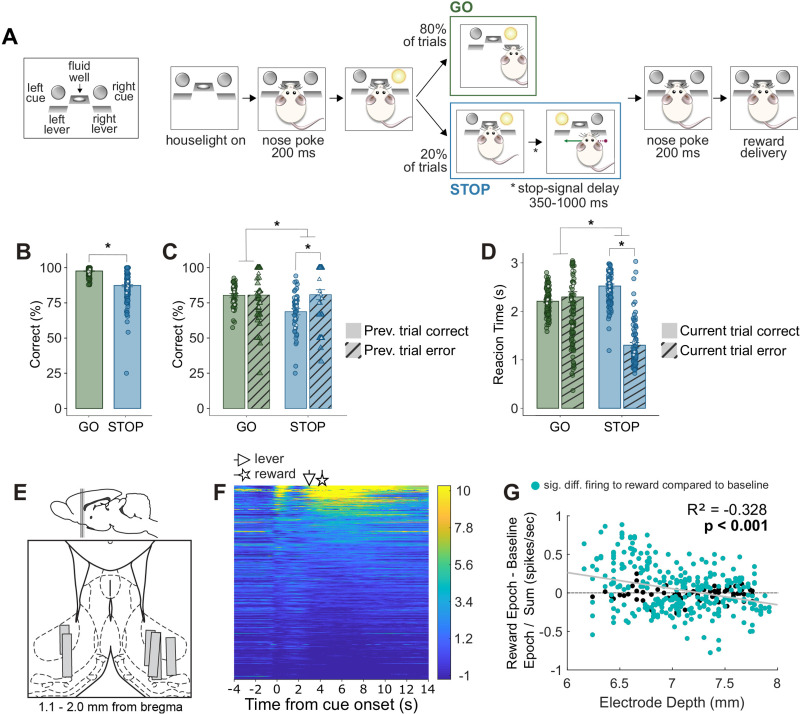
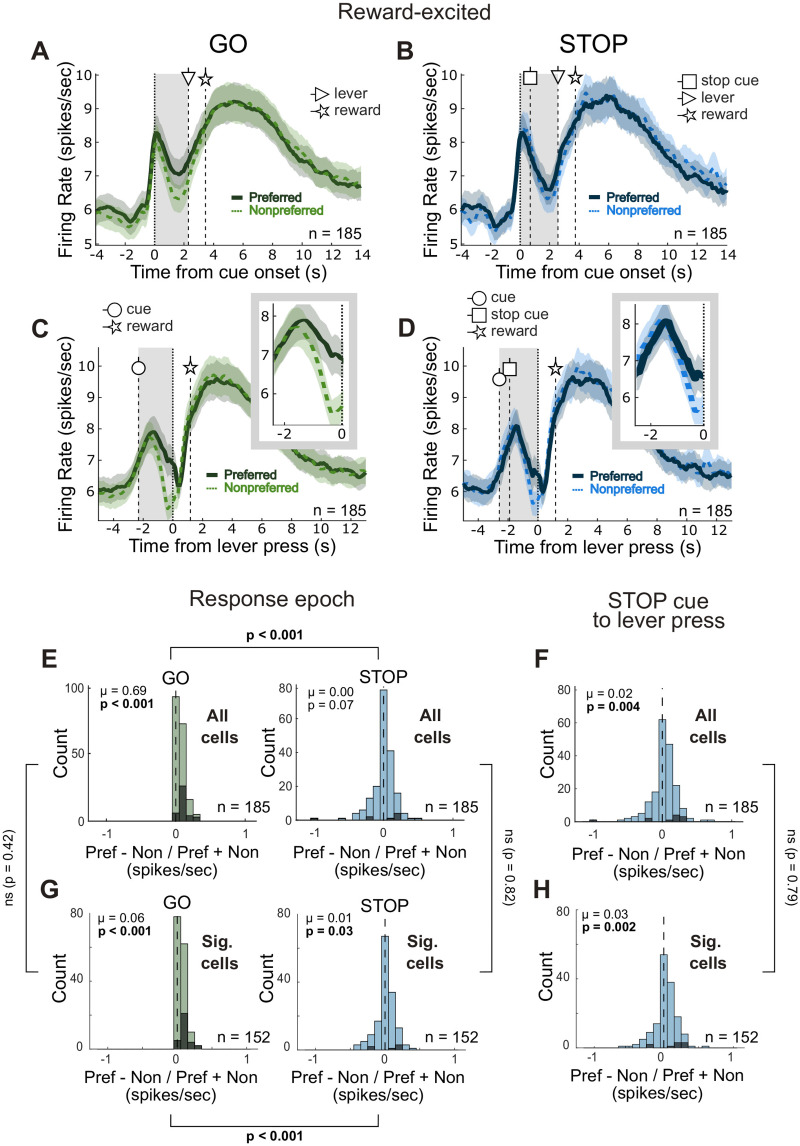
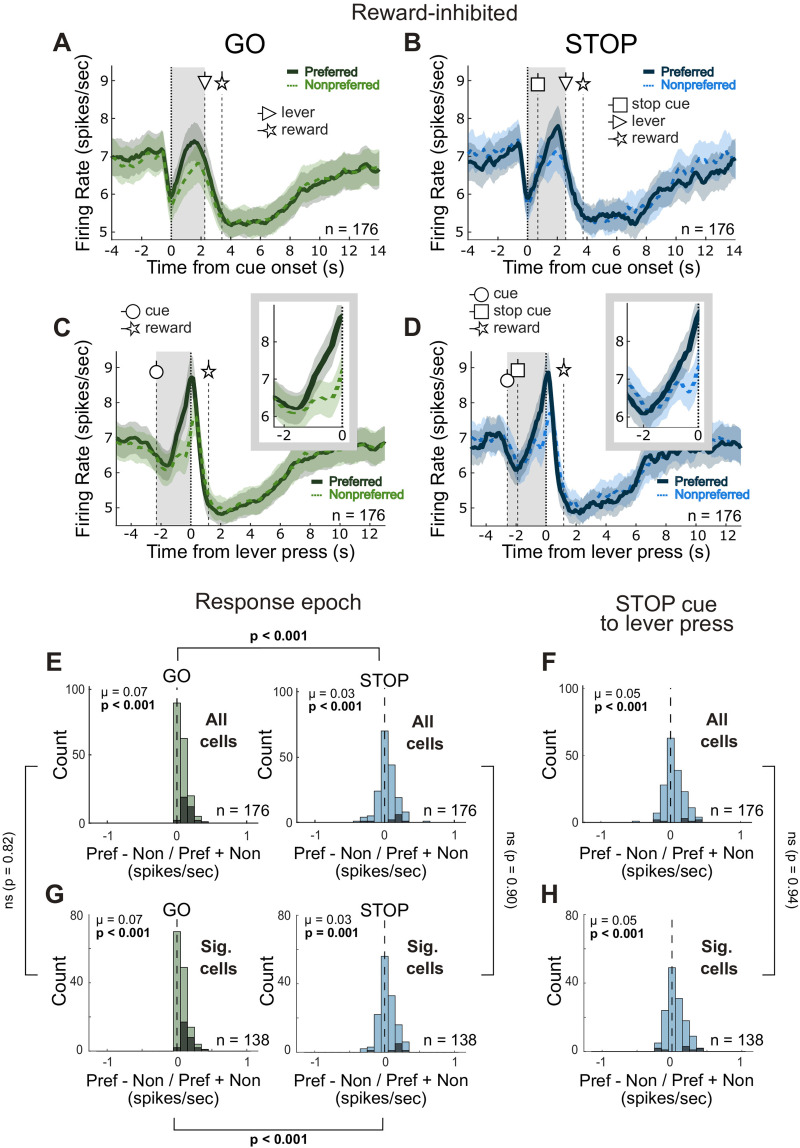
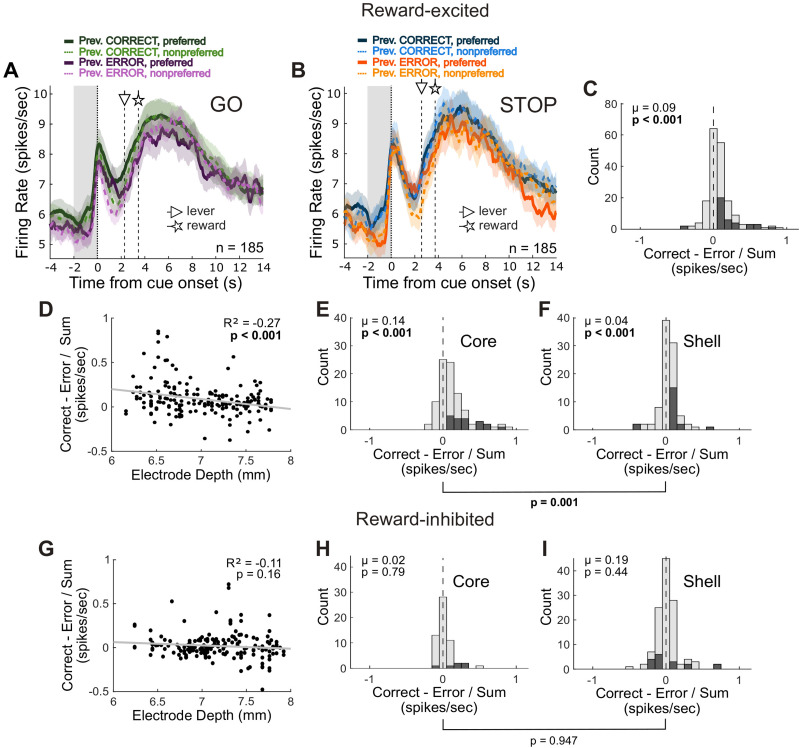
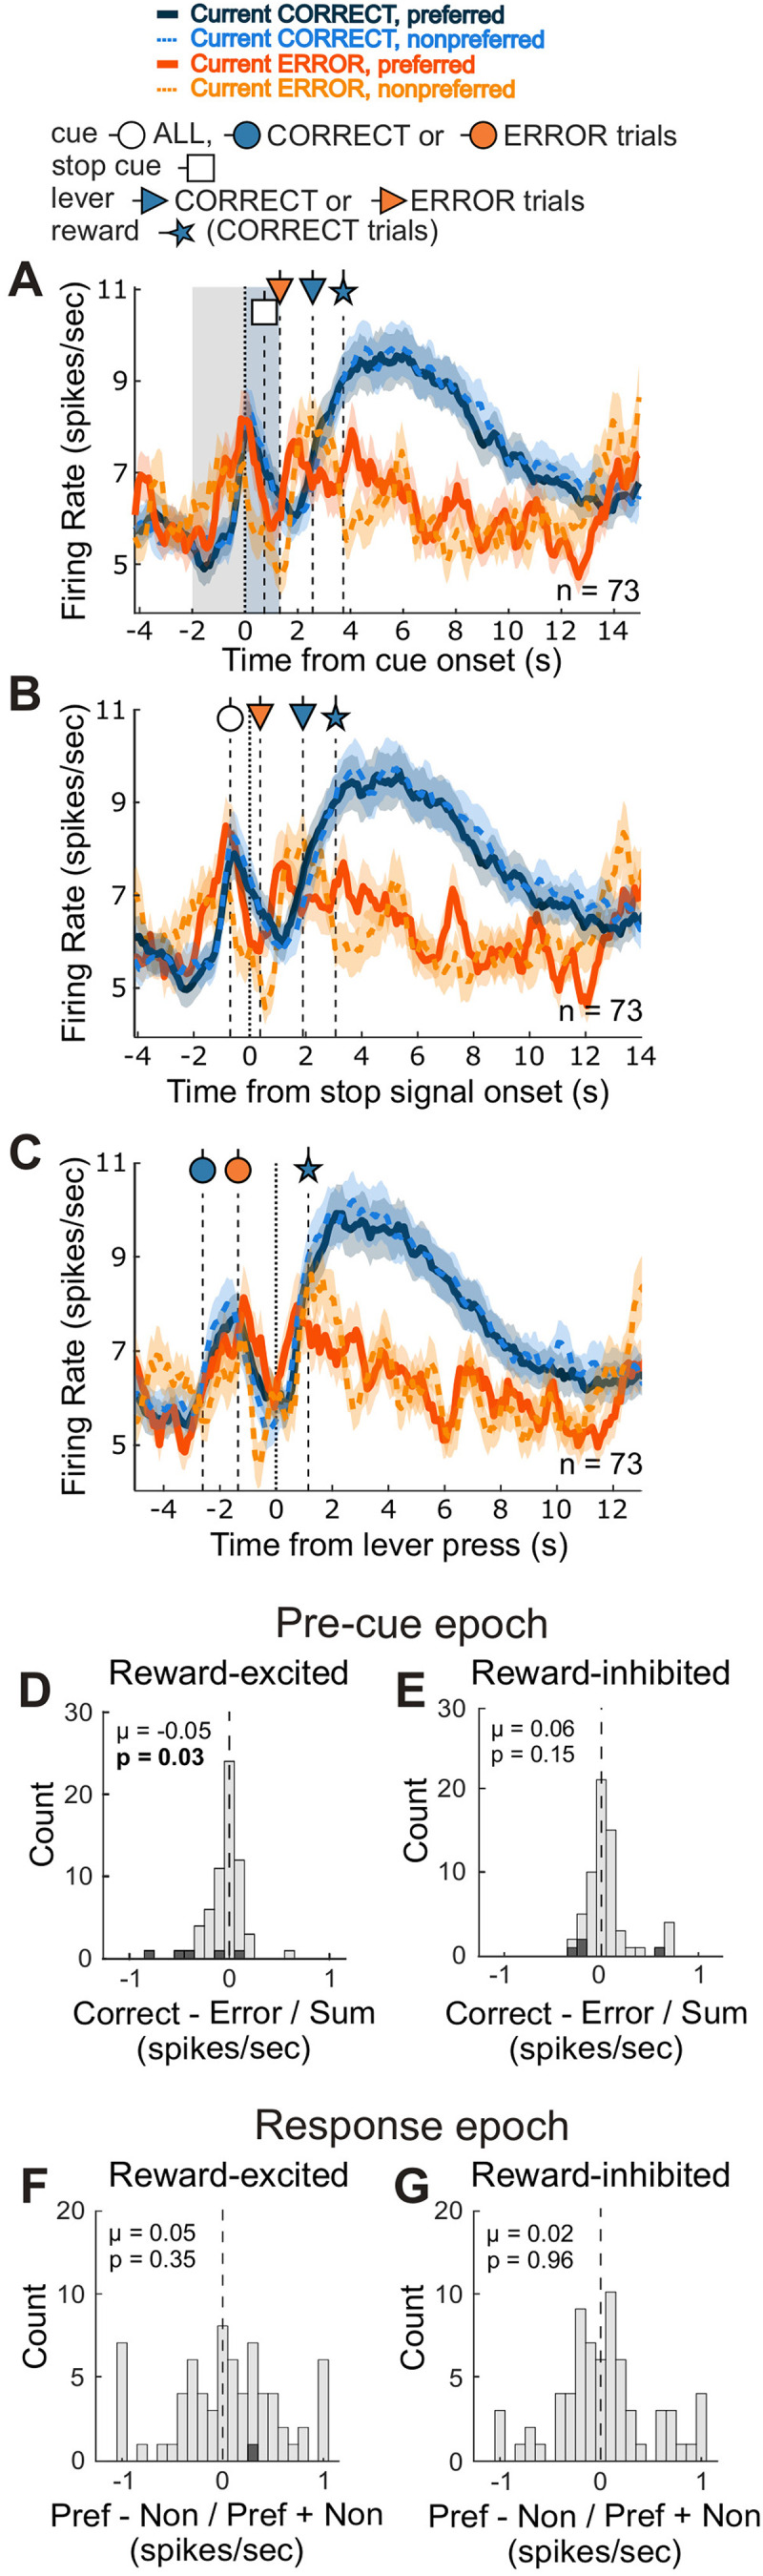
The nucleus accumbens (NAc) is thought to contribute to motivated behavior by signaling the value of reward-predicting cues and the delivery of anticipated reward. The NAc is subdivided into core and shell, with each region containing different populations of neurons that increase or decrease firing to rewarding events. While there are numerous theories of functions pertaining to these subregions and cell types, most are in the context of reward processing, with fewer considering that the NAc might serve functions related to action selection more generally. We recorded from single neurons in the NAc as rats of both sexes performed a STOP-change task that is commonly used to study motor control and impulsivity. In this task, rats respond quickly to a spatial cue on 80% of trials (GO) and must stop and redirect planned movement on 20% of trials (STOP). We found that the activity of reward-excited neurons signaled accurate response direction on GO, but not STOP, trials and that these neurons exhibited higher precue firing after correct trials. In contrast, reward-inhibited neurons significantly represented response direction on STOP trials at the time of the instrumental response. Finally, the proportion of reward-excited to reward-inhibited neurons and the strength of precue firing decreased as the electrode traversed the NAc. We conclude that reward-excited cells (more common in core) promote proactive action selection, while reward-inhibited cells (more common in shell) contribute to accurate responding on STOP trials that require reactive suppression and redirection of behavior.

Keywords: action selection; impulsivity; inhibition; nucleus accumbens; rat; single unit; stop-signal.


Conflict of interest statement

The authors declare no competing financial interests.

Figures

Figure 1.
Figure 1.
Task design and behavioral analysis. A, Overview of general task sequence. Following houselight illumination, rats held a nose poke in the central fluid well for 200 ms at which point a directional cue light illuminated on either the left or right side. On 80% of trials (GOs; green), this light indicated the direction the rat can respond by pressing the corresponding lever to receive reward; in this example, that is the right side. On 20% of trials (STOPs; blue), the opposite cue light illuminated after the first GO cue that instructed rats to cancel their initial response in the direction of the first cue and instead respond in the direction of the second cue. Left and right trials were randomized. There were four basic trial types: GO-left, GO-right, STOP-right-go-left, and STOP-left-go-right. B, Percentage correct on GO and STOP trials, averaged over all recording sessions (n = 170). C, Percentage correct on GO and STOP trials when the preceding trial was correctly performed (solid bars) or an errant response (hatched bars), averaged over sessions in which there was at least one GO and STOP trial after both correct and error preceding trials (n = 95). Please note that by selecting sessions in this way, the overall percent is lower in C compared with B. D, Reaction time (time from cue light onset to lever press) on GO and STOP trials when the current trial was correct (solid bars) or error (hatched bars), averaged over all sessions (n = 170). In B–D, green and blue points represent a session mean and white points represent the mean across each individual rat's sessions. Error bars represent ±SEM. Asterisks represent planned comparisons revealing statistically significant differences (two-way ANOVA or Tukey post hoc p < 0.05). E, Location of recording sites (Paxinos and Watson, 2006). F, Heatmap of z-scored normalized neuronal activity across all rewarded trials, aligned to directional cue light onset and sorted by average firing over the trial. Normalization was performed by subtracting the mean baseline firing rate and dividing by the standard deviation. Triangle- and star-headed arrows indicate average times of lever press and reward delivery onset, respectively. Each line represents a cell (n = 361). G, Scatterplot showing the reward-excited:reward-inhibited index (reward epoch − baseline epoch / reward epoch + baseline epoch) and electrode depth relative to the brain surface for each neuron. Teal points are cells for which there was a significant difference in firing during the reward epoch compared to the baseline epoch.
Figure 2.
Figure 2.
Reward-excited cells fire strongly to cue onset and encode direction on GOs. A–D, Population histograms for reward-excited cells (n = 185) aligned to cue onset (A and B) or lever press (C and D) for correct GO (A and C) and correct STOP (B and D) trials. Line thickness indicates preferred direction (thick/solid, preferred; thin/dashed, nonpreferred), which was defined as the direction that elicited the strongest response across correct GO trials during the response epoch (cue light onset to lever press, denoted by the gray-shaded area) for each neuron. Vertical-dashed lines with circle-, square-, triangle-, and star-headed arrows indicate the average times of cue onset, STOP cue onset, lever press, and reward delivery onset, respectively, for each trial type. Insets in C and D show activity during the response epoch. Ribbons represent SEM. E, Distribution of directional indices (preferred − nonpreferred / preferred + nonpreferred) computed during the response epoch for correct GO and correct STOP trials (Wilcoxon test, µ = mean) for all reward-excited cells (n = 185). Brackets indicate the p-value for the direct comparison between the distributions for GOs and STOPs (Wilcoxon signed-rank test). F, Distribution of directional indices computed during the period between STOP cue onset and lever press for all reward-excited cells (n = 185). G, H, same as E and F, but analysis was restricted to only the reward-excited cells whose firing during the reward epoch was significantly higher than firing during the baseline epoch (n = 152; Wilcoxon signed-rank, p < 0.05). Brackets between E/G and F/H indicate the p-value for the direct comparison between the distributions from all reward-excited cells and significant reward-excited cells (Wilcoxon rank-sum test, p < 0.05). Black bars in E–H indicate individual cells for which the difference in firing between preferred and nonpreferred directions was significant (Wilcoxon test, p < 0.05).
Figure 3.
Figure 3.
Reward-inhibited cells fire strongly to the lever press and encode direction on both trial types. A–D, Population histograms for reward-inhibited cells (n = 176) aligned to cue onset (A and B) or lever press (C and D) for correct GO (A and C) and correct STOP (B and D) trials. Line thickness indicates the preferred direction (thick/solid, preferred; thin/dashed, nonpreferred) and the gray-shaded area denotes the response epoch. Vertical dashed lines with circle-, square-, triangle-, and star-headed arrows indicate the average times of cue onset, STOP cue onset, lever press, and reward delivery onset, respectively, for each trial type. Insets in C and D show the activity during the response epoch. Ribbons represent SEM. E, Distribution of directional indices (preferred − nonpreferred / preferred + nonpreferred) computed during the response epoch for correct GO and correct STOP trials (Wilcoxon test, µ = mean) for all reward-inhibited cells (n = 176). Brackets indicate the p-value for the direct comparison between the distributions for GOs and STOPs (Wilcoxon signed-rank test). F, Distribution of directional indices computed during the period between STOP cue onset and lever press for all reward-inhibited cells (n = 176). G, H, same as E and F, but analysis was restricted to only the reward-inhibited cells whose firing during the reward epoch was significantly lower than firing during the baseline epoch (n = 138; Wilcoxon signed-rank, p < 0.05). Brackets between E/G and F/H indicate the p-value for the direct comparison between the distributions from all reward-inhibited cells and significant reward-inhibited cells (Wilcoxon rank-sum test, p < 0.05). Black bars in E–H indicate individual cells for which the difference in firing between preferred and nonpreferred directions was significant (Wilcoxon test, p < 0.05).
Figure 4.
Figure 4.
Reward-excited cell encoding of trial outcome history is amplified in the NAc core. A, B, Population histograms of reward-excited cells (n = 185) aligned to cue onset for correct GO (A) and correct STOP (B) trials. Line thickness indicates direction, preferred (thick/solid) or nonpreferred (thin/dashed). Line color indicates whether the preceding trial was correct (GO, greens; STOP, blues) or an error (GO, purples; STOP, oranges). Triangle- and star-headed arrows indicate the average times of lever press and reward delivery onset, respectively, for each trial type. Grey shading indicates the precue epoch. Ribbons represent SEM. C, Distribution of correctness indices (previous trial correct − prev. trial error / prev. correct + prev. error) for reward-excited cells computed during the precue epoch across all correct trials. Shaded bars reflect counts of within-cell significant comparisons. D, Scatterplot showing reward-excited cell correctness indices across electrode depth. E, F, Distributions of correctness indices from reward-excited cells recorded in the core (E) or shell (F) subregions of the NAc. G, Scatterplot showing precue correctness indices across electrode depth for reward-inhibited cells. H, I, Distributions of correctness indices from reward-inhibited cells recorded in the core (H) or shell (I). Brackets indicate the p-value for the direct comparison between the distributions from the core and shell (Wilcoxon rank-sum test).
Figure 5.
Figure 5.
Higher firing prior to cue light illumination precedes errant responses on STOPs. A–C, Population histograms of reward-excited cells (n = 73) aligned to illumination of the first cue (A), the STOP cue (B) or the lever press (C) on correct and error STOP trials. Line thickness indicates direction, preferred (thick/solid) or nonpreferred (thin/dashed). Line color indicates whether the current trial was correct (blues) or errant (oranges). Vertical-dashed lines with circle-, square-, triangle-, and star-headed arrows indicate the average times of initial cue onset, STOP cue onset, lever press, and reward delivery onset, respectively, and their fill color denotes whether that time is specific to correct (blue) or error (orange) trials. Grey- and blue-shaded areas in A represent the precue and response epochs, respectively. Ribbons represent SEM. D, E, Distribution of correctness indices (previous trial correct − prev. trial error / prev. correct + prev. error) computed during the precue epoch for reward-excited cells (n = 73; D) and reward-inhibited cells (n = 69; E). F, G, Distribution of directional indices (preferred − nonpreferred / preferred + nonpreferred) computed during the response epoch of errant STOP trials for reward-excited (F) and reward-inhibited (G) cells. Shaded bars reflect counts of within-cell significant comparisons.

Similar articles

Cited by

References

    1. Ambroggi F, Ghazizadeh A, Nicola SM, Fields HL (2011) Roles of nucleus accumbens core and shell in incentive-cue responding and behavioral inhibition. J Neurosci 31:6820–6830. 10.1523/JNEUROSCI.6491-10.2011 - DOI - PMC - PubMed
    1. Barto AG (1995) Adaptive critics and the basal ganglia. In: Models of information processing in the basal ganglia (Houk JC, Davis JL, Beiser DG, eds), pp 215–232. Cambridge, MA: MIT Press.
    1. Berridge KC, Robinson TE (1998) What is the role of dopamine in reward: hedonic impact, reward learning, or incentive salience? Brain Res Brain Res Rev 28:309–369. 10.1016/S0165-0173(98)00019-8 - DOI - PubMed
    1. Bissonette GB, Burton AC, Gentry RN, Goldstein BL, Hearn TN, Barnett BR, Kashtelyan V, Roesch MR (2013) Separate populations of neurons in ventral striatum encode value and motivation. PLoS One 8:e64673. 10.1371/journal.pone.0064673 - DOI - PMC - PubMed
    1. Bowman E, Aigner T, Richmond B (1996) Neural signals in the monkey ventral striatum related to motivation for juice and cocaine rewards. J Neurophysiol 75:1061–1073. 10.1152/jn.1996.75.3.1061 - DOI - PubMed

LinkOut - more resources