

Light-evoked deformations in rod photoreceptors, pigment epithelium and subretinal space revealed by prolonged and multilayered optoretinography
- PMID: 38898002
- PMCID: PMC11186825
- DOI: 10.1038/s41467-024-49014-5
Light-evoked deformations in rod photoreceptors, pigment epithelium and subretinal space revealed by prolonged and multilayered optoretinography
Abstract
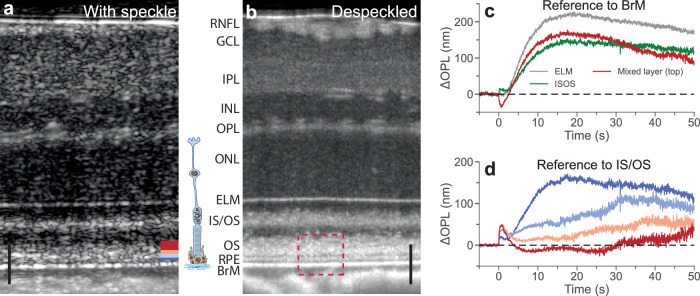
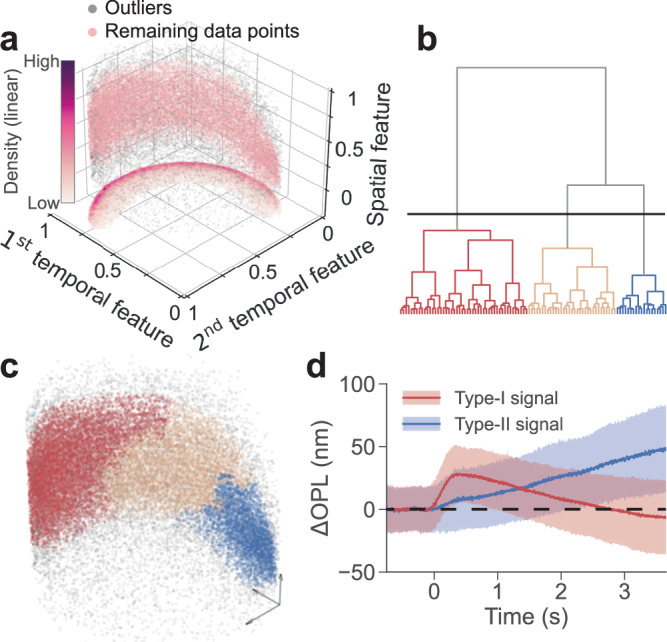
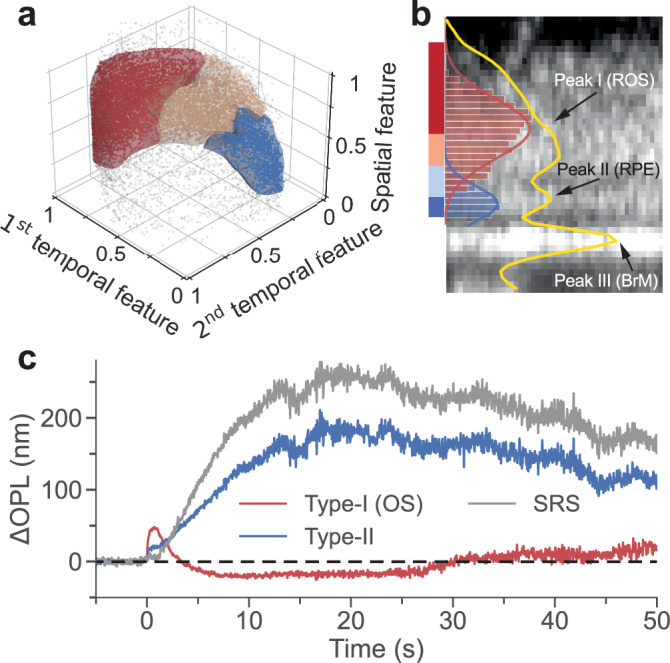
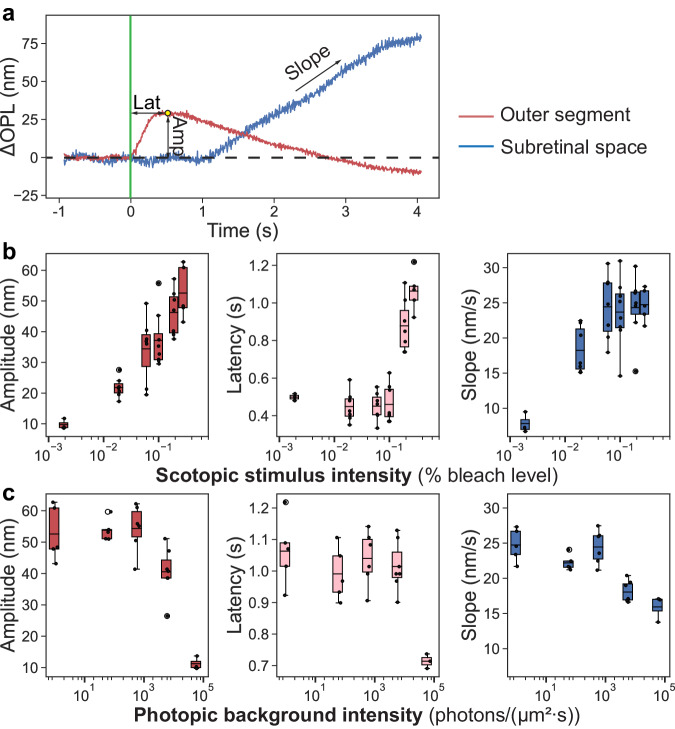
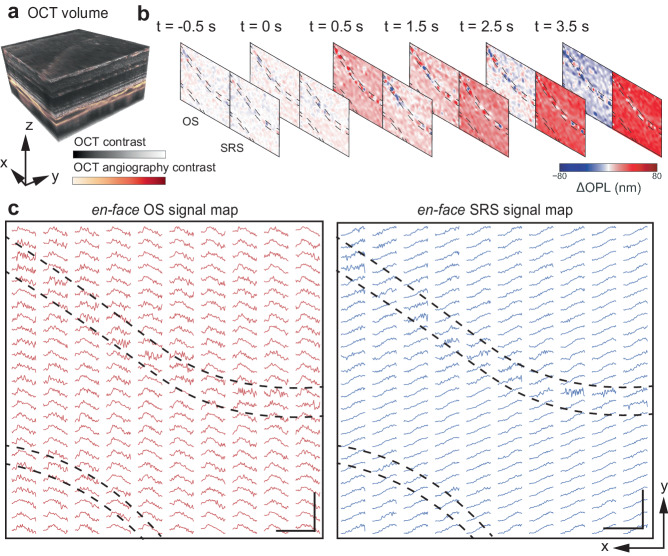
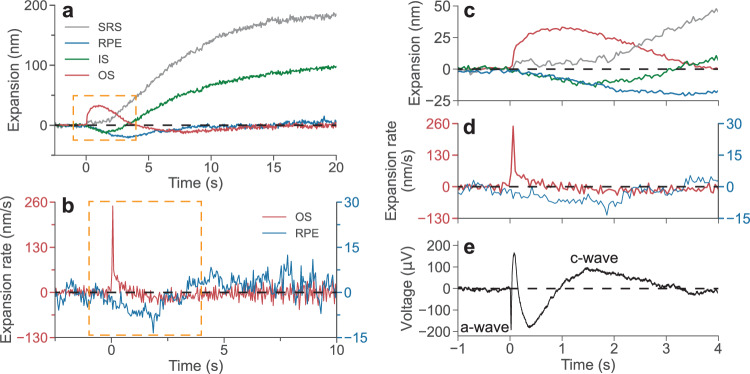
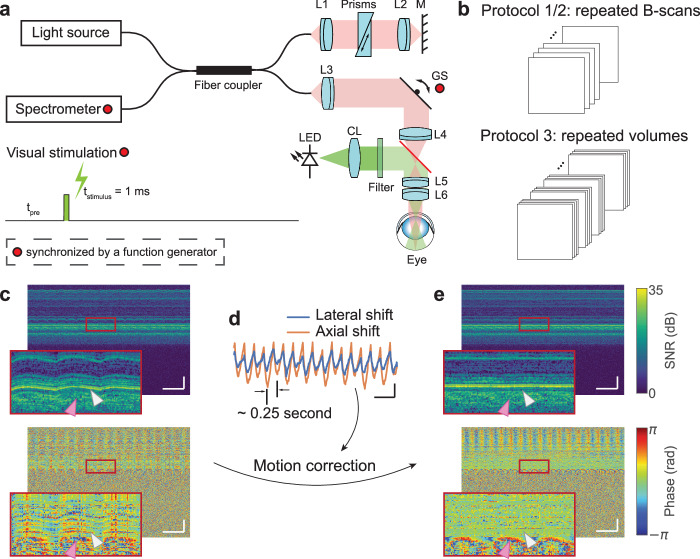
Phototransduction involves changes in concentration of ions and other solutes within photoreceptors and in subretinal space, which affect osmotic pressure and the associated water flow. Corresponding expansion and contraction of cellular layers can be imaged using optoretinography (ORG), based on phase-resolved optical coherence tomography (OCT). Until now, ORG could reliably detect only photoisomerization and phototransduction in photoreceptors, primarily in cones under bright stimuli. Here, by employing a phase-restoring subpixel motion correction algorithm, which enables imaging of the nanometer-scale tissue dynamics during minute-long recordings, and unsupervised learning of spatiotemporal patterns, we discover optical signatures of the other retinal structures' response to visual stimuli. These include inner and outer segments of rod photoreceptors, retinal pigment epithelium, and subretinal space in general. The high sensitivity of our technique enables detection of the retinal responses to dim stimuli: down to 0.01% bleach level, corresponding to natural levels of scotopic illumination. We also demonstrate that with a single flash, the optoretinogram can map retinal responses across a 12° field of view, potentially replacing multifocal electroretinography. This technique expands the diagnostic capabilities and practical applicability of optoretinography, providing an alternative to electroretinography, while combining structural and functional retinal imaging in the same OCT machine.
© 2024. The Author(s).
Conflict of interest statement
B.T., H.L., L.S., and T.L. are inventors on a PCT patent application (PCT/SG2024/050050) related to unsupervised signal classification and processing for optoretinography. The other authors declare no competing interests.
Figures
Similar articles
-
Photopic flicker optoretinography captures the light-driven length modulation of photoreceptors during phototransduction.Proc Natl Acad Sci U S A. 2025 Feb 18;122(7):e2421722122. doi: 10.1073/pnas.2421722122. Epub 2025 Feb 13. Proc Natl Acad Sci U S A. 2025. PMID: 39946535 Free PMC article.
-
Polarization optical coherence tomography optoretinography: verifying light-induced photoreceptor outer segment shrinkage and subretinal space expansion.Neurophotonics. 2025 Jan;12(1):015005. doi: 10.1117/1.NPh.12.1.015005. Epub 2025 Jan 27. Neurophotonics. 2025. PMID: 39872019 Free PMC article.
-
Quantification of intrinsic optical signals in the outer human retina using optical coherence tomography.Ann N Y Acad Sci. 2022 Apr;1510(1):145-157. doi: 10.1111/nyas.14721. Epub 2021 Dec 10. Ann N Y Acad Sci. 2022. PMID: 34893981 Free PMC article.
-
OCT imaging of rod mitochondrial respiration in vivo.Exp Biol Med (Maywood). 2021 Oct;246(20):2151-2158. doi: 10.1177/15353702211013799. Epub 2021 May 22. Exp Biol Med (Maywood). 2021. PMID: 34024141 Free PMC article. Review.
-
[Physiology of the visual retinal signal: From phototransduction to the visual cycle].J Fr Ophtalmol. 2017 Mar;40(3):239-250. doi: 10.1016/j.jfo.2016.12.006. Epub 2017 Mar 17. J Fr Ophtalmol. 2017. PMID: 28318721 Review. French.
Cited by
-
Light-adapted flicker-optoretinography based on raster-scan optical coherence tomography towards clinical translation.Biomed Opt Express. 2024 Sep 26;15(10):6036-6051. doi: 10.1364/BOE.538481. eCollection 2024 Oct 1. Biomed Opt Express. 2024. PMID: 39421778 Free PMC article.
-
Retinal thermal deformations measured with phase-sensitive optical coherence tomography in vivo.Light Sci Appl. 2025 Apr 2;14(1):151. doi: 10.1038/s41377-025-01798-x. Light Sci Appl. 2025. PMID: 40175338 Free PMC article.
-
Assessing structure - Function relationships in non-neovascular age-related macular degeneration.Exp Eye Res. 2025 Jun;255:110349. doi: 10.1016/j.exer.2025.110349. Epub 2025 Mar 22. Exp Eye Res. 2025. PMID: 40127748 Review.
-
Phase-restoring subpixel image registration: enhancing motion detection performance in Fourier-domain optical coherence tomography.J Phys D Appl Phys. 2025 Apr 7;58(14):145102. doi: 10.1088/1361-6463/adb3b4. Epub 2025 Feb 21. J Phys D Appl Phys. 2025. PMID: 39989502 Free PMC article.
-
Photopic flicker optoretinography captures the light-driven length modulation of photoreceptors during phototransduction.Proc Natl Acad Sci U S A. 2025 Feb 18;122(7):e2421722122. doi: 10.1073/pnas.2421722122. Epub 2025 Feb 13. Proc Natl Acad Sci U S A. 2025. PMID: 39946535 Free PMC article.
References
MeSH terms
Grants and funding
- NMRC/CG/C010A/2017/MOH | National Medical Research Council (NMRC)
- NRF-CRP24-2020-0001/National Research Foundation Singapore (National Research Foundation-Prime Minister's office, Republic of Singapore)
- P30 EY026877/EY/NEI NIH HHS/United States
- RS19/20/Ministry of Education - Singapore (MOE)
- RG28/21/Ministry of Education - Singapore (MOE)
- NMRC/CG/M010/2017/Pre-Clinical/MOH | National Medical Research Council (NMRC)
- TA/MOH-000249-00/2018/MOH | National Medical Research Council (NMRC)
- MOH-OFIRG20nov-0014/MOH | National Medical Research Council (NMRC)
- NRF2019-THE002-0006/National Research Foundation Singapore (National Research Foundation-Prime Minister's office, Republic of Singapore)
- U01 EY032055/EY/NEI NIH HHS/United States
- FA9550-20-1-0186/United States Department of Defense | United States Air Force | AFMC | Air Force Office of Scientific Research (AF Office of Scientific Research)
- OFLCG/004c/2018/MOH | National Medical Research Council (NMRC)
- Startup Grant/Nanyang Technological University (NTU)
- OFIRG/0048/2017/MOH | National Medical Research Council (NMRC)
- U01 EY025501/EY/NEI NIH HHS/United States
- A20H4b0141/Agency for Science, Technology and Research (A*STAR)
- CG/C010A/2017_SERI/MOH | National Medical Research Council (NMRC)
- NRF-NRFF14-2022-0005/National Research Foundation Singapore (National Research Foundation-Prime Minister's office, Republic of Singapore)
LinkOut - more resources
Full Text Sources
