. 2024 Jun 19;15(1):5237.
doi: 10.1038/s41467-024-49512-6.

Therapy-induced secretion of spliceosomal components mediates pro-survival crosstalk between ovarian cancer cells

Affiliations

Therapy-induced secretion of spliceosomal components mediates pro-survival crosstalk between ovarian cancer cells

Victoria O Shender et al. Nat Commun. .

Erratum in

  • Author Correction: Therapy-induced secretion of spliceosomal components mediates pro-survival crosstalk between ovarian cancer cells.
    Shender VO, Anufrieva KS, Shnaider PV, Arapidi GP, Pavlyukov MS, Ivanova OM, Malyants IK, Stepanov GA, Zhuravlev E, Ziganshin RH, Butenko IO, Bukato ON, Klimina KM, Veselovsky VA, Grigorieva TV, Malanin SY, Aleshikova OI, Slonov AV, Babaeva NA, Ashrafyan LA, Khomyakova E, Evtushenko EG, Lukina MM, Wang Z, Silantiev AS, Nushtaeva AA, Kharlampieva DD, Lazarev VN, Lashkin AI, Arzumanyan LK, Petrushanko IY, Makarov AA, Lebedeva OS, Bogomazova AN, Lagarkova MA, Govorun VM. Shender VO, et al. Nat Commun. 2024 Jul 31;15(1):6450. doi: 10.1038/s41467-024-50958-x. Nat Commun. 2024. PMID: 39085258 Free PMC article. No abstract available.

Abstract

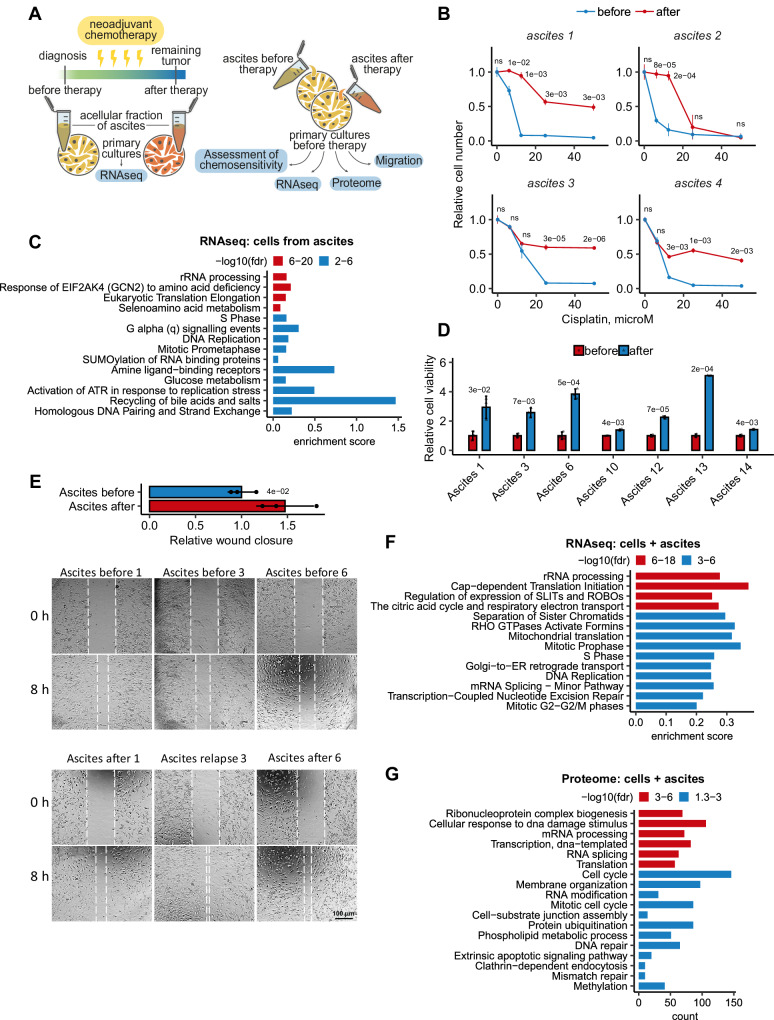
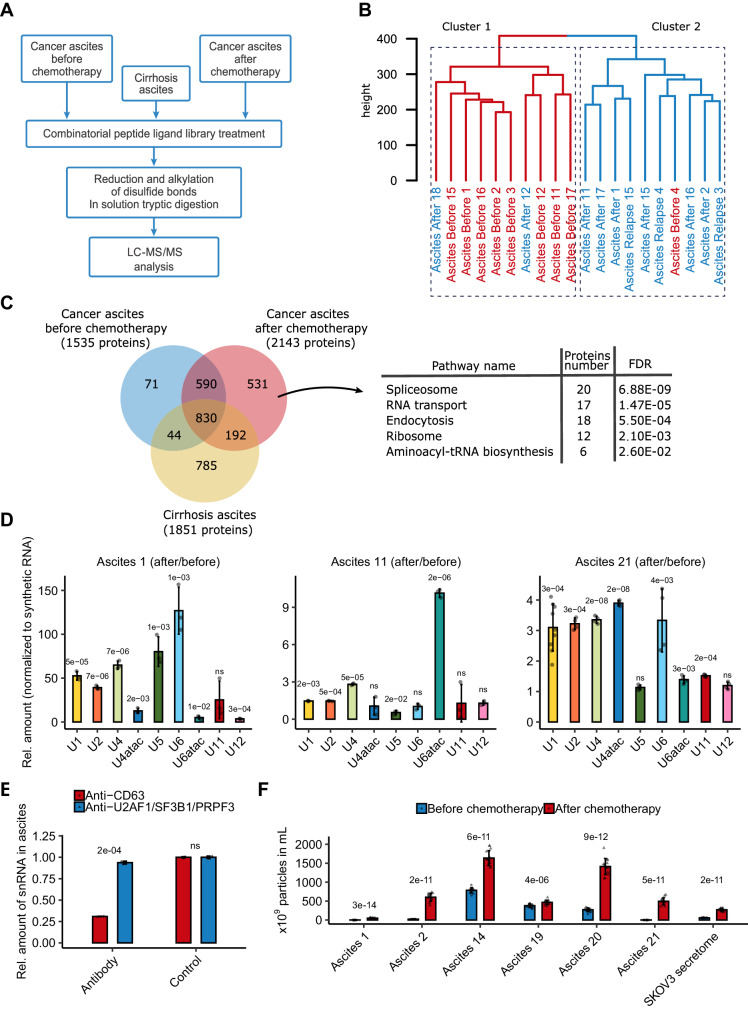
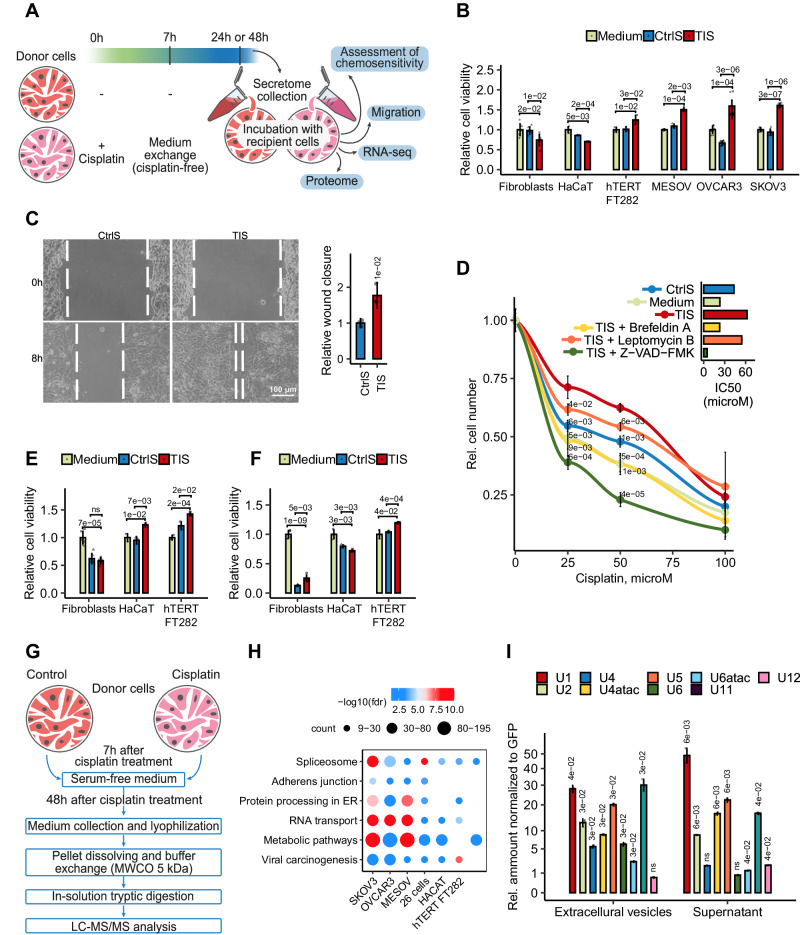
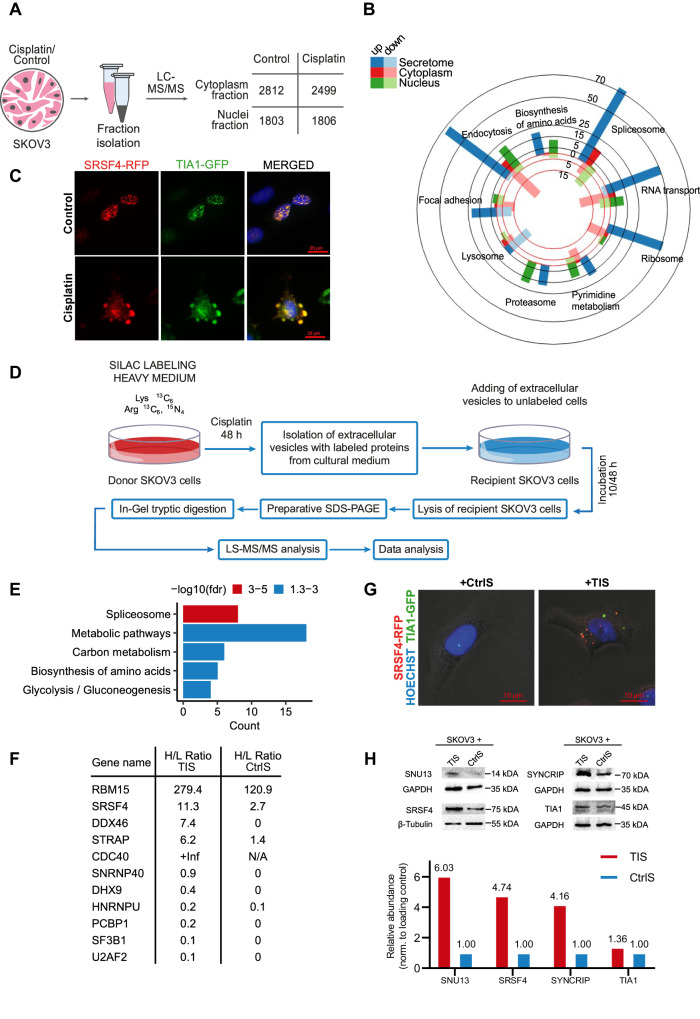
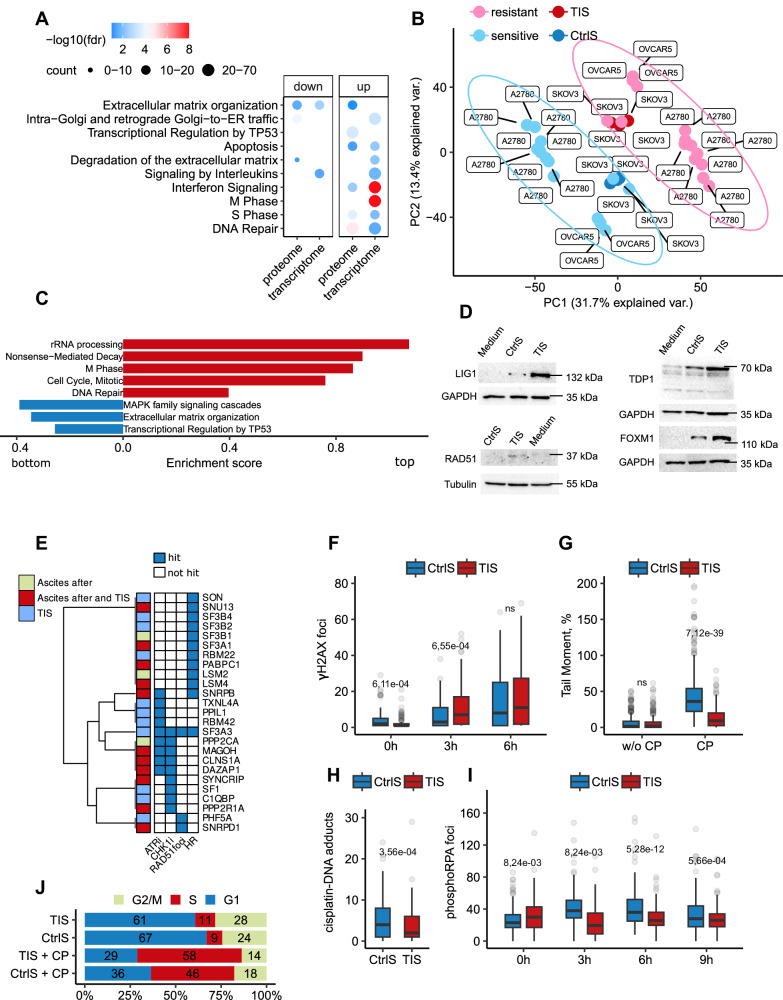
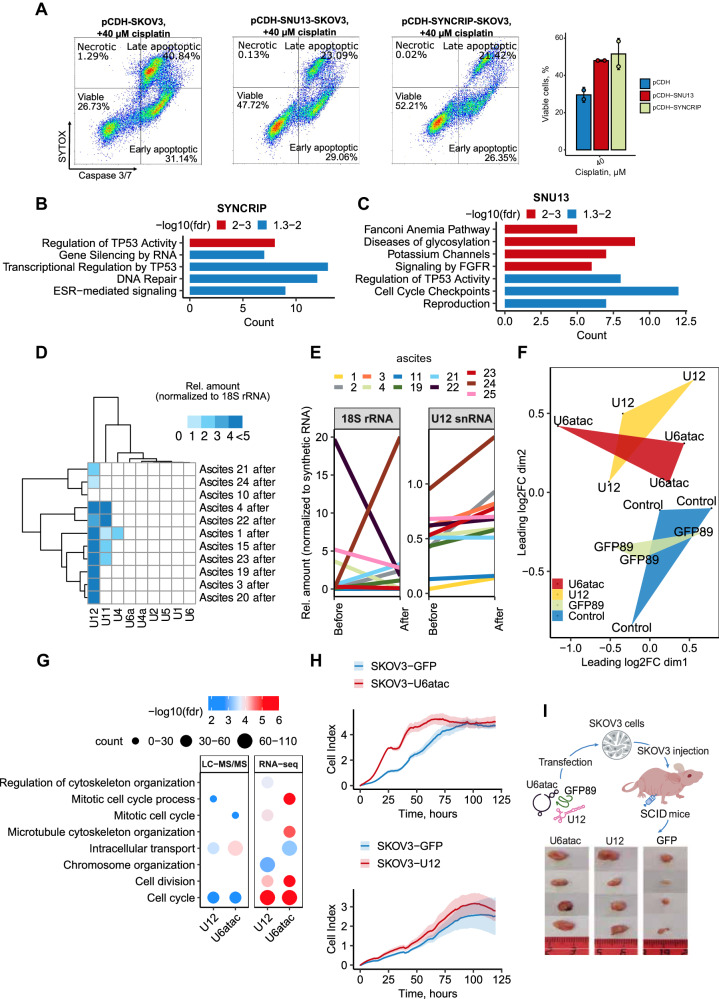
Ovarian cancer often develops resistance to conventional therapies, hampering their effectiveness. Here, using ex vivo paired ovarian cancer ascites obtained before and after chemotherapy and in vitro therapy-induced secretomes, we show that molecules secreted by ovarian cancer cells upon therapy promote cisplatin resistance and enhance DNA damage repair in recipient cancer cells. Even a short-term incubation of chemonaive ovarian cancer cells with therapy-induced secretomes induces changes resembling those that are observed in chemoresistant patient-derived tumor cells after long-term therapy. Using integrative omics techniques, we find that both ex vivo and in vitro therapy-induced secretomes are enriched with spliceosomal components, which relocalize from the nucleus to the cytoplasm and subsequently into the extracellular vesicles upon treatment. We demonstrate that these molecules substantially contribute to the phenotypic effects of therapy-induced secretomes. Thus, SNU13 and SYNCRIP spliceosomal proteins promote therapy resistance, while the exogenous U12 and U6atac snRNAs stimulate tumor growth. These findings demonstrate the significance of spliceosomal network perturbation during therapy and further highlight that extracellular signaling might be a key factor contributing to the emergence of ovarian cancer therapy resistance.


Conflict of interest statement

The authors declare no competing interests.

Figures

Fig. 1
Fig. 1. Ovarian cancer ascites after chemotherapy contributes to de novo therapy resistance.
A Scheme showing the collection and processing of paired ascitic fluids isolated from patients before and after chemotherapy (left panel). Experimental workflow used to assess the effect of paired ascitic fluids before and after chemotherapy on phenotype and behavior of primary cultures of ovarian cancer cells (right panel). B In vitro viability assay of ovarian cancer cells isolated from paired ascites before (blue curves) and after (red curves) chemotherapy and subsequently treated with different concentrations of cisplatin. Dose-response curves of ovarian cancer cells were determined by an MTT assay on day 2 after cisplatin adding. The data represent the mean values ± SD (standard deviation) (n = 3 biologically independent experiments). С GSEA analysis of gene expression in ovarian cancer cells isolated from ascites after chemotherapy versus cells isolated from ascites before therapy. The X-axis represents GSEA enrichment score. D Primary cultures of ovarian cancer cells were pre-incubated for 3 days with autologous ascites before (blue bars) and after (red bars) chemotherapy, and then cancer cells were treated with cisplatin (10 µM). In vitro cell viability was assessed on day 2 after cisplatin adding using MTT assay. The data represent the mean values ± SD (n = 3 biologically independent experiments). E Wound healing assay of primary cultures of ovarian cancer cells that were pre-incubated for 3 days with autologous ascites before and after chemotherapy. The width of the wound area was measured immediately after scratching (0 h) and the relative closure was measured after 8 h for three primary cultures of ovarian cancer cells. The bar graph illustrates wound closure, expressed as the fold change, denoting the ratio of mean values of wound widths between two states: cell cultures pre-treated with ascites after chemotherapy relative to cells pre-treated with ascites before chemotherapy. The data represent the mean values ± SD (n = 3 biologically independent experiments). F GSEA analysis of gene expression in ovarian cancer cells pre-incubated for 3 days with autologous ascites after chemotherapy versus ascites before therapy. The X-axis represents GSEA enrichment score (p-values are indicated by colors). G Gene Ontology enrichment analysis of proteins whose abundance increased at least 2 times in ovarian cancer cell cultures incubated for 3 days with autologous ascites after chemotherapy versus ascites before therapy. The X-axis represents the number of proteins associated with each pathway (p-values are indicated by colors). The p-value was obtained by two-tailed unpaired Student’s t test (B, D, E). ClusterProfiler was used for functional enrichment analysis with all genes as background (G). Gene expression signature analysis was performed using the “signatureSearch” packages in “R” against the Reactome database (C, F). A hypergeometric test was carried out and all significant categories (false discovery rate < 0.05, after correction for multiple testing using the Benjamini–Hochberg procedure) are displayed. Source data are provided as a Source Data file.
Fig. 2
Fig. 2. Malignant ascitic fluids after chemotherapy are enriched with spliceosomal components.
A Experimental scheme for proteomic analysis of the ascites samples. B Hierarchical clustering dendrogram of proteomic profiles of paired ascitic fluids before (red) and after (blue) chemotherapy. C Left panel: Venn diagram representing the proteins identified in ovarian cancer ascitic fluids before chemotherapy (blue circle), ovarian cancer ascitic fluids after chemotherapy (red circle), and cirrhosis ascitic fluids (yellow circle, according to our previously published data). Right panel: Results of the KEGG enrichment analysis of proteins identified only in ovarian cancer ascites after chemotherapy (p-values are indicated). D RT-qPCR analysis of 9 spliceosomal snRNAs in paired ascitic fluids before and after chemotherapy. Bars represent the level of each snRNA in ascitic fluid after therapy compared to samples before therapy (n = 3 biologically independent samples). Data represent the mean values ± SD (standard deviation). E RT-qPCR analysis of spliceosomal snRNAs in pool of ascitic fluids from 3 patients after immunodepletion of snRNP complexes (using a mix of antibodies against U2AF1, SF3B1, and PRPF8) or extracellular vesicles (using an antibody against CD63) (n = 3 biologically independent samples). Data represent the mean values ± SD. F Nanoparticle tracking analysis of extracellular vesicles isolated from paired ovarian cancer ascitic fluids or secretomes (secretomes were collected as indicated in Fig. 3B) before (blue) and after (red) chemotherapy (n = 14 biologically independent samples). Data represent the mean values ± SD. The p-value was obtained by two-tailed unpaired Student’s t test (D, E, F). Source data are provided as a Source Data file.
Fig. 3
Fig. 3. Therapy-induced secretomes of ovarian cancer cells promote cell chemoresistance in vitro.
A Experimental workflow used to assess the effect of therapy-induced secretomes on the behavior of ovarian cancer cells. B Secretomes were obtained from donor Fibroblasts, HaCaT, hTERT FT282, SKOV3, MESOV or OVCAR3 cells that were treated or untreated with cisplatin (40 µM for SKOV3 cells, 60 µM for MESOV cells, 25 µM for OVCAR3 and HaCaT cells, and 80 µM for Fibroblasts and hTERT FT282) for 7 h, then washed three times with PBS and cultured in serum-free media for 41 h. Recipient cells were incubated with corresponding therapy-induced (TIS; red bars) or control (CtrlS; blue bars) secretomes, or with fresh culture media (Medium; green bars) for 3 days, and then treated with cisplatin (10 µM for SKOV3, MESOV, hTERT FT282, and HaCaT cells, 7 µM for OVCAR3, and 40 µM for Fibroblasts). In vitro cell viability was assessed on day 2 after cisplatin adding. The data represent the mean values ± SD (n = 3 biologically independent experiments). C Wound healing assay of SKOV3 cells that were pre-incubated with TIS or CtrlS for 3 days (secretomes were collected as indicated in Fig. 3B). The width of the wound area was measured immediately after scratching (0 h) and the relative closure was measured after 8 h. The bar graph illustrates wound closure, expressed as the fold change, denoting the ratio of mean values of wound widths between two states: cells pre-treated with TIS relative to cells pre-treated with CtrlS. The data represent the mean values ± SD (n = 3 biologically independent experiments). D Donor SKOV3 cells were exposed to 40 µM of cisplatin in the presence of Z-VAD-FMK (50 µM), Brefeldin A (6 µg/ml), or Leptomycin B (37 nM) for 7 h and then cells were washed three times with PBS and incubated in fresh serum-free media for 17 h. Recipient SKOV3 cells were incubated for 3 days with secretomes from treated (TIS) or untreated (CtrlS) donor cells, then recipient cells were treated with different concentrations of cisplatin for an additional 48 h. Dose-response curves and half-maximal inhibitory concentration (IC50) values of cisplatin were determined using MTT assay. The data represent the mean values ± SD (n = 3 biologically independent experiments). E Recipient SKOV3 cells were incubated for 3 days with TIS or CtrlS from donor Fibroblasts, hTERT FT282, or HaCaT cells (secretomes were collected as indicated in Fig. 3B). After incubation, recipient SKOV3 cells were treated with cisplatin (10 µM). In vitro cell viability assay was performed on day 2 after cisplatin adding. The data represent the mean values ± SD (n = 3 biologically independent experiments). F Recipient Fibroblasts, hTERT FT282, or HaCaT cells were incubated for 3 days with TIS or CtrlS from donor SKOV3 cells (secretomes were collected as indicated in B). After incubation, recipient cells were treated with cisplatin (10 µM for HaCaT and hTERT FT282 cells and 40 µM for Fibroblasts). In vitro cell viability assay was performed on day 2 after cisplatin adding. The data represent the mean values ± SD (n = 3 biologically independent experiments). G Experimental workflow used for proteomic analysis of cell secretomes. H Dot plot shows the KEGG enrichment analysis of proteins whose abundance increased at least 2 times TIS compared to control secretomes from different cell lines. It represents all common pathways upregulated in TIS of 4 ovarian cancer cell lines. The size of the dot is based on protein count enriched in the pathway, and the color of the dot shows the pathway enrichment significance. I RT-qPCR analysis of spliceosomal snRNAs in therapy-induced and control secretomes of SKOV3 cells (extracellular vesicles’ fractions and supernatants were analyzed; secretomes were collected as indicated in Fig. 3B). Bars represent the level of each snRNA in therapy-induced secretomes compared to control secretomes. All data represent the mean values ± SD (n = 3 biologically independent experiments). The p-value was obtained by two-tailed unpaired Student’s t test (BF, I). Source data are provided as a Source Data file.
Fig. 4
Fig. 4. Splicing factors from drug-stressed cells are transferred to recipient cancer cells.
A Experimental workflow used for cell fractionation with subsequent proteomic analysis. B Bar diagram showing functional annotation (KEGG) of proteins that changed in abundance at least 2 times upon cisplatin treatment. The bar color indicates cell fraction: the blue represents a secretome fraction; the red represents a cytoplasmic fraction; the green represents a nuclear fraction. The bright colors indicate numbers of upregulated proteins for specific terms; the pale colors represent numbers of down-regulated proteins for corresponding terms. C Fluorescence images of SKOV3 cells co-expressing RFP-SRSF4 (red) and GFP-TIA1 (green) before and after treatment with 40 μM cisplatin for 7 h. Nuclei are stained by DAPI (blue). It was repeated with similar results in two independent experiments. D Experimental design used for SILAC experiment. E Results of the KEGG enrichment analysis of heavy-labeled proteins that were upregulated (at least 2 times) in recipient SKOV3 cells incubated with vesicles from dying cancer cells. STRING was used for functional enrichment analysis with all genes as background. A hypergeometric test was carried out and all significant categories (false discovery rate < 0.05, after correction for multiple testing using the Benjamini–Hochberg procedure) are displayed. F H/L ratio (heavy vs. light isotopes) for spliceosomal proteins 10 h after incubation with extracellular vesicles from secretomes of cisplatin-treated (TIS) or untreated (CtrlS) donor cells. G Immunofluorescence images of recipient SKOV3 cells incubated for 3 days with therapy-induced (TIS) or control secretomes (CtrlS) from donor SKOV3 overexpressing SRSF4-RFP and TIA1-GFP proteins (secretomes were collected as indicated in Fig. 3B). It was repeated with similar results in two independent experiments. H Western blotting analysis of SKOV3 cells that were incubated for 3 days with therapy-induced (TIS) or control secretomes (CtrlS) from donor SKOV3 (secretomes were collected as indicated in Fig. 3B). It was repeated with similar results in two independent experiments. Source data are provided as a Source Data file.
Fig. 5
Fig. 5. Therapy-induced secretomes of ovarian cancer cells activate pathways important for cell response to DNA damage.
A Gene Ontology enrichment analyses of upregulated genes and proteins in SKOV3 cells incubated for 3 days with therapy-induced secretomes (TIS) compared to control secretomes (CtrlS). The color scale refers to −log10 (FDR) values; the number of proteins/genes are represented by the diameter of the circles. B The principal component analysis of RNAseq data obtained from platinum-sensitive and -resistant isogenic ovarian cancer cell lines and recipient SKOV3 cells incubated for 3 days with TIS or CtrlS. Pink—platinum-resistant ovarian cancer cell lines, light blue—platinum-sensitive ovarian cancer cell lines, red—recipient SKOV3 cells incubated with TIS, dark blue—recipient SKOV3 cells incubated with CtrlS. C GSEA analysis of gene expression in platinum-resistant ovarian cancer cell lines versus platinum-sensitive ovarian cancer cell lines. The X-axis represents GSEA enrichment score (p-values are indicated by colors). D Western blotting analysis of SKOV3 cells that were incubated for 3 days with TIS or CtrlS from donor SKOV3. E Results of the intersection between spliceosomal proteins identified in TIS from SKOV3 cells and/or in ovarian cancer ascites after therapy (our data) and the hits from siRNA and CRISPR screenings (derived from data reported in refs. ). ATRi and CHK1i—CRISPR screens with inhibitors targeting ATR and CHK1, respectively. Loss of spliceosomal proteins indicated as “hit” increased the sensitivity of cancer cells to ATR or CHK1 inhibition [42]. RAD51 foci and HR—siRNA screenings indicating that knockdown of spliceosomal protein impair the formation of IR-induced RAD51 foci or decreased homologous recombination (HR) potential in the DR-GFP assay in cancer cells, respectively, ,. F Box plots show the number of γH2AX foci per nucleus in SKOV3 cells pre-incubated with TIS or CrlS for 3 days and then treated with cisplatin (25 µM) at different time points (TIS: 0 h n = 134 cells, 3 h n = 136 cells, 6 h n = 129 cells; CtrlS: 0 h n = 109 cells; 3 h n = 130 cells; 6 h n = 144). The number of γH2AX foci was calculated using ImageJ software with FindFoci plugins. G Box plots of tail moments from neutral comet assays of SKOV3 cells pre-incubated with TIS or CrlS for 3 days and then treated with cisplatin (10 µM) for 48 h (TIS: CP n = 381 cell, w/o CP n = 368 cells; CtrlS: CP n = 469 cells, w/o CP n = 296). Experiments were performed in triplicate. H Box plots show the number of cisplatin-DNA adducts’ foci per nucleus of SKOV3 cells pre-incubated with TIS or CrlS for 3 days and then treated with cisplatin (25 µM) for 48 h (TIS n = 243 cells; CtrlS n = 146 cells). The number of cisplatin-DNA adducts’ foci was calculated using ImageJ software. I Box plots show the number of phosphorylated RPA2 (phospho S33) foci per nucleus in SKOV3 cells pre-incubated with TIS or CrlS for 3 days and then treated with cisplatin (25 µM) at different time points (TIS: 0 h n = 194 cells, 3 h n = 216 cells, 6 h n = 264 cells, 9 h n = 241; CtrlS: 0 h n = 228 cells; 3 h n = 195 cells, 6 h n = 174, 9 h n = 193). The number of phosphorylated RPA2 foci was calculated using ImageJ software. J Cell cycle analysis with flow cytometry of SKOV3 cells pre-incubated with TIS or CrlS for 3 days and then treated with cisplatin (10 µM) for 24 h. Stacked bar graphs show the percentage of cells in different phases of the cell cycle. Percentage of cells in G1, S, and G2 phases was calculated with NovoExpress software. Secretomes were collected as indicated in Fig. 3B. The line in each box is the median, the up and low of each box are the first and third quartiles. The upper whisker extends from the up of the box to the largest value no further than 1.5*IQR (where IQR is the inter-quartile range). The lower whisker extends from the low of the box to the smallest value at most 1.5*IQR. Data beyond the end of the whiskers are called “outlying” points and are plotted individually. The p-value was obtained by two-tailed unpaired Student’s t test (FI). Gene expression signature analysis was performed using the “signatureSearch” packages in “R” against the Reactome database (C). Source data are provided as a Source Data file.
Fig. 6
Fig. 6. Extracellular spliceosomal components contribute to the aggressiveness of ovarian cancer.
A Flow cytometry analysis of caspase 3/7 activity and SYTOX staining of SKOV3 cells stably expressing SYNCRIP, SNU13 or an empty vector (pCDH), treated with 40 μM of cisplatin for 24 h. The bar graph (on the right) shows the percentage of viable cells for each cell line 24 h after treatment with 40 µM of cisplatin (n = 2 biologically independent experiments). B Reactome enrichment analysis of upregulated genes in SKOV3 cells overexpressing SYNCRIP versus control pCDH cells 24 h after cisplatin (40 µM) addition (p-values are indicated by colors). C Reactome enrichment analysis of upregulated genes in SKOV3 cells overexpressing SNU13 versus control pCDH cells 24 h after cisplatin (40 µM) addition (p-values are indicated by colors). D Heat map displaying the relative amount of 9 snRNAs in ovarian cancer cells and malignant ascitic fluids after chemotherapy from 11 patients. The data represent the mean values ± SD (n = 3 biologically independent samples). E Spaghetti plots of U12 snRNA and 18S rRNA levels in paired ascitic fluids from 11 patients before and after chemotherapy. The data represent the mean values ± SD (n = 3 biologically independent samples). F Multidimensional scaling (MDS) plot of all expressed genes reflects changes between control cells transfected with empty lipofectamine (blue) or GFP mRNA fragment (green) and cells transfected with U12 snRNA (yellow) or U6atac snRNA (red). Each point represents 1 sample, and the distance between 2 points reflects the logFC of the corresponding RNA-seq samples. G Gene Ontology enrichment analysis of upregulated proteins (left panel) or genes (right panel) in SKOV3 cells transfected with synthetic U12 snRNA or U6atac snRNA compared to control cells transfected with empty lipofectamine. The color scale refers to −log10 (FDR) values; the number of proteins/genes are represented by the diameter of the circles. H xCELLigence proliferation assay of SKOV3 cells overexpressing U12 snRNA (top panel), U6atac snRNA (bottom panel) or control GFP mRNA fragments (with the corresponding promoters: U2 or U6, respectively). SKOV3 cells were seeded in 96-well E-plates for xCELLigence assay monitoring impedance (cell index, CI) (n = 3 biologically independent samples). Mean values of the CI were plotted ± standard deviation. I Scheme of the experiment (top panel) and the representative tumor images (bottom panel) obtained from SCID mice injected with 4 × 106 SKOV3 cells which were transfected with synthetic U12 snRNA, U6atac snRNA, or a GFP mRNA fragment (control). ClusterProfiler was used for functional enrichment analysis with all genes as background (B, C). A hypergeometric test was carried out, and all significant categories (false discovery rate < 0.05, after correction for multiple testing using the Benjamini–Hochberg procedure) are displayed. Source data are provided as a Source Data file.

References

    1. Xiao, L., Tang, J., Li, W., Xu, X. & Zhang, H. Improved prognosis for recurrent epithelial ovarian cancer by early diagnosis and 125I seeds implantation during suboptimal secondary cytoreductive surgery: a case report and literature review. J. Ovarian Res.13, 141 (2020). 10.1186/s13048-020-00744-2 - DOI - PMC - PubMed
    1. Holohan, C., Van Schaeybroeck, S., Longley, D. B. & Johnston, P. G. Cancer drug resistance: an evolving paradigm. Nat. Rev. Cancer13, 714–726 (2013). 10.1038/nrc3599 - DOI - PubMed
    1. Bouwman, P. & Jonkers, J. The effects of deregulated DNA damage signalling on cancer chemotherapy response and resistance. Nat. Rev. Cancer12, 587–598 (2012). 10.1038/nrc3342 - DOI - PubMed
    1. Duesberg, P., Stindl, R. & Hehlmann, R. Explaining the high mutation rates of cancer cells to drug and multidrug resistance by chromosome reassortments that are catalyzed by aneuploidy. Proc. Natl Acad. Sci. USA97, 14295–14300 (2000). 10.1073/pnas.97.26.14295 - DOI - PMC - PubMed
    1. Obenauf, A. C. et al. Therapy-induced tumour secretomes promote resistance and tumour progression. Nature520, 368–372 (2015). 10.1038/nature14336 - DOI - PMC - PubMed