. 2024 Jun 19;15(1):5260.
doi: 10.1038/s41467-024-49160-w.

The association of maternal factors with the neonatal microbiota and health

Affiliations

The association of maternal factors with the neonatal microbiota and health

Bin Zhu et al. Nat Commun. .

Abstract

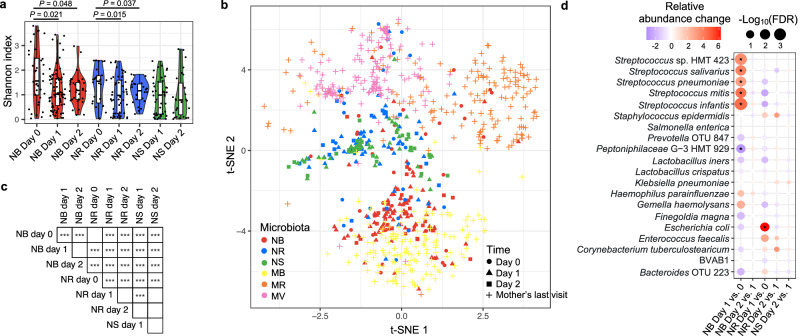
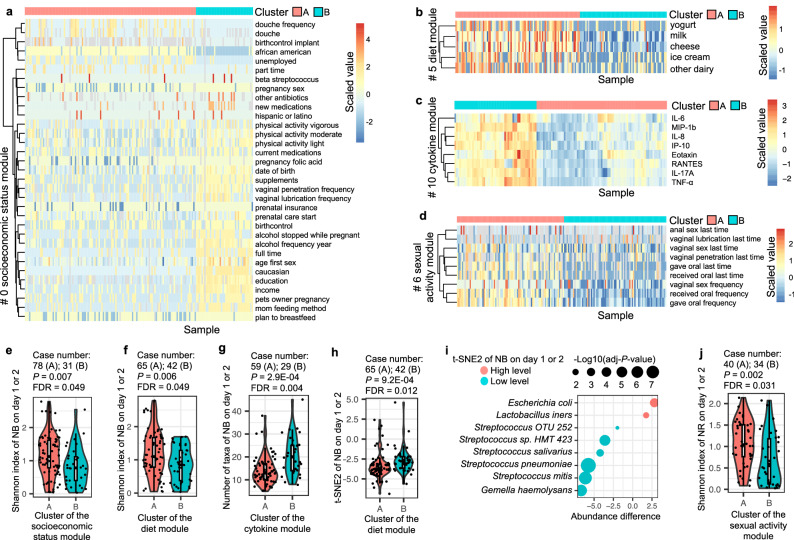
The human microbiome plays a crucial role in human health. However, the influence of maternal factors on the neonatal microbiota remains obscure. Herein, our observations suggest that the neonatal microbiotas, particularly the buccal microbiota, change rapidly within 24-48 h of birth but begin to stabilize by 48-72 h after parturition. Network analysis clustered over 200 maternal factors into thirteen distinct groups, and most associated factors were in the same group. Multiple maternal factor groups were associated with the neonatal buccal, rectal, and stool microbiotas. Particularly, a higher maternal inflammatory state and a lower maternal socioeconomic position were associated with a higher alpha diversity of the neonatal buccal microbiota and beta diversity of the neonatal stool microbiota was influenced by maternal diet and cesarean section by 24-72 h postpartum. The risk of admission of a neonate to the newborn intensive care unit was associated with preterm birth as well as higher cytokine levels and probably higher alpha diversity of the maternal buccal microbiota.


Conflict of interest statement

G.A.B. is a member of the Scientific Advisory Board of Juno, LTD.; a startup biotech firm focused on using the vaginal microbiome to address issues of women’s gynecologic and reproductive health. The remaining authors declare no competing interests.

Figures

Fig. 1
Fig. 1. The neonatal microbiotas within three days postpartum.
The neonatal buccal (NB), rectal (NR), and stool (NS) microbiotas on day 0 (within 24 h postpartum), day 1 (24–48 h postpartum), and day 2 (48–72 h postpartum) after birth and the maternal buccal (MB), rectal (MR), and vaginal (MV) microbiotas collected on the last visit of pregnancy were used in the diversity analyses. The experimental design, including case number, is shown in Fig. S1a. a Alpha diversity (Shannon index) of the neonatal microbiotas on different days. P values were quantified using the two-sided Mann–Whitney U test. Lines in the boxplots represent maximum, 75% quantile, median, 25 quantile, and minimum values from top to bottom. b Beta diversity of the NB, NR, and NS and MB, MR, and MV microbiotas quantified by the Bray-Curtis distance and visualized by the t-distributed stochastic neighbor embedding plot. c Pairwise analysis of the difference between two microbiotas was performed using the Adonis test with default parameters. The significance is indicated by asterisks. ***P value ≤ 0.001. d The significant changes in the relative abundance of taxa in the neonatal microbiotas are shown by a dot plot and are highlighted by asterisks. The relative abundance changes of taxa that are abundant in any studied microbiota are also visualized. Relative abundance change was tested by the ALDEx2 package with default parameters in R and quantified by the per-taxon median difference between two conditions. Adjusted P values were generated by the Benjamini-Hochberg correction of the Mann–Whitney U test.
Fig. 2
Fig. 2. Maternal factor network.
The associations between each pair of maternal variables were tested by different methods based on data types (see “Methods”). The significant associations were used as input to the Gephi software for the network analysis. The size of each node, representing each maternal factor, was determined by the betweenness centrality, and the modules were classified by the ‘modularity’ function in the Gephi software. The explanation of the maternal factors is shown in Supplementary Data 1, and the associations are listed in Supplementary Data 2.
Fig. 3
Fig. 3. Factors associated with the alpha diversity of the neonatal microbiotas.
The 164 maternal-neonatal dyads were classified into groups A and B according to the clustering of the Gower’s or Minkowski’s distance (see Methods) of maternal variables in each maternal factor module. The results of modules 0, 5, 10, and 6 are shown in (a–d). e The Shannon index of the NB microbiota on day 1 or 2 associated with the maternal factor module 0. f The Shannon index of the NB microbiota on day 1 or 2 associated with the maternal factor module 5. g The number of taxa of the NB microbiota on day 1 or 2 associated with the maternal factor module 10. h The t-SNE2 of the NB microbiota on day 1 or 2 associated with the maternal factor module 5. i The difference in the composition of the NB microbiota on day 1 or 2 between the t-SNE2 value at high and low levels. j The Shannon index of the NR microbiota on day 1 or 2 associated with the maternal factor module 6. Lines in the boxplots represent maximum, 75% quantile, median, 25 quantile, and minimum values from top to bottom. The two-sided Mann–Whitney U test was used to test the difference between alpha diversities of two microbiota groups with P values adjusted by the Benjamini-Hochberg procedure.
Fig. 4
Fig. 4. Factors associated with the beta diversity of the neonatal microbiotas.
a The association between the maternal modules and the composition of the neonatal microbiotas was determined by the Adonis test with default parameters except for the parameter ‘by’ set as ‘margin’. The Adonis P values are shown. b The classification of the 164 maternal-neonatal dyads into groups A and B according to the clustering of the Minkowski’s distance of maternal variables in maternal factor module 9. c The dbRDA test to show the association between the maternal modules and the composition of the NR microbiota on day 0. A red arrow indicates the influence of a specific maternal module on the microbiota. For example, ‘Module_9B’ represents the enrichment of taxa driven by cluster B of module 9. d The classification of the 164 maternal-neonatal dyads into groups A and B according to the clustering of the Gower’s distance of maternal variables in maternal factor module 12. e The dbRDA test to show the association between the maternal modules and the composition of the NS microbiota on day 1 or 2.
Fig. 5
Fig. 5. Maternal factors associated with NICU admission.
The 164 maternal-neonatal dyads were classified to groups A and B according to the clustering of the Gower’s distance of maternal variables in each maternal factor module. The results of modules 11 and 7 are shown on (a, b). c The association between the maternal modules and the risk of NICU admission was determined by the two-sided odds ratio analysis. Data are presented as risk ratios and upper and lower bounds of the estimate. The P values or P values with multiple testing corrections are shown. d A predictive model for the risk of the NICU admission was established using the random forest algorithm. The quality of the model, quantified by the area under the receiver operating characteristic (auROC), and the importance of input variables, determined by the mean decrease in Gini coefficient (Mean Decrease Gini), are shown. e The correlation among the input variables in the random forest model was tested by the Spearman’s correlation. The correlation coefficients with significant correlations are shown by the heatmap.

References

    1. Robertson RC, Manges AR, Finlay BB, Prendergast AJ. The human microbiome and child growth - first 1000 days and beyond. Trends Microbiol. 2019;27:131–147. doi: 10.1016/j.tim.2018.09.008. - DOI - PubMed
    1. Sanidad KZ, Zeng MY. Neonatal gut microbiome and immunity. Curr. Opin. Microbiol. 2020;56:30–37. doi: 10.1016/j.mib.2020.05.011. - DOI - PMC - PubMed
    1. Selma-Royo M, et al. Perinatal environment shapes microbiota colonization and infant growth: impact on host response and intestinal function. Microbiome. 2020;8:1–19. doi: 10.1186/s40168-020-00940-8. - DOI - PMC - PubMed
    1. Gupta A, Osadchiy V, Mayer EA. Brain-gut-microbiome interactions in obesity and food addiction. Nat. Rev. Gastroenterol. Hepatol. 2020;17:655–672. doi: 10.1038/s41575-020-0341-5. - DOI - PMC - PubMed
    1. Rhoades N, et al. Maturation of the infant rhesus macaque gut microbiome and its role in the development of diarrheal disease. Genome Biol. 2019;20:173. doi: 10.1186/s13059-019-1789-x. - DOI - PMC - PubMed

LinkOut - more resources