. 2024 Jun 19;15(1):5258.
doi: 10.1038/s41467-024-49590-6.

Single missense mutations in Vi capsule synthesis genes confer hypervirulence to Salmonella Typhi

Affiliations

Single missense mutations in Vi capsule synthesis genes confer hypervirulence to Salmonella Typhi

Gi Young Lee et al. Nat Commun. .

Abstract

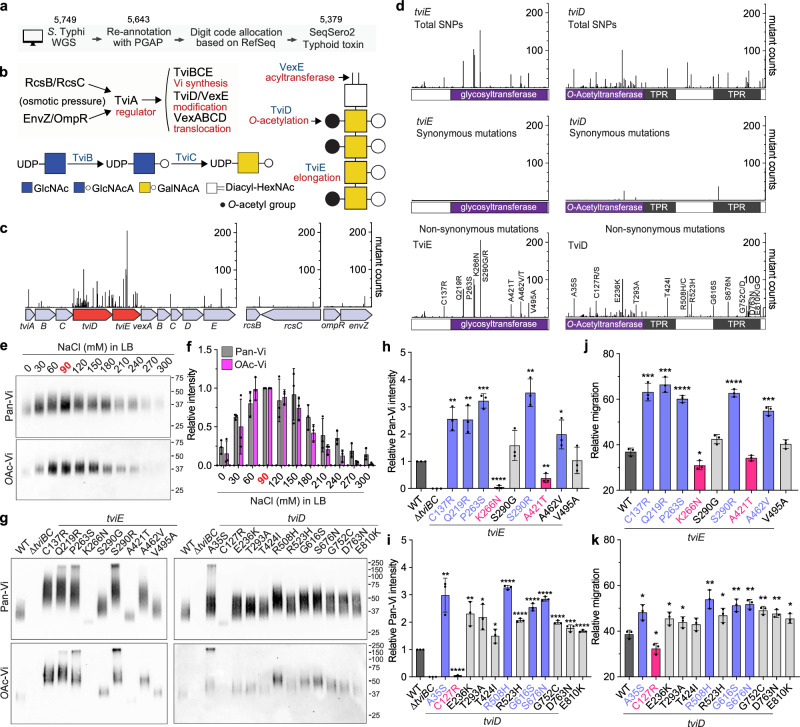
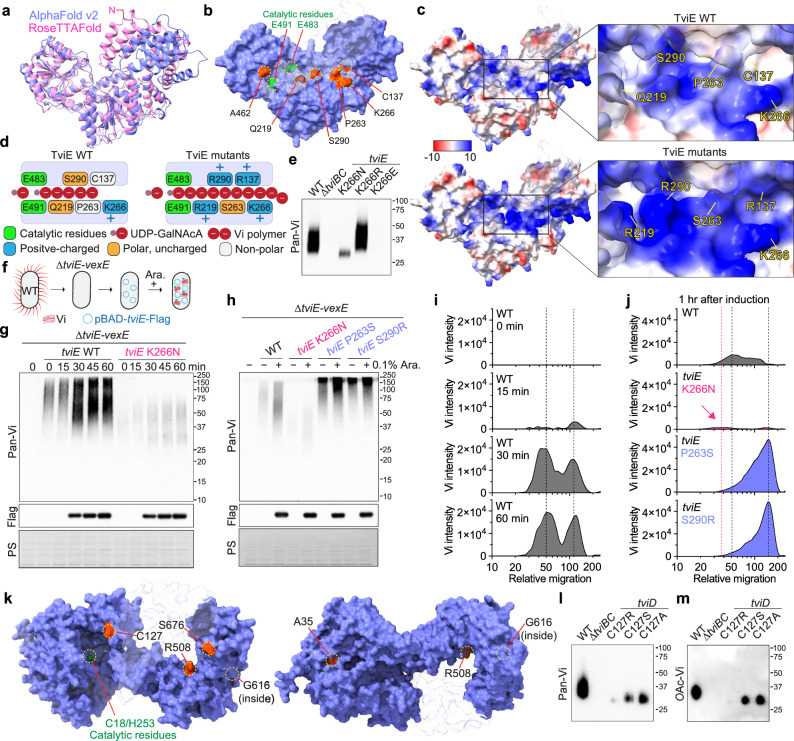
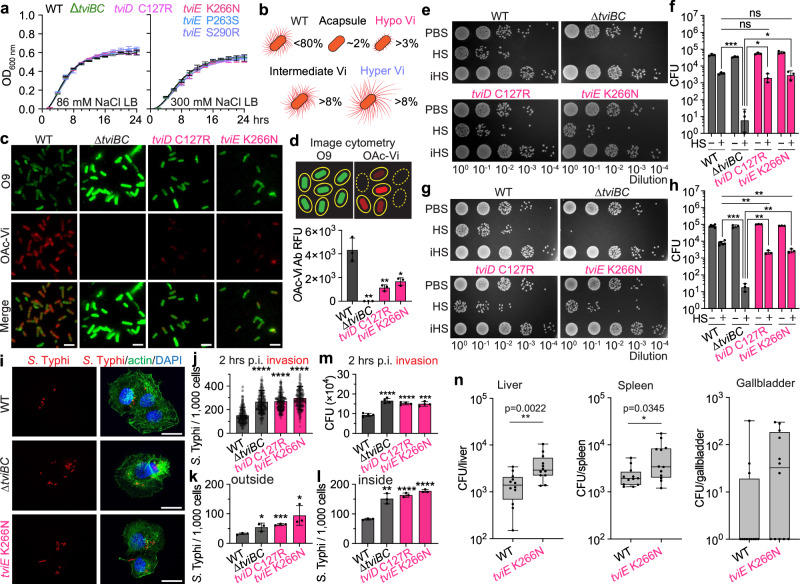
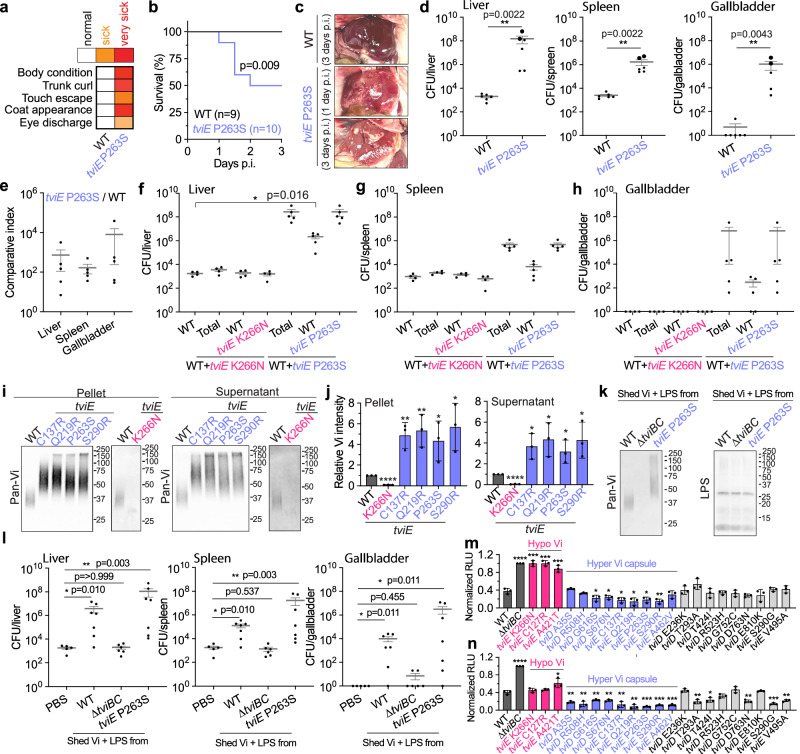
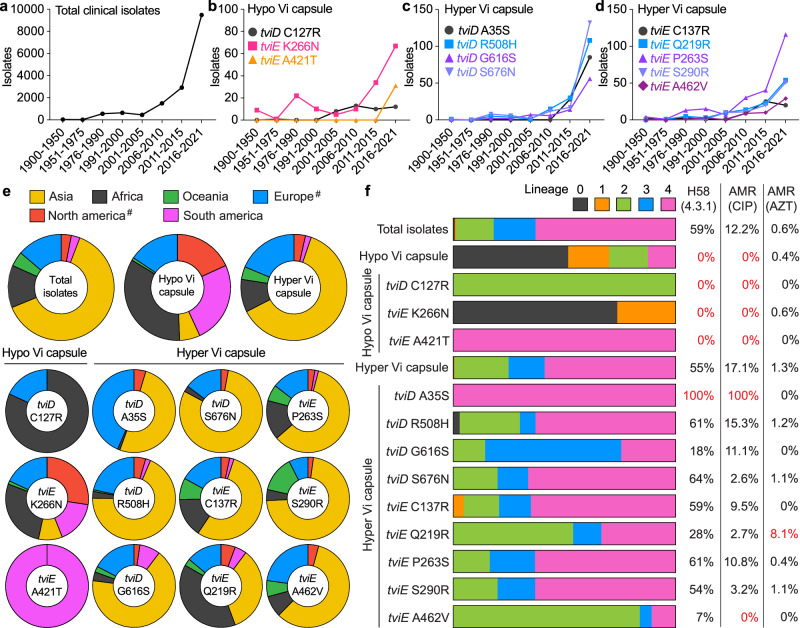
Many bacterial pathogens, including the human exclusive pathogen Salmonella Typhi, express capsular polysaccharides as a crucial virulence factor. Here, through S. Typhi whole genome sequence analyses and functional studies, we found a list of single point mutations that make S. Typhi hypervirulent. We discovered a single point mutation in the Vi biosynthesis enzymes that control Vi polymerization or acetylation is enough to result in different capsule variants of S. Typhi. All variant strains are pathogenic, but the hyper Vi capsule variants are particularly hypervirulent, as demonstrated by the high morbidity and mortality rates observed in infected mice. The hypo Vi capsule variants have primarily been identified in Africa, whereas the hyper Vi capsule variants are distributed worldwide. Collectively, these studies increase awareness about the existence of different capsule variants of S. Typhi, establish a solid foundation for numerous future studies on S. Typhi capsule variants, and offer valuable insights into strategies to combat capsulated bacteria.


Conflict of interest statement

The authors declare no competing interests.

Figures

Fig. 1
Fig. 1. S. Typhi genes encoding the Vi biosynthesis system are hotspots for clinical missense mutations.
a A schematic workflow of the bioinformatic pipeline used to analyze S. Typhi WGSs. b A working model for S. Typhi Vi gene regulation, synthesis, modification, and transport. Note that the exact order of the Vi synthesis process remains to be characterized. GlcNAc, N-acetyl-glucosamine. GlcNAcA, N-acetyl-glucosaminuronic acid. GalNAcA, N-acetyl-galactosaminuronic acid. Diacyl-HexNAc, diacyl-N-acetyl-hexosamine. c, Clinical missense mutation frequency map that we have generated in this study. Note that the peaks are based on protein-level mutations. d Total SNPs (upper panel), synonymous (middle panel), and non-synonymous (lower panel) mutations found in the tviE and tviD genes. Note that the peaks for total SNPs and synonymous SNPs are based on nucleotide-level mutations, whereas the peaks for non-synonymous SNPs are based on protein-level mutations. Y-axis, numbers of S. Typhi clinical isolates carrying the indicated single point mutation of the indicated genes. X-axis, the position of the single point mutations. TPR, tetratricopeptide repeat. e Immunoblots assessing Vi produced by WT S. Typhi cultured in LB containing indicated NaCl concentrations. f Quantification results of three independent experiments associated with e. g Immunoblots assessing Vi produced by S. Typhi WT, ∆tviBC, and clinical missense mutants cultured in LB containing 86 mM NaCl. h Vi intensity quantification results of three independent experiments associated with g left panel. i Vi intensity quantification results of three independent experiments associated with g right panel. j Vi migration/length quantification results of three independent experiments associated with g left panel. k Vi migration/length quantification results of three independent experiments associated with g right panel. Bars in graphs f and hk represent the mean ± standard deviation (SD). Two-tailed student t tests between WT and indicated mutants were performed. *P < 0.05; **P < 0.01; ***P < 0.001; ****P < 0.0001. The positions of the protein ladders in e and g are indicated for guidance regarding relative glycan migration differences. See also Supplementary Figs. 1–7 and Supplementary Tables 1, 2, and Data 1–3. Source data are provided as a Source Data file.
Fig. 2
Fig. 2. The presence of clinical missense mutations leads to alterations in the mechanism of action of TviE and TviD.
a Overlay ribbon diagrams of TviE structures. Pink, TviE structure predicted by RoseTTAFold. Lilac blue, TviE structure predicted by AlphaFold v2. N, N-terminus of TviE. b Clinical missense mutations on the predicted TviE structure (red residues). E491 and E483 are catalytic residues. Lilac blue, the molecular surface of AlphaFold-predicted TviE structure. Light gray/semi-transparent, M1-M45, T214-R218, and R406. c Surface charge distributions of the TviE WT and mutants. Note that R137, R219, R290, and S263 are indicated in the same structure in this figure. Blue, positive charge. Red, negative charge. Semi-transparent, M1-M45, T214-R218, and R406. d A schematic cartoon depicting the predicted Vi extension process occurring on the horizontal groove of TviE WT and mutants. e Immunoblot assessing the role of TviE Lys residue at 266 in Vi polymerization control. S. Typhi WT and indicated tviE mutants were generated and characterized. f A schematic cartoon illustrating the in vivo molecular tool developed to evaluate TviE mutants. g, h Time-course immunoblots of WT tviE and tviE mutants. PS, Ponceau S stained membranes which are to demonstrate comparable sample loading. Arabinose (0.1%) was used. i Time-course histograms of Vi length (X-axis) and amount (Y-axis) produced by S. Typhi ∆tviE-vexE carrying pBAD-tviE-Flag. Relative migration values are correlates of the apparent sizes of protein standards in KDa. j Histograms of Vi length (X-axis) and amount (Y-axis) produced by S. Typhi ∆tviE-vexE carrying pBAD-tviE-Flag or pBAD-tviE K266N, P263S, or S290R-Flag. One hour after 0.1% arabinose induction. k Clinical missense mutations on the predicted TviD structure (red residues). C18 and H253 are catalytic residues. Semi-transparent, the residues A701-S831. l, m Immunoblots assessing the role of TviD Cys residue at 127 in Vi length and O-acetylation. Three independent experiments were performed for e, g, h, l, and m. The positions of the protein ladders in e, g, h, l, and m are indicated for guidance regarding relative glycan migration differences. Source data are provided as a Source Data file.
Fig. 3
Fig. 3. S. Typhi hypo Vi capsule variants possess several critical pathogenic characteristics, including serum resistance and increased invasion.
a Growth curves of S. Typhi WT, ∆tviBC, and indicated clinical missense mutants cultured in 86 mM NaCl LB (Lennox LB) or 300 mM NaCl LB. Lines represent the mean ± SD. The results are from four independent experiments. b Schematic illustration depicting the capsule variants. Numbers in % indicate the % of capsule variants found among 5379 clinical isolates. c Representative images of image cytometry analyses on S. Typhi WT, ∆tviBC, tviD C127R, and tviE K266N. scale bars, 5 µm. d Quantification results of three independent experiments associated with c. eh Human serum resistance assays of S. Typhi WT and mutants. Ten-fold dilutions of bacterial cultures, which were incubated at 37 °C for 2 h in the presence of 90% non-vaccinated (e, f) or vaccinated (g, h) human sera, plated on LB agar plates, incubated overnight, and photographed. PBS no sera, HS human sera, iHS heat-inactivated human sera. i Representative fluorescence microscopy images of bacterial invasion into host cells. Henle-407 cells were infected for 2 h with 15 m.o.i. of S. Typhi WT, ∆tviBC, tviE P263S, or tviE K266N. Scale bars, 20 µm. j Quantification results of three independent experiments associated with i. 2 h after infection. k, l Quantification results of three independent experiments assessing outside (k) and inside (l) S. Typhi 1 h after infection. m Quantification results of three independent experiments assessing CFUs of intracellular S. Typhi 2 h after infection. Bars represent the mean ± SD except graph f and h that show the geometric mean ± SD. Two-tailed t-tests between WT and indicated strain were performed unless otherwise indicated. *P < 0.05; **P < 0.01; ***P < 0.001; ****P < 0.0001. ns not significant. n, CFU results that were recovered from the liver, spleen, and gallbladder 3 days after infection (n = 12 mice). The box and whiskers plot shows all data points, with whiskers ranging from the lowest to the highest values. The box depicts the interquartile range (from the 25th to the 75th percentiles), while the central line indicates the median value. Two-tailed Mann–Whitney tests were performed. Source data are provided as a Source Data file.
Fig. 4
Fig. 4. The hyper Vi capsule variants of S. Typhi are hypervirulent, with both bacteria-associated and shed Vi contributing to their heightened virulence.
ad SHIRPA test (a), percent survival (b), and liver abscess (c) from Cmah-null mice infected intraperitoneally with 8 ×10⁵ WT (n = 9), or tviE P263S (n = 10). d CFU assays in the liver, spleen, and gallbladder 3 days after infection. Big dots represent CFU numbers from two severely sick mice that died on day 1.5. Note that the organ CFUs of WT S. Typhi on day 3 are the same as those of Fig. 3n WT S. Typhi on day 3 because these studies were carried out concurrently. eh Chloramphenicol-resistant or Kanymycin-resistant gene was inserted downstream of the pseudonized pagL gene of WT (CmR), tviE K266N (KanR), or tviE P263S (KanR). Cmah-null mice were infected intraperitoneally with 4 ×10⁵ WT S. Typhi, or with a combination of WT+tviE K266N (4 ×10⁵ each; n = 4 mice), or WT+tviE P263S S. Typhi strains (4 × 10⁵ each; n = 5 mice). Comparative index (e) and CFUs in the liver (f), spleen (g), and gallbladder (h) 3 days after infection. i Immunoblots assessing the shedding of Vi by S. Typhi tviE K266N, tviE C137R, tviE Q219R, tviE P263S, and tviE S290R. j, Quantification results of three independent experiments associated with i. k, l In vivo effects of shed Vi on bacterial infection. Immunoblot analysis of Vi preparations and residual LPS (k). Shed Vi (obtained from ~1.6 ×10⁹ of the indicated bacteria) was prepared in 100 µl PBS, which was administered to mice along with 8 ×10⁵ WT S. Typhi (n = 5 mice for the PBS (no shed Vi) group, n = 7 mice for the shed Vi from WT S. Typhi, n = 6 mice for the equivalent sample from S. Typhi ∆tviBC, and n = 7 mice for the shed Vi from S. Typhi tviE P253S). CFU results that were recovered from the liver, spleen, and gallbladder 24 h after infection (l). m, n ROS burst from neutrophils incubated with the indicated strain after opsonization with un-vaccinated (m) or vaccinated (n) human sera. Neutrophils were obtained from three blood donors. Three independent experiments were performed. RLU, relative luminescence unit. Bars/lines represent the mean ± SD (for j, m, and n) and the mean ± SEM (for dh and l). Log rank tests (b), two-tailed t-tests (j) and two-tailed Mann–Whitney tests (all others) were used to compare WT to the designated strain. *P < 0.05. **P < 0.01. ***P < 0.001., ****P < 0.0001. See also Supplementary Table 3. The positions of the protein ladders in i and k are indicated for guidance regarding relative glycan migration differences. Source data are provided as a Source Data file.
Fig. 5
Fig. 5. Global distribution of hypo and hyper Vi capsule variants.
S. Typhi WGSs from NCBI and Pathogenwatch were merged and evaluated. Duplicate samples were eliminated, yielding a total of 16,368 strains. The years in which S. Typhi Vi variants have been observed. Total (a), hypo Vi capsule (b), and hyper Vi capsule (c, d) clinical isolates isolated from 1916 to 2021. e Global distribution of the capsular variants. #, the isolation of S. Typhi from North America (USA and Canada) and Europe (UK) may be related to travel. f Capsular variant genotypes and related antimicrobial resistance. CIP ciprofloxacin, AZT azithromycin. See also Supplementary Data 4. Source data are provided as a Source Data file.

Update of

Similar articles

Cited by

References

    1. Follador R, et al. The diversity of Klebsiella pneumoniae surface polysaccharides. Micro. Genom. 2016;2:e000073. - PMC - PubMed
    1. Lee S, et al. Glycan-mediated molecular interactions in bacterial pathogenesis. Trends Microbiol. 2022;30:254–267. doi: 10.1016/j.tim.2021.06.011. - DOI - PMC - PubMed
    1. Mostowy RJ, Holt KE. Diversity-Generating Machines: Genetics of Bacterial Sugar-Coating. Trends Microbiol. 2018;26:1008–1021. doi: 10.1016/j.tim.2018.06.006. - DOI - PMC - PubMed
    1. O’Riordan K, Lee JC. Staphylococcus aureus capsular polysaccharides. Clin. Microbiol Rev. 2004;17:218–234. doi: 10.1128/CMR.17.1.218-234.2004. - DOI - PMC - PubMed
    1. Paton, J. C. & Trappetti, C. Streptococcus pneumoniae Capsular Polysaccharide. Microbiol. Spectr.7, 10.1128/microbiolspec.GPP3-0019-2018 (2019). - PMC - PubMed

MeSH terms

Substances

LinkOut - more resources