. 2024 Jun 19;9(1):35.
doi: 10.1038/s41525-024-00418-8.

Structure and transcription of integrated HPV DNA in vulvar carcinomas

Affiliations

Structure and transcription of integrated HPV DNA in vulvar carcinomas

Anne Van Arsdale et al. NPJ Genom Med. .

Abstract

HPV infections are associated with a fraction of vulvar cancers. Through hybridization capture and DNA sequencing, HPV DNA was detected in five of thirteen vulvar cancers. HPV16 DNA was integrated into human DNA in three of the five. The insertions were in introns of human NCKAP1, C5orf67, and LRP1B. Integrations in NCKAP1 and C5orf67 were flanked by short direct repeats in the human DNA, consistent with HPV DNA insertions at sites of abortive, staggered, endonucleolytic incisions. The insertion in C5orf67 was present as a 36 kbp, human-HPV-hetero-catemeric DNA as either an extrachromosomal circle or a tandem repeat within the human genome. The human circularization/repeat junction was defined at single nucleotide resolution. The integrated viral DNA segments all retained an intact upstream regulatory region and the adjacent viral E6 and E7 oncogenes. RNA sequencing revealed that the only HPV genes consistently transcribed from the integrated viral DNAs were E7 and E6*I. The other two HPV DNA+ tumors had coinfections, but no evidence for integration. HPV-positive and HPV-negative vulvar cancers exhibited contrasting human, global gene expression patterns partially overlapping with previously observed differences between HPV-positive and HPV-negative cervical and oropharyngeal cancers. A substantial fraction of the differentially expressed genes involved immune system function. Thus, transcription and HPV DNA integration in vulvar cancers resemble those in other HPV-positive cancers. This study emphasizes the power of hybridization capture coupled with DNA and RNA sequencing to identify a broad spectrum of HPV types, determine human genome integration status of viral DNAs, and elucidate their structures.


Conflict of interest statement

M.H.E. has advised or participated in educational speaking activities but does not receive an honorarium from any companies. In specific cases, his employer has received payment for his time spent on these activities from Asieris, Papivax, Merck, BD, and PDS Biotechnologies. If travel is required for meetings with the industry, the company pays for M.H.E.’s travel expenses. Rutgers has received grant funding for research-related costs of clinical trials that he has been the overall or local PI within the past 12 months from J&J, Pfizer, Inovio, AstraZeneca, Imvax, Iovance, PDS Biotechnologies, and Becton-Dickinson. M.H.E. is a consultant to the World Health Organization. Payment for these efforts goes to Rutgers. M.H.E. has leadership positions in ASCCP, SGO. The other authors declare no potential conflicts of interest.

Figures

Fig. 1
Fig. 1. Coverage of HPV genomes and typing based on viral DNA hybridization capture plus Illumina short read sequencing.
The horizontal scale depicts the linearized HPV genome, starting from E6 (positions 1 and 7906 in HPV16). The corresponding locations of viral open reading frames are displayed at the bottom. The plot depicts the deduplicated DNA sequence read counts for each sample, with the Y-axis scales on the left for each tumor. The identified HPV type(s) are indicated on the right side of the plot. The boundaries of underrepresented segments in Tumor 2 (3582–5588), Tumor 10 HPV16 component (URR-E6-E7 segment 7135 to 1805), and Tumor 13 HPV53 component (4825 to 5297) are indicated.
Fig. 2
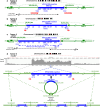
Fig. 2. Structures of integrated HPV16 DNAs in Tumors 2, 4, and 5 based on HC + SEQ aligned at the URR-E6-E7 segment.
For each tumor, the approximate position of the HPV DNA insertion (red bar) is shown on the cognate chromosome ideogram. The structure of each integrated DNA is represented as a thick blue arrow, with viral DNA segment length and the approximate positions of viral open reading frames (ORFs) and the upstream regulatory region (URR) also shown in blue. Flanking the viral DNA junctions, human genome segments are depicted as thinner green arrows, including the adjacent flanking exons shown as rectangles. Arrows indicate the 5’ to 3’ orientation of the plus strands of both viral and cellular genes, with the HPV16 DNAs integrated into the opposite transcriptional orientation compared to the human genes in each of the three tumors. The positions of the insertion junctions in the human and HPV reference genome (hg38 and PAVE, respectively) are indicated in green or blue, respectively. For Tumors 2 and 4, short, direct repeat, human DNA sequences immediately flanking the insertions are shown in red. In Tumor 5, segments of microhomology between the viral and human DNA at the junctions are depicted as a short red line. Below the genomes for Tumors 2 and 5, positions of long-range DNA sequence reads are represented by dotted black arrows. HPV and human DNAs were drawn at different scales. a Genetic diagram illustrating the structure of the HPV16 DNA segment integrated in intron 1 of the NCKAP1 gene in Tumor 2, with the 9 bp, direct repeat sequence (5′-CAACACGGT-3′) immediately flanking both sides of the viral insertion in red. b Genetic diagram of the HPV16 segment in intron 2 of the C5orf67 gene, where a 3 bp direct repeat sequence (5′-TTT-3′) is shown immediately flanking the viral insertion on both sides in red. c Genetic diagram of HPV16 DNA in Tumor 5 inserted between exons 7 and 12 in the LRBP1 gene. The HPV16 genome was noted to be present in tandem with at least one full genome and an additional 982 bp, as determined by HC + SEQ and long-range MinION nanopore sequencing reads spanning this region. This integration event coincided with a 38 kbp deletion within the LRBP1 gene. d Long-range MinION nanopore sequencing of Tumor 4, specifically showing the sequence read coverage for a 62 kbp segment from the second intron of C5orf67 on chromosome 5. The plot depicts the over-representation of a 28 kb segment containing the HPV16 DNA segment. Below the read count plot, a linear genetic diagram represents the inserted HPV16 DNA and the 28 kb stretch of high read counts. Circular episome and DNA concatemer structures are depicted below, each consistent with the sequencing results.
Fig. 3
Fig. 3. RNAseq analysis of HPV transcripts in three vulvar tumors harboring integrated HPV16 DNA.
The plots depict read counts aligned to the HPV16 genome using IGV, with the Y-axis representing the scale of read counts for each plot, and read counts displayed as counts per million reads. At the bottom, the full-length HPV16 genome is shown, indicating the positions of the viral open reading frames (ORFs) represented as boxes. The large blue arrow indicates the 5’ to 3’ transcriptional orientation of all the viral ORFs. The standard numbering scale for the HPV16 genome is shown at the top. The genome is linearized between the early (E) and late (L) ORFs to position the URR-E6-E7 segment centrally as is characteristic of integrated HPV genomes in tumors (see Fig. 2) including the URR immediately upstream of the transcribed E6 and E7 ORFs. The viral nucleotide immediately preceding the junction with human DNA is numbered at the end of each plot. HPV RNA 5′ and 3′ splice sites (5′ss and 3′ss) are labeled and indicated by the vertical dashed lines. These include the E6*I splice sites, responsible for a frame-shifting deletion of much of the E6 coding segment, and the 5′ss (E1^E4 5’ss) just downstream of the E1 start codon that typically splices to the 3’ss for the E4 ORF, and also can join to 3’ splice sites in the human genome downstream of inserted HPV DNAs. No transcripts from the viral L regions were detected in any of the tumors.
Fig. 4
Fig. 4. Transcription of human genes with HPV16 DNA insertions determined from RNAseq data.
a, b, c Positions of human RNA sequences derived from the antisense strand of the cognate human genes (brown) fused with HPV16 RNA sequences (blue) for each tumor. The top line in each displays the chromosomal position and 5′ to 3′ transcriptional orientation of the human gene. Below that, IGV plots show the exon-intron structure of human gene, with the HPV16 DNA insert displayed in a lighter shade of blue. The boxed regions within each gene highlight the segments containing HPV16 DNA, with spliced fusion transcripts shown below the DNA for detailed visualization of viral genetic detail. The scales of the HPV16 DNA are larger than the flanking human DNA segments to allow transcriptional features to be presented. The brown arcs represent the introns excised from HPV16 5’ splice sites (5’ss) to presumably cryptic 3’ splice sites (3′ss) of the human genes. The numbers within the arcs indicate the RNAseq read counts for each splice site junction. The majority of the transcripts derived from HPV16 exhibited splicing at the major E6* splice junction known as E6*I (blue arcs), with the positions of the junctions at nucleotides 226 and 409 shown in blue. Most splicing from HPV sequences to human gene antisense sequences involved the 5’ss at position 880 at the beginning of the viral E1 gene open reading frame as shown. For Tumor 5 (c), a smaller number of spliced RNAs alternatively involved the 5’ss at position 226 within the E6 gene, which joined a 3′ss of LRP1B. In Tumor 4, numerous transcripts were spliced from HPV16 sequences originating at the viral late promoter and entailed the 5’ss at position 1302 labeled E2M. d, e and f show the total numbers of RNAseq reads derived from the sense strands of the indicated human genes, aggregated for each gene. The total deduplicated read counts (counts per million reads) from each human gene are plotted separately for the HPV-positive and the HPV-negative vulvar cancers. Specifically, for tumors 1–9. Each panel utilizes a distinct Y-axis read count scale for the corresponding sample. The black arrows indicate samples in which HPV16 DNA was integrated into the specific human gene.
Fig. 5
Fig. 5. Evaluation of tumor infiltrating immune cells using RNAseq expression data.
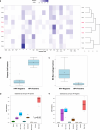
a The relative frequencies of 22 immune cell gene expression profiles across nine tumor samples were assessed using CIBERSORTx. HPV-positive tumors, identified through hybridization capture analysis, are labeled in red, while HPV negative tumors are labeled in black. On top of the figure a color-coded key to relative values. Tumors 2 and 4, both HPV-positive, exhibited relatively higher proportions of plasma cells in the tumor microenvironment. In addition, all three HPV-positive tumors displayed lower relative levels of M0 macrophages compared to HPV-negative tumors. EPIC was employed to further examine the tumor microenvironment and provide a condensed representation of immune cell populations in the HPV-positive and HPV-negative samples. Differences in plasma cells (b) and M0 macrophages (c) were observed. The tumor microenvironment was further evaluated using EPIC to provide a condensed set of immune cell populations in addition to cancer-associated fibroblasts and endothelial cells between HPV-positive (d) and HPV-negative tumors (e). Differences in (b) cells as a population whole did not meet statistical significance. However endothelial cells were noted to be more prevalent in HPV positive tumor’s TME compared to HPV-negative tumors (p = 0.04).
Fig. 6
Fig. 6. Proposed mechanism for the insertion of HPV16 DNA segments following a staggered incision on double-stranded DNA such as those by LINE1 element ORF2 protein.
Double-stranded, human genome sequences for the empty, pre-integration alleles in Tumors 4 and 5 are shown at the top. Block vertical arrows show positions of incisions on each strand. Successive steps of staggered cleavage in human genomic DNA (green), viral DNA joining (blue), and gap repair (brown) are shown below. This process results in duplication of the human sequences between the incisions into direct repeats that immediately flank the inserted viral DNA. The viral DNA is shown as blunt-ended, but the mechanism can also apply with overhanging ends. The T:A base pair two nucleotides to the right of the TTT in the Tumor 5 C5orf67 sequence is an A:T base pair in the reference human genome (hg38).
Fig. 7
Fig. 7. Multiple DNAs detected by nanopore DNA sequencing and whole genome sequencing (WGS).
Top: Output from Amplicon Architect to verify the structures detected by long-range nanopore DNA sequencing. Read counts from WGS are plotted on a segment of chromosome 5 on the left and the HPV16 genome on the right. “Coverage” on the Y-axis indicates read counts, and “CN” on the Y-axis indicates estimated copy number. Each arc above the plots shows a junction between two non-contiguous positions in the human genome or between the human and HPV16 genomes. The letters A–G represent segments in the human or HPV genomes surrounding the positions of junctions between two non-contiguous positions as detected by nanopore and WGS. Note that C and G each correspond to the two distinct HPV-human DNA junctions separated by only very short distances in the human or HPV16 genomes as depicted in Fig. 2d (human 56,541,341 to HPV16 4178 and human 56,541,344 to HPV16 4162), and in the circle on the left of the lower row in this figure. Bottom: The four circles in the lower row indicate the amplified elements as episomes that were detected by DNA sequencing including Amplicon Architect analysis of WGS data and alignments of sequence data with the human and HPV16 genomes. Junctions are indicated by juxtaposed pairs of letters A through G, specifically A–F, B–D, and B–E involving human to human DNA junctions, and the C-G junctions depicting the two human to HPV junctions. These were the only human-HPV DNA junctions detected. The circle on the left is labeled as “hetero-catemer” and is precisely identical to that determined from long-range sequencing data as illustrated in Fig. 2d. The two structures in the center (labeled “human DNA only 1” and “human DNA only 2”) contain only human sequences including the A–F junction of non-contiguous sequences and only part of the sequences in the hetero-catemer and included no HPV sequences. The structure on the right comprises HPV DNA only. The size of each sequence in the bottom row is shown in the center of each circle.
Fig. 8
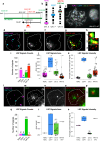
Fig. 8. Visualization of HPV16 DNA and human chromosomes by custom DNA FISH in vulva Tumor 4.
a Schematic representation of HPV16 DNA inserted in human chromosome 5 (hg38) and custom DNA FISH probes designed to visualize viral insertion in single nuclei. The black line at the top represents the hg38 human reference genome. Green denotes the relative mapping of BAC clone RP11-662P23 to the human reference genome. Red indicates the position of HPV16 DNA in the C5orf67 locus relative to the human genome and to BAC clone RP11-662P23. The black line at the bottom shows the direction of transcription of C5orf67 and the position of the HPV16 DNA relative to the C5orf67, 20 kb, second intron between exons 2 and 3 within RP11-662P23. Relative sizes of the human genome, BAC clone RP11-662P23 and HPV16 are drawn to scale. b Chromosomal positions of locus-specific probes (LSP’s) to visualize the TERC locus (magenta) on chromosome 3, the centromere of chromosome 7 (CEP7 in aqua), and the chromosome 5 insertion site (green) of HPV16 DNA (red) used for Tumor 4. c Validation of FISH probes using the UM-SCC-47, an HNSCC cell line with HPV16 DNA inserted into human chromosome 3 about 20 Mb from the TERC gene. A metaphase chromosome spread is shown on the left, and an interphase nucleus is depicted on the right. Gray scale depicts an inverted DAPI. Pseudo-colors of LSP signals correspond to the respective loci as indicated in (b). A representative nucleus from Tumor 4 is delineated by the dotted white line. Signals for the indicated probes as detected by the different fluorophores are shown as follows: d LSP depicting chromosome copy number for TERC and CEP7; e LSP depicting copies of the chromosome 5, HPV16 DNA integration site at C5orf67 mapped by HC + SEQ; f LSP depicting HPV16 DNA; g Color-coded, merged image of the chromosome 5 insertion locus and HPV16 DNA, with yellow indicating signal overlap. h Zoomed-in images enlarged from (g) of integrated HPV16 DNA in panels 1 and 2, and non-integrated HPV16 DNA in panel 3. i Bar graph depicting the number of LSP signals identified in the nucleus shown in (d–g). Box plots depicting the area (j) and intensity (k) of each LSP signal identified in the Tumor 4 nucleus in (d–g). Center lines show medians, box limits indicate the 25th and 75th percentiles, whiskers extend to minimum and maximum values, and data points are plotted as circles. LSP quantifications were performed with a custom pipeline using the open-source image analysis software CellProfiler. A second nucleus of Tumor 4 is depicted similarly to (d–k) above. l LSP depicting copies of TERC and CEP7; m LSP depicting copies of the chromosome 5 HPV16 insertion site; n LSP depicting copies of HPV16 DNA; o Color-coded merged image of the chromosome 5 insertion locus and HPV16 DNA. p Zoomed-in image of integrated HPV DNA marked by the number 1 in (o). q Bar graph depicting the number of LSP signals identified in the nucleus shown in (l–o). Box plots depicting the area (r) and intensity (s) of each LSP signal identified in the nucleus in (lo). Center lines show medians, box limits indicate the 25th and 75th percentiles, whiskers extend to minimum and maximum values, and data points are plotted as circles.

Similar articles

Cited by

  • Precision medicine in gynecological cancer (Review).
    Aravantinou-Fatorou A, Georgakopoulou VE, Dimopoulos MA, Liontos M. Aravantinou-Fatorou A, et al. Biomed Rep. 2025 Jan 8;22(3):43. doi: 10.3892/br.2025.1921. eCollection 2025 Mar. Biomed Rep. 2025. PMID: 39810899 Free PMC article. Review.
  • Informatics at the Frontier of Cancer Research.
    Noller K, Botsis T, Camara PG, Ciotti L, Cooper LAD, Goecks J, Griffith M, Haas BJ, Ideker T, Karchin R, Kontos D, Lai J, Marcus D, Meyer CA, Naegle K, Pati S, Peters B, Pratt D, Raphael BJ, Reich M, Savova GK, Wright C, Fertig EJ, Bakas S. Noller K, et al. Cancer Res. 2025 Aug 15;85(16):2967-2986. doi: 10.1158/0008-5472.CAN-24-2829. Cancer Res. 2025. PMID: 40600473 Free PMC article. Review.
  • Serum, Cell-Free, HPV-Human DNA Junction Detection and HPV Typing for Predicting and Monitoring Cervical Cancer Recurrence.
    Van Arsdale A, Mescheryakova O, Gallego S, Maggi EC, Harmon B, Kuo DYS, Van Doorslaer K, Einstein MH, Haas BJ, Montagna C, Lenz J. Van Arsdale A, et al. medRxiv [Preprint]. 2025 Jan 6:2024.09.16.24313343. doi: 10.1101/2024.09.16.24313343. medRxiv. 2025. PMID: 39830266 Free PMC article. Preprint.

References

    1. Surveillance, Epidemiology, and End Results (SEER) Program (www.seer.cancer.gov) SEER*Stat Database: Incidence - SEER Research Data, 8 Registries, Nov 2023 Sub (1975-2021) - Linked To County Attributes - Time Dependent (1990-2022) Income/Rurality, 1969-2022 Counties, National Cancer Institute, DCCPS, Surveillance Research Program, released April 2024, based on the November 2023 submission.
    1. Stroup AM, Harlan LC, Trimble EL. Demographic, clinical, and treatment trends among women diagnosed with vulvar cancer in the United States. Gynecol. Oncol. 2008;108:577–583. doi: 10.1016/j.ygyno.2007.11.011. - DOI - PMC - PubMed
    1. Hoang LN, Park KJ, Soslow RA, Murali R. Squamous precursor lesions of the vulva: current classification and diagnostic challenges. Pathology. 2016;48:291–302. doi: 10.1016/j.pathol.2016.02.015. - DOI - PMC - PubMed
    1. Jones RW, Baranyai J, Stables S. Trends in squamous cell carcinoma of the vulva: the influence of vulvar intraepithelial neoplasia. Obstet. Gynecol. 1997;90:448–452. doi: 10.1016/S0029-7844(97)00298-6. - DOI - PubMed
    1. Baandrup L, et al. In situ and invasive squamous cell carcinoma of the vulva in Denmark 1978-2007-a nationwide population-based study. Gynecol. Oncol. 2011;122:45–49. doi: 10.1016/j.ygyno.2011.03.016. - DOI - PubMed