. 2024 Jun 19;14(1):14154.
doi: 10.1038/s41598-024-64852-5.

A plug-and-play, easy-to-manufacture fluidic accessory to significantly enhance the sensitivity of electrochemical immunoassays

Affiliations

A plug-and-play, easy-to-manufacture fluidic accessory to significantly enhance the sensitivity of electrochemical immunoassays

Alexandra Dobrea et al. Sci Rep. .

Abstract

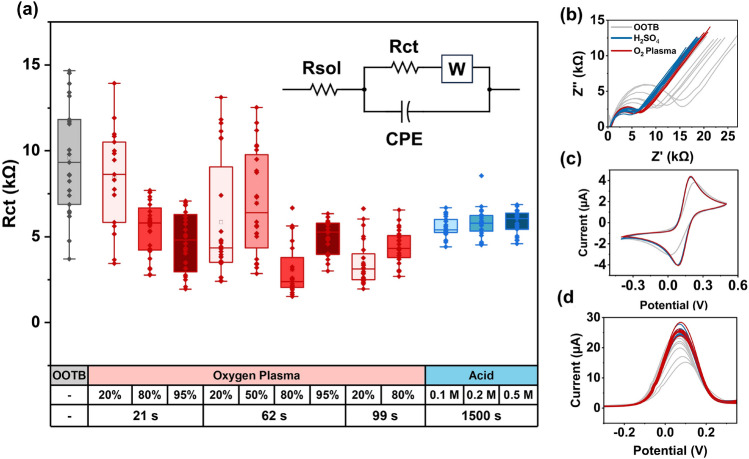
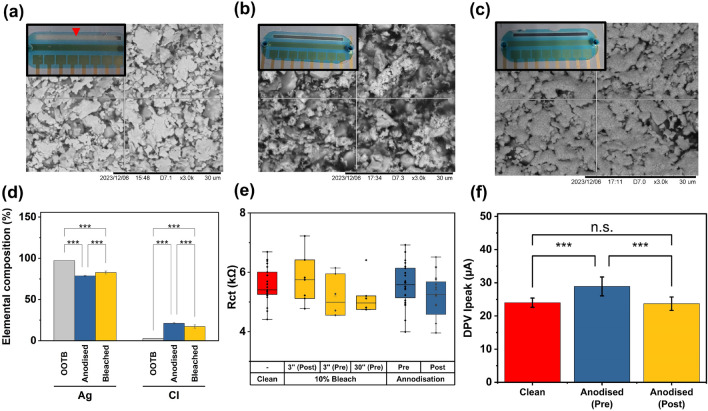
Earlier access to patients' biomarker status could transform disease management. However, gold-standard techniques such as enzyme-linked immunosorbent assays (ELISAs) are typically not deployed at the point-of-care due to their cumbersome instrumentation and complexity. Electrochemical immunosensors can be disruptive in this sector with their small size and lower cost but, without further modifications, the performance of these sensors in complex media (e.g., blood) has been limited. This paper presents a low-cost fluidic accessory fabricated using widely accessible materials and processes for boosting sensor sensitivity through confinement of the detection media next to the electrode surface. Liquid confinement first highlighted a spontaneous reaction between the pseudoreference electrode and ELISA detection substrate 3,3',5,5'-tetramethylbenzidine (TMB) that decreases the amount of oxTMB available for detection. Different strategies are investigated to limit this and maximize reliability. Next, flow cell integration during the signal amplification step of sensor preparation was shown to substantially enhance the detection of cytokine interleukin-6 (IL-6) with the best sensitivity boost recorded for fresh human plasma (x7 increase compared to x5.8 in purified serum and x5.5 in PBS). The flow cell requires no specialized equipment and can be seamlessly integrated with commercial sensors, making an ideal companion for electrochemical signal enhancement.

Keywords: Diagnostics; Electrochemical immunosensor; Fluidics.


Conflict of interest statement

The authors declare no competing interests.

Figures

Figure 1
Figure 1
Comparison of the efficacy of oxygen plasma and sulfuric acid voltage cycling in removing contaminants from the gold electrode surface. (a) The charge transfer resistance (Rct) of the surface of commercial electrodes is measured through impedance spectroscopy without treatment (out of the box electrodes, OOTB), with plasma treatment at different powers (% of 200 W) and exposure times, and different sulfuric acid molarities. Data was fitted using Randles equivalent circuit (inset) to obtain the Rct values (Rsol = solution resistance, CPE = constant phase element, W = Warburg impedance). Datapoints represent different screen-printed electrode platforms with 8 working electrodes (n = 24 except 20% power 21s which had n = 16). Each box delineates the interquartile range (IQR), the straight line denotes the median, the hollow square represents the mean and whiskers denote the range within 1.5xIQR. (b) Examples of Nyquist plot, (c) Cyclic voltammogram and (d) Differential pulse voltammogram of an electrode without treatment (OOTB, grey) in comparison with one treated with the optimal plasma (95%, 62 s, red) and acid cycling cleaning (0.1 M, blue) protocols identified (n = 8). The response was measured using 2 mM ferri-ferrocyanide in 1xPBS.
Figure 2
Figure 2
(a) The commercial screen-printed electrode platform used in these experiments features 8 individual working electrodes (WEs) and a common Ag/AgCl pseudo reference (RE) and Au counter electrode (CE). (b) The typical experimental set-up with the electrode platform placed inside a 3D printed connector made in-house and the reagents drop-cast on top of the electrodes. (c) Proposed flow cell design consisting of a laser cut inlet/outlet layer made from PMMA, channel layer made from double sided polyester tape cut to size using a Cricut electronic cutter and off-the-shelf mini luer fluidic adaptors attached to the PMMA using circular adhesive rings. (d) Before and (e) after flow cell attachment to the electrode platform.
Figure 3
Figure 3
(a) Spontaneous reaction taking place between the Ag/AgCl pseudo-reference electrode and 3,3’,5,5’-tetramethylbenzidine (TMB) locally reducing the oxTMB produced by the HRP-TMB reaction taking place on the detection surface superimposed on SEM scan of the reference electrode surface. (b) The Ag/AgCl reference after being submerged in 10% v/v bleach for 30 min exposed to a solution of oxTMB—the cross-reactivity is reduced but not eliminated and the surface appears damaged by the bleach. (c) The Ag/AgCl reference after anodization in 1 M NaCl exposed to a solution of oxTMB—the cross reactivity with TMB is minimized and the integrity of the Ag crystals appears to be maintained. (d) Elemental composition analysis of Ag/AgCl reference electrode surface and the impact of anodization and bleaching treatments by energy dispersive X-ray Spectroscopy (bars and SD are based on 10 different measurements taken in different locations across the reference electrode surface). (e) The effect of bleaching and anodization treatment and interplay with sulfuric acid cleaning (pre or post Ag/AgCl treatment) on the charge transfer resistance of the Au surface. Each box delineates the interquartile range (IQR), the straight line denotes the median, the hollow square represents the mean and whiskers denote the range within 1.5xIQR. (f) The difference between the peak current of the differential pulse voltammogram when the Ag/AgCl electrode is anodized before (pre) as opposed to after (post) sulfuric acid cleaning highlighting that for best results cleaning must be carried out before anodization. Statistical significance is indicated by * where *** denotes p<=0.001. n.s. = non-significant.
Figure 4
Figure 4
(a) The difference between the dose-dependent responses of the electrochemical immunosensor to IL-6 spiked in PBS for unmodified (red) and anodized (blue) electrodes during fully manual preparation (no flow cell present). Top (red) and bottom (blue) dashed lines represent the average blank reading—3 SDs for unmodified (n = 8) and anodized electrodes respectively (n = 6). (b) The effect of adding the flow cell at the final step of the sensor preparation procedure compared to fully manual preparation and testing (IL-6 spiked in PBS). Both responses are with anodized electrodes. Each marker in (a) and (b) represents the average over all measurements +/− 1 SD and the top (blue) and bottom (purple) dashed lines represent the average blank reading—3 SDs for the ‘without’ and ‘with flow cell’ conditions respectively (n = 6). Further details on the blank means and +/− 3 SD interval can be found in Table S3. (c) Dose-depended transient current response to different concentrations of IL-6 spiked in PBS without (dashed, blue lines) and with the flow cell (purple, solid lines) showing increase in sensitivity upon addition of the flow cell (single measurement per line). Both datasets were acquired with anodized electrodes.
Figure 5
Figure 5
(a) Dose-dependent response of the electrochemical immunosensor to IL-6 spiked in 0.2 µm filtered human serum (10% v/v) with and without the flow cell present at the final detection step showing a large increase in sensitivity following the addition of the flow cell. (b) Dose-dependent response of the electrochemical immunosensor to IL-6 spiked in 10% unfiltered human serum with and without the flow cell present at the final detection step showing a substantial increase in sensitivity and the limit of detection following the addition of the flow cell. (c) Dose-dependent response of the electrochemical immunosensor to IL-6 spiked in neat unprocessed human plasma before and after integrating the flow cell into the preparation protocol. Each marker represents the average over 8 measurements +/− 1 SD and the horizontal dashed lines represent the average blank reading (0 pg/ml)—3 SDs (n = 8). Further details on the blank means and +/− 3 SD interval can be found in Table S3.

Similar articles

References

    1. NICE. Lyme disease—diagnosis and management guidelines (2018). https://www.nice.org.uk/guidance/ng95/resources/lyme-disease-pdf-1837756....
    1. Jiang H, Feng L, Lu J. Updated guidelines for the diagnosis of human brucellosis—China, 2019. China CDC Wkly. 2020;2:487–489. doi: 10.46234/ccdcw2020.129. - DOI - PMC - PubMed
    1. Branson, B. M. et al. Laboratory testing for the diagnosis of HIV infection: updated recommendations—guidelines and recommendations. Cent. Dis. Control Prev. 4–7 (2014).
    1. World Health Organisation. Guidelines on hepatitis B and C testing, vol. 66 (WHO, 2017).
    1. Leffler DA, Schuppan D. Update on serologic testing in celiac disease. Am. J. Gastroenterol. 2010;105:2520–2524. doi: 10.1038/ajg.2010.276. - DOI - PubMed

MeSH terms