. 2024 Oct;34(10):683-706.
doi: 10.1038/s41422-024-00985-6. Epub 2024 Jun 19.

AMPK targets PDZD8 to trigger carbon source shift from glucose to glutamine

Affiliations

AMPK targets PDZD8 to trigger carbon source shift from glucose to glutamine

Mengqi Li et al. Cell Res. 2024 Oct.

Abstract

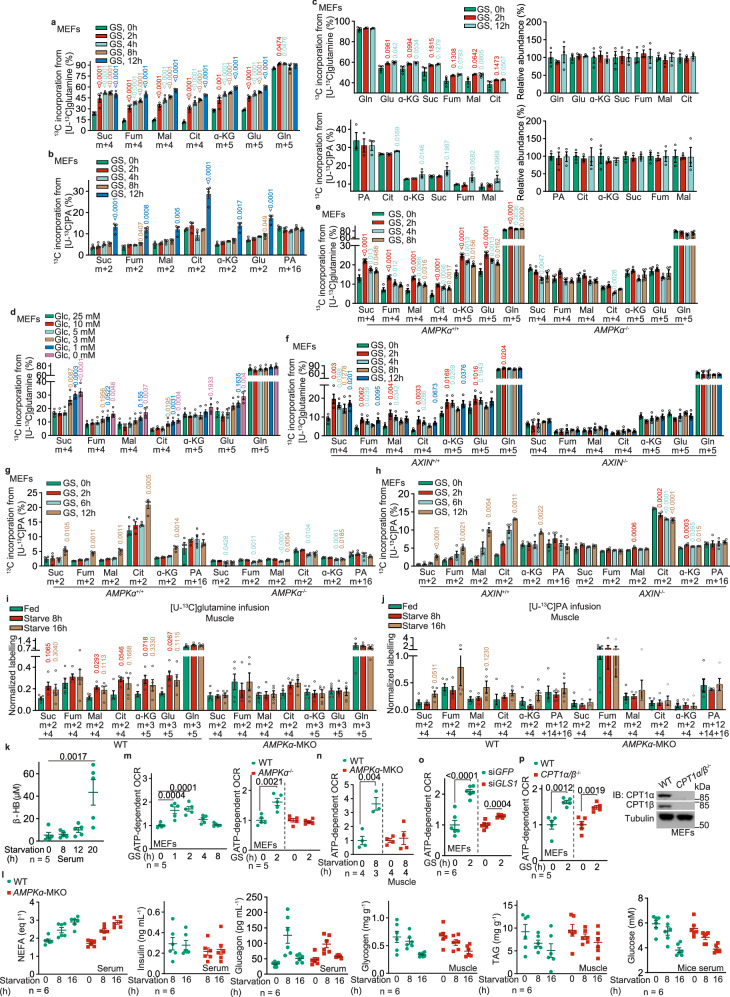
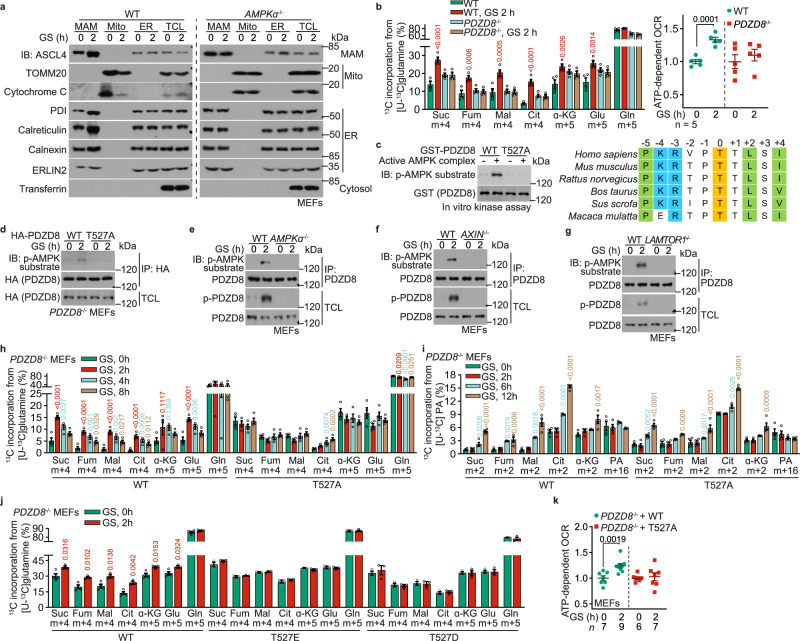
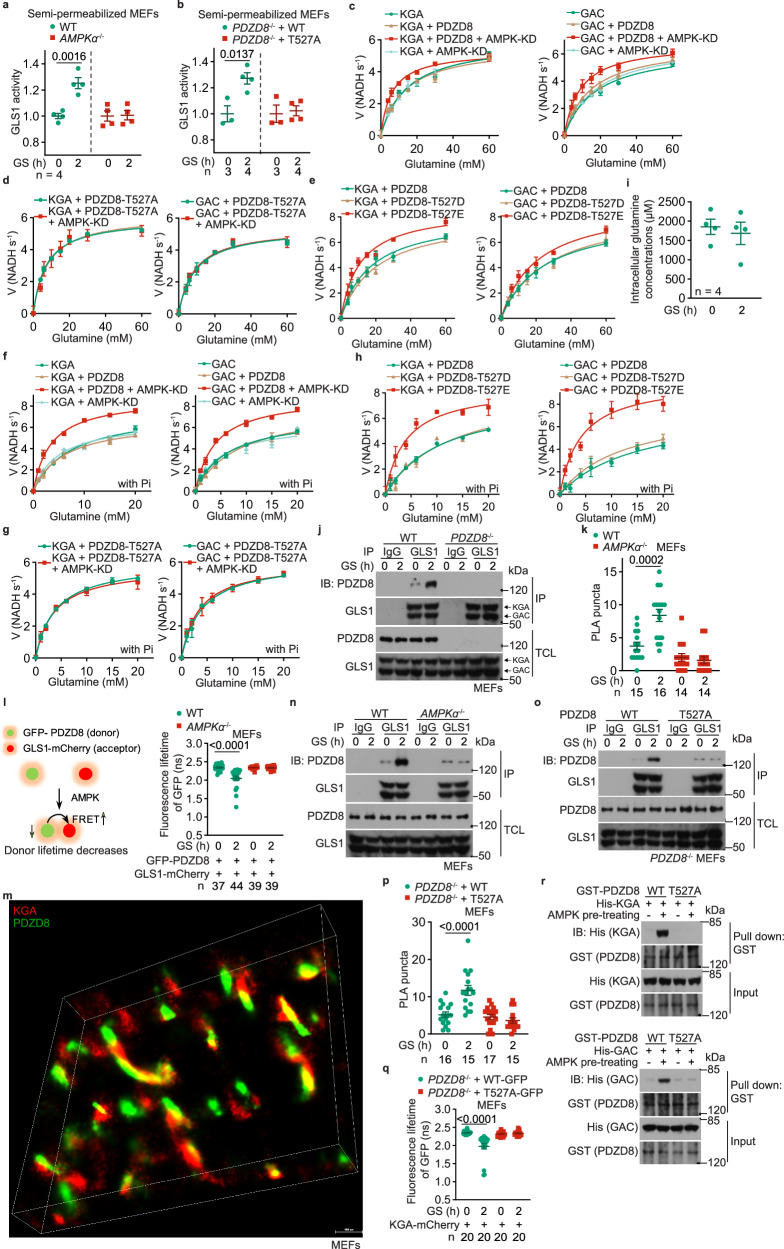
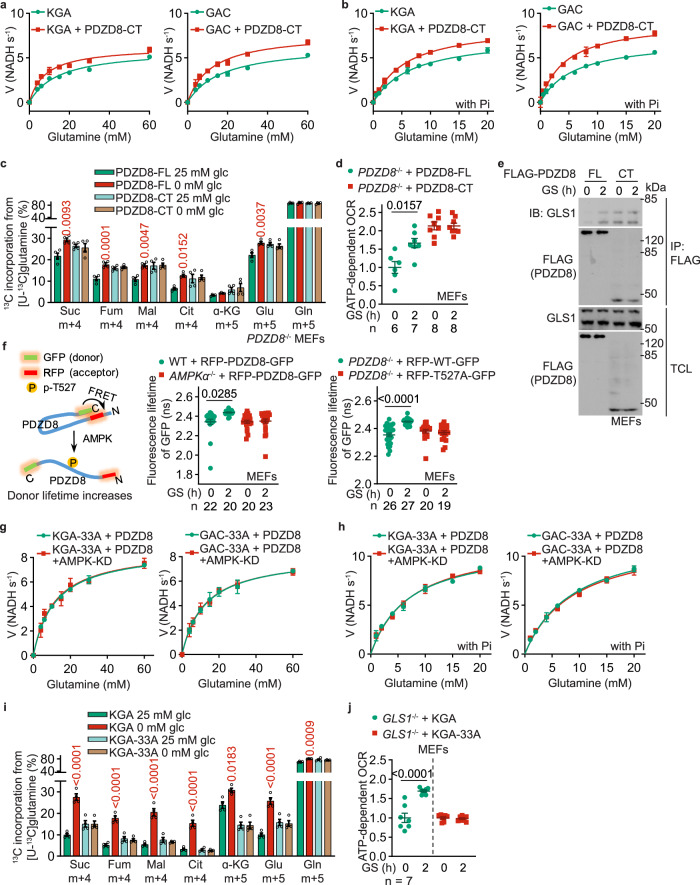
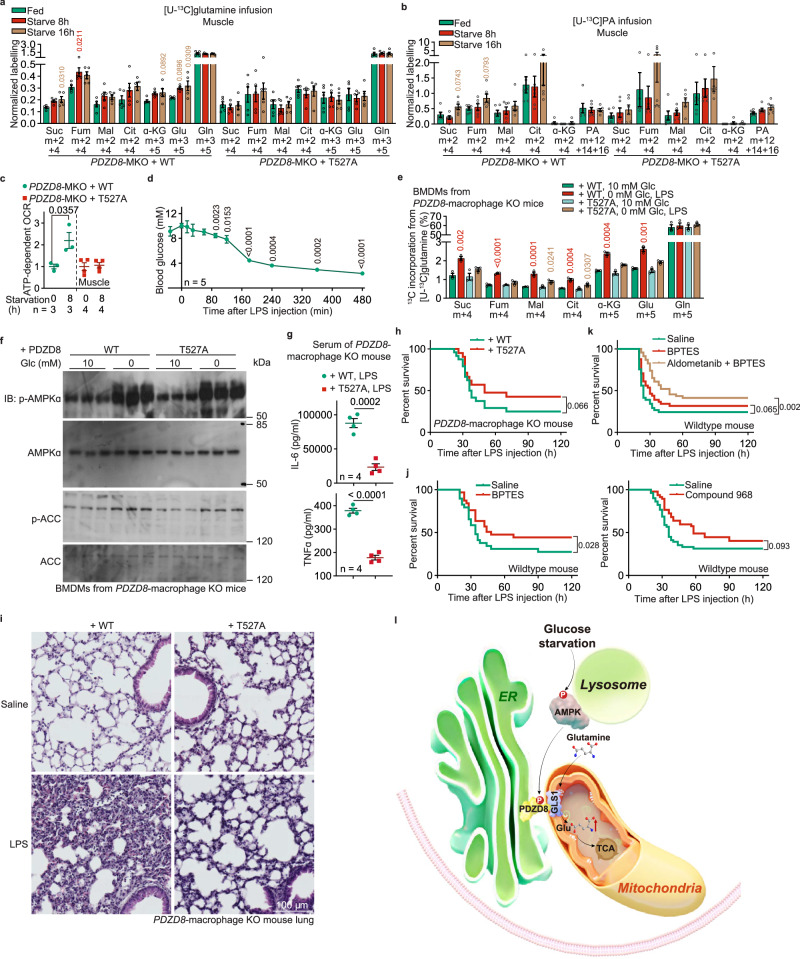
The shift of carbon utilization from primarily glucose to other nutrients is a fundamental metabolic adaptation to cope with decreased blood glucose levels and the consequent decline in glucose oxidation. AMP-activated protein kinase (AMPK) plays crucial roles in this metabolic adaptation. However, the underlying mechanism is not fully understood. Here, we show that PDZ domain containing 8 (PDZD8), which we identify as a new substrate of AMPK activated in low glucose, is required for the low glucose-promoted glutaminolysis. AMPK phosphorylates PDZD8 at threonine 527 (T527) and promotes the interaction of PDZD8 with and activation of glutaminase 1 (GLS1), a rate-limiting enzyme of glutaminolysis. In vivo, the AMPK-PDZD8-GLS1 axis is required for the enhancement of glutaminolysis as tested in the skeletal muscle tissues, which occurs earlier than the increase in fatty acid utilization during fasting. The enhanced glutaminolysis is also observed in macrophages in low glucose or under acute lipopolysaccharide (LPS) treatment. Consistent with a requirement of heightened glutaminolysis, the PDZD8-T527A mutation dampens the secretion of pro-inflammatory cytokines in macrophages in mice treated with LPS. Together, we have revealed an AMPK-PDZD8-GLS1 axis that promotes glutaminolysis ahead of increased fatty acid utilization under glucose shortage.


Conflict of interest statement

The authors declare no competing interests.

Figures

Fig. 1
Fig. 1. AMPK promotes glutaminolysis before promoting FAO in low glucose.
a, b, d Glutaminolysis is promoted ahead of the increase of FAO under low glucose. MEFs were glucose starved (GS) for desired durations (a, b), or incubated with a medium containing desired concentrations of glucose (d). At 20 min and 12 h before sample collection, cells were labeled with [U-13C]-glutamine (a, d) and [U-13C]-PA (b), respectively, followed by determination of the levels of labeled TCA cycle intermediates, including succinate (Suc), fumarate (Fum), malate (Mal), citrate (Cit), α-ketoglutarate (α-KG), along with glutamate (Glu), by gas chromatography-mass spectrometry (GC-MS). Levels of m + 5 α-ketoglutarate and glutamate; and m + 4 succinate, fumarate, malate, and citrate that reflect the rates of glutaminolysis (a, d), along with levels of m + 2 α-ketoglutarate, glutamate, succinate, fumarate, malate and citrate that reflect the rates of FAO (b), were shown. See also Supplementary information, Fig. S1b, c, f for the levels of other isotopomers of the labeled metabolites shown in (a, b, and d). Data are shown as mean ± SEM; n = 4 samples for each condition; P values were determined by one-way ANOVA, followed by Dunnett (d), Dunn (fumarate, malate, and α-KG of b), or Sidak (others). P values labeled in these panels represent the comparisons between the starved and the unstarved groups; same hereafter. c Glutamine utilization compensates for the reduction of glucose oxidation in the TCA cycle in low glucose. MEFs were separately labeled with [U-13C]-glutamine and [U-13C]-PA, all for 24 h, followed by glucose starvation for 2 h and 12 h. Show here are the relative contributions of each carbon source to the TCA cycle, as calculated by the total levels of labeled TCA cycle intermediates: ((m + 1) × 1 + (m + 2) × 2 + …… (m + n) × n)/n, in which n represents the number of labeled carbon numbers of each intermediate. See also abundance (pool size; calculated as (m + 0) + (m + 1) + (m + 2) + …… (m + n); all normalized to the unstarved group) of each TCA cycle intermediate on the right panels. Data are shown as mean ± SEM; n = 3 samples for each condition; P values were determined by one-way ANOVA, followed by Dunn (citrate of the upper left panel, and α-KG of lower left panel), Sidak (succinate, fumarate and malate of lower left panel), or Dunn (others). eh AMPK promotes the utilization of glutamine during early starvation in MEFs. Experiments in e and f (for determining glutaminolysis) were performed as in a, and those in g and h (for determining FAO) as in b) except that AMPKα–/– MEFs (e, g), AXIN–/– MEFs (f, h) were used. Data are shown as mean ± SEM; n = 4 samples for each condition; P values were determined by one-way ANOVA, followed by Dunn (malate and citrate of widetyp (WT) MEFs in f; fumarate, malate, α-KG of WT MEFs and succinate of AMPKα–/– MEFs in g; and malate and citrate of WT MEFs in h or Dunnet (others), all compared to the unstarved group. i, j AMPK promotes the utilization of glutamine during early starvation in mouse muscle. Mice were starved for desired durations, followed by jugular-vein infusion with [U-13C]-glutamine or [U-13C]-PA tracer, for 2 h, respectively. Mice were then sacrificed, followed by determining the rates of glutaminolysis and FAO as in a and b. After normalization to the serum levels of corresponding labeled tracers, data were shown as mean ± SEM; n = 5 samples for each condition; P values were determined by one-way ANOVA, followed by Dunn (fumarate of WT mice, and malate, fumarate, succinate, and PA of AMPKα-MKO mice of j) or Tukey (others), all compared to the unstarved group. k Induction of serum β-hydroxybutyrate, an indicator of hepatic FAO, occurs after prolonged starvation. Mice were starved for desired durations, followed by determining the levels of serum β-hydroxybutyrate (β-HB). Data are shown as mean ± SEM; n = 5 mice for each condition; P values were determined by one-way ANOVA, followed by Tukey. l Muscle-specific knockout of AMPKα does not change the levels of serum free fatty acid (NEFA), insulin and glucagon, plasma glucose, or muscle glycogen and triglyceride (TAG). Data are shown as mean ± SEM; n = 6 mice for each treatment/genotype; P values were determined by two-way ANOVA, followed by Sidak, all compared to the WT group. m, n AMPK axis promotes OCR during early starvation. WT MEFs and AMPKα–/– MEFs (m), or WT and AMPKα-MKO mice (n), were starved for desired durations, followed by determining OCR through Seahorse Analyzer. Data were normalized to the unstarved group of each genotype (same hereafter for all OCR measurements), and are shown as mean ± SEM; n values represent biological replicates for each condition, and were labeled in each panel; P values were determined by one-way ANOVA, followed by Tukey (left panel, m) or by unpaired two-tailed Student’s t-test (others). o, p Inhibition of glutaminolysis, but not FAO, prevents OCR increases. MEFs with GLS1 knockdown (o) or CPT1 knockout (p) were glucose-starved for 2 h (early starvation), followed by determining OCR as in o. Data are shown as mean ± SEM; n = 6 (o) or 5 (p) biological replicates for each condition; P values were determined by unpaired two-tailed Student’s t-test. See also knockout validation data of CPT1 on the right panel of p. Experiments in this figure were performed three times, except experiments in i were performed four times.
Fig. 2
Fig. 2. PDZD8 promotes the utilization of glutamine during early starvation.
a AMPK promotes the association between mitochondria and ER in low glucose. WT MEFs and AMPKα–/– MEFs were glucose-starved for 2 h and were subjected to the purification of MAM, mitochondria (mito), and ER. The formation of ER–mitochondria contact was determined either by the protein levels of markers for each subcellular structure via immunoblotting. b PDZD8 promotes glutaminolysis during early starvation. WT MEFs and PDZD8–/– MEFs were glucose-starved for 2 h, followed by determining the rates of glutaminolysis as in Fig. 1a. Data are shown as mean ± SEM; n = 4 biological replicates for each condition; P values were determined by two-way ANOVA, followed by Sidak, all compared to the unstarved condition. See also OCR levels, as determined through Seahorse Analyzer, in the right panel, in which data are shown as mean ± SEM; n = 5 biological replicates for each condition; P values were determined by unpaired two-tailed Student’s t-test. c AMPK phosphorylates T527 residue of PDZD8 in vitro. 1 μg of GST-tagged recombinant PDZD8 or its T527A mutant was incubated with 0.1 μg of holo-AMPK pre-phosphorylated by CaMKK2, followed by determining the phosphorylation of PDZD8 using immunoblotting (left panel). See also the typical AMPK substrate motif around the phosphoacceptor T527 residue (colored in yellow) of PDZD8, with the basic residues at –4 and –3 positions flanking T527 colored in blue, and the hydrophobic residues at –5, +2, and +4 in green (right panel). dg AMPK phosphorylates T527 residue of PDZD8 in cells. MEFs with HA-tagged PDZD8 or PDZD8-T527A stably expressed (d), or with knockout of AMPKα (e), AXIN (f), or LAMTOR1 (g), were glucose-starved for 2 h, followed by immunoprecipitation of HA-PDZD8 (d) or endogenous PDZD8 (eg). The immunoprecipitates were then subjected to immunoblotting to determine the levels of p-T527. hj AMPK-PDZD8 axis promotes the utilization of glutamine during early starvation. Experiments in h and j (for determining glutaminolysis) were performed as in Fig. 1e; and experiments in i were performed (for determining FAO) as in Fig. 1h; except that PDZD8–/– MEFs with WT PDZD8 or PDZD8-T527A re-introduction (h, i) or PDZD8-T527D/E re-introduction (j) were used. Data are shown as mean ± SEM; n = 4 (h, i, and the WT, unstarved group of j) or 3 samples (j, others) for each condition; P values were determined by one-way ANOVA, followed by Dunnet (h, i), or by unpaired two-tailed Student’s t-test (j). k AMPK-PDZD8 axis promotes OCR during early starvation. WT MEFs and PDZD8-T527A-reintroduced PDZD8–/– MEFs were starved for desired durations, followed by determining cellular OCR through the Seahorse analyzer. Data are shown as mean ± SEM; n = 4 biological replicates for each condition; P values were determined by unpaired two-tailed Student’s t-test. Experiments in this figure were performed three times.
Fig. 3
Fig. 3. PDZD8 promotes GLS1 activity.
a, b AMPK-PDZD8 axis promotes GLS1 activity in permeabilized cells. WT MEFs, AMPKα–/– MEFs (a), and WT PDZD8 or PDZD8-T527A-reintroduced PDZD8–/– MEFs (b) were glucose-starved for 2 h, followed by permeabilization with 0.01% (v/v) NP-40. The activities of GLS1, as evaluated by the production of glutamate after glutamine addition, were then measured. Data are shown as mean ± SD; n = 4 (a), or labeled on the panel (b; representing biological replicates) for each condition; P values were determined by Mann–Whitney test (T527A cells of b) and by unpaired two-tailed Student’s t-test (others). ch AMPK-PDZD8 axis promotes GLS1 activity in cell-free systems. Recombinant KGA (left panel) and GAC (right panel) isozymes of GLS1 were mixed with recombinant PDZD8 (c, f) or PDZD8-T527A (d, g), or PDZD8-T527D/E (e, h) protein that was pre-incubated with the constitutively active kinase domain of AMPKα (AMPK-KD; see “Phosphorylation of PDZD8 by AMPK in vitro” in the Materials and Methods section), followed by determination of the enzymatic activities of GLS1. In fh, 20 mM K2HPO4 (Pi) was added to the reactions. Data are shown as mean ± SD; n = 3 biological replicates for each condition. See also Km and kcat values for each reaction in Supplementary information, Table S2. The experiments in c and Fig. 4a were performed at the same time and shared control (the KGA- and GAC-alone groups), and ditto for f and Fig. 4b. i Glucose starvation does not change the intracellular levels of glutamine. Cells were glucose-starved for 2 h, and the intracellular levels of glutamine were determined via high-performance liquid chromatography-mass spectrometry (HPLC-MS). Data are shown as mean ± SEM; n = 4 samples for each condition; P values were determined by unpaired two-tailed Student’s t-test. j, n, o PDZD8 interacts with GLS1, depending on AMPK. WT MEFs and PDZD8–/– MEFs (j), AMPKα–/– MEFs (n), and WT PDZD8 or PDZD8-T527A-reintroduced PDZD8–/– MEFs (o), were glucose-starved for 2 h. Endogenous GLS1 proteins (both KGA and GAC) were immunoprecipitated, followed by immunoblotting to determine co-precipitated PDZD8. k, l, p, q AMPK promotes PDZD8–GLS1 interaction in situ. AMPKα–/– MEFs (k, l), or PDZD8–/– MEFs (p, q) were infected with lentiviruses carrying HA-tagged PDZD8 or PDZD8-T527A (k, p; for PLA), or GLS1 (KGA)-mCherry, along with GFP-PDZD8 (l, q; for FRET-FLIM assay, see strategy of this assay on the left panel of l) or GFP-PDZD8-T527A (q). Cells were then glucose-starved for 2 h, followed by quantifying the numbers of PLA puncta in each cell (k, p; data are shown as mean ± SEM; n (labeled on each panel) represents cell numbers for each condition), or measuring the fluorescence lifetime of GFP (the FRET donor; l, q; data are shown as mean ± SEM; n represents cells numbers for each condition); P values were determined by two-way ANOVA, followed by Tukey. m STORM images showing that PDZD8 is juxtaposed with GLS1 inside cells. MEFs stably expressing FLAG-tagged KGA and Myc-tagged PDZD8 were subjected to STORM imaging, and the representative, reconstituted 3D-STORM image is shown. r AMPK promotes PDZD8–GLS1 interaction in vitro. Recombinant His-tagged KGA (upper panel) and GAC (lower panel) isozymes of GLS1 were separately mixed with recombinant GST-tagged PDZD8 or PDZD8-T527A protein that was pre-incubated with AMPK pre-phosphorylated with CaMKK2 (see “Phosphorylation of PDZD8 by AMPK in vitro” in Materials and Methods section), followed by pulling down GST-tag and immunoblotting. Experiments in this figure were performed three times.
Fig. 4
Fig. 4. Interaction of PDZD8 promotes GLS1 activity.
a, b PDZD8-CT that constitutively interacts with GLS1, promotes GLS1 activity in vitro independently of AMPK. Recombinant KGA (left panel) or GAC (right panel) isozyme of GLS1 was mixed with recombinant PDZD8-CT, followed by determining the enzymatic activities of GLS1 in the presence (b) or absence (a) of 20 mM K2HPO4 (Pi). Data are shown as mean ± SD; n = 3 for each condition. See also Km and kcat values for each reaction in Supplementary information, Table S2. The experiments in (a) and Fig. 3c were performed at the same time and shared control (the KGA- and GAC-alone groups), and ditto for b and Fig. 3f. c, d PDZD8-CT promotes glutaminolysis and OCR in high glucose. PDZD8–/– MEFs were infected with lentiviruses carrying full-length (FL) PDZD8 or PDZD8-CT, followed by incubating in a medium containing doxycycline for 12 h. Cells were then labeled with [U-13C]-glutamine to determine glutaminolysis (c, performed as in Fig. 1a) or subjected to Seahorse analyzer to determine OCR (d). Data are shown as mean ± SEM; n = 4 (c), or labeled on the panel (d; representing biological replicates) for each condition; P values were determined by two-way ANOVA, followed by Tukey (P values in c represent the comparisons between the starved and the unstarved groups of each genotype). e AMPK releases the autoinhibition of PDZD8-NT towards PDZD8-CT. MEFs stably expressing FLAG-tagged PDZD8-FL or PDZD8-CT were glucose-starved for 2 h, followed by immunoprecipitation with anti-FLAG and immunoblotting for co-precipitated GLS1. f AMPK causes PDZD8-NT to move away from PDZD8-CT. AMPKα–/– MEFs (middle panel), or PDZD8–/– MEFs (right panel) were infected with lentiviruses carrying RFP-PDZD8-GFP (middle and right panels) or RFP-PDZD8-T527A-GFP (right panel), followed by determination of the fluorescence lifetime of GFP (FRET donor; see principles of this assay on the left panel). Data are shown as mean ± SEM; n values were labeled on the panel representing cell numbers; P values were determined by two-way ANOVA, followed by Tukey. gj GLS1-33A that loses the interface for PDZD8 fails to promote GLS1 activity (g, h), glutaminolysis (i), or OCR (j) in low glucose. Experiments in g and h were performed as in a and b, except that the recombinant KGA-33A (left panel) and GAC-33A (right panel) were mixed with AMPK-phosphorylated PDZD8. See also lowered Km and increased kcat values in each reaction in Supplementary information, Table S2. Experiments in i and j were performed as in c and d, except that GLS1–/– MEFs with WT KGA or KGA-33A stably expressed were used. Data are mean ± SD; n = 3 (g, h) or 4 (i), or labeled on the panel (j; representing biological replicates) for each condition; P values were determined by two-way ANOVA, followed by Tukey (i) or by unpaired two-tailed Student’s t-test (j). Experiments in this figure were performed three times.
Fig. 5
Fig. 5. AMPK-PDZD8-GLS1 axis is required for the promotion of glutaminolysis in low glucose in muscle and macrophages.
a, b PDZD8 depends on AMPK to promote the utilization of glutamine in muscle during early starvation. Mice with muscular PDZD8 replaced with WT PDZD8 or PDZD8-T527A were starved for 8 h or 16 h, followed by jugular-vein infusion with [U-13C]-glutamine or [U-13C]-PA tracer, for 2 h, respectively. Mice were then sacrificed, followed by determining the rates of glutaminolysis and FAO as in Fig. 1a, b, respectively. After normalization to the serum levels of corresponding labeled tracers, data were shown as mean ± SEM; n = 5 samples for each condition; P values were determined by one-way ANOVA, followed by Dunn (citrate and α-KG of WT, and fumarate, citrate and α-KG of T527A in b) or Tukey (others). c PDZD8 depends on AMPK to promote muscular OCR during early starvation. Mice with muscular PDZD8 replaced with WT PDZD8 or PDZD8-T527A were starved for 8 h, followed by determining OCR in muscle through Seahorse Analyzer. Data are shown as mean ± SEM; n = 3 (muscles from starved WT mice and the PDZD8-WT-reintroduced PDZD8-MKO mice), or 4 (others) biological replicates for each condition; P values were determined by unpaired two-tailed Student’s t-test. d Acute LPS treatment causes a decrease in blood glucose. Mice were peritoneally injected with 10 mg/kg LPS, followed by measuring blood glucose at the indicated time points. Results are shown as mean ± SEM; n = 5 mice, and P values were determined by one-way repeated-measures ANOVA followed by Tukey’s test. e, f PDZD8 depends on AMPK to promote glutaminolysis in macrophages in low glucose. BMDMs isolated from mice with macrophagic PDZD8 replaced with WT PDZD8 or PDZD8-T527A, were incubated in RPMI 1640 containing 10 mM or 0 glucose and 10 ng/mL LPS for 6 h. Cells were then lysed, followed by determining the rates of glutaminolysis as in Fig. 1a (e; cells labeled with [U-13C]-glutamine for 1 h before sample collection) and the activation of AMPK (f). Results in e are shown as mean ± SEM; n = 3 mice, and P values were determined by two-way ANOVA followed by Sidak. gi PDZD8 is required for the pro-inflammatory responses under LPS treatment in an AMPK-dependent manner. Mice with macrophagic PDZD8 replaced with WT PDZD8 or PDZD8-T527A were intraperitoneally injected with 10 mg/kg LPS and were divided into two batches. One batch was used to determine their survival (h), which is displayed as Kaplan–Meier curves (see also statistical analyses in Supplementary information, Table S3, and the same hereafter for all lifespan data). The other batch was used to determine the levels of IL-6 and TNF in serum (g, collected at 6 h after LPS injection; data shown are shown as mean ± SEM; n = 4 mice, and P values were determined by unpaired two-tailed Student’s t-test) and the damages of lungs (i, collected at 24 h after LPS injection). j, k Inhibition of glutaminolysis blocks the LPS-induced death in mice. WT mice were orally gavaged with 12.5 mg/kg BPTES, intraperitoneally injected with 10 mg/kg compound 968, or orally gavaged with 2 mg/kg aldometanib. After 0.5 h of injection, mice were intraperitoneally injected with 10 mg/kg LPS, followed by determining their survival. Survival curves are displayed as Kaplan–Meier curves. l Schematic diagram showing that AMPK-PDZD8 plays a crucial role in the shift of carbon utilization from glucose to glutamine. In low glucose, the ER-localized PDZD8 is phosphorylated at T527 by AMPK activated via the glucose-sensing pathway, which leads to the release of intramolecular autoinhibition (NT towards CT) of PDZD8. As a result, PDZD8 (CT) interacts with and activates the mitochondrial GLS1 and promotes glutaminolysis. Experiments in this figure were performed three times.

References

    1. Cahill, G. F. Jr Fuel metabolism in starvation. Annu. Rev. Nutr.26, 1–22 (2006). - DOI - PubMed
    1. Cahill, G. F. et al. Hormone-fuel interrelationships during fasting. J. Clin. Invest.45, 1751–1769 (1966). - DOI - PMC - PubMed
    1. Owen, O. E. et al. Brain metabolism during fasting. J. Clin. Invest.46, 1589–1595 (1967). - DOI - PMC - PubMed
    1. Owen, O. E., Felig, P., Morgan, A. P., Wahren, J. & Cahill, G. F. Jr Liver and kidney metabolism during prolonged starvation. J. Clin. Invest.48, 574–583 (1969). - DOI - PMC - PubMed
    1. Moir, A. M. & Zammit, V. A. Monitoring of changes in hepatic fatty acid and glycerolipid metabolism during the starved-to-fed transition in vivo. Studies on awake, unrestrained rats. Biochem. J.289, 49–55 (1993). - DOI - PMC - PubMed

LinkOut - more resources