. 2024 Jul;25(7):1231-1244.
doi: 10.1038/s41590-024-01860-7. Epub 2024 Jun 19.

Stem-like T cells are associated with the pathogenesis of ulcerative colitis in humans

Affiliations

Stem-like T cells are associated with the pathogenesis of ulcerative colitis in humans

Yingcong Li et al. Nat Immunol. 2024 Jul.

Abstract

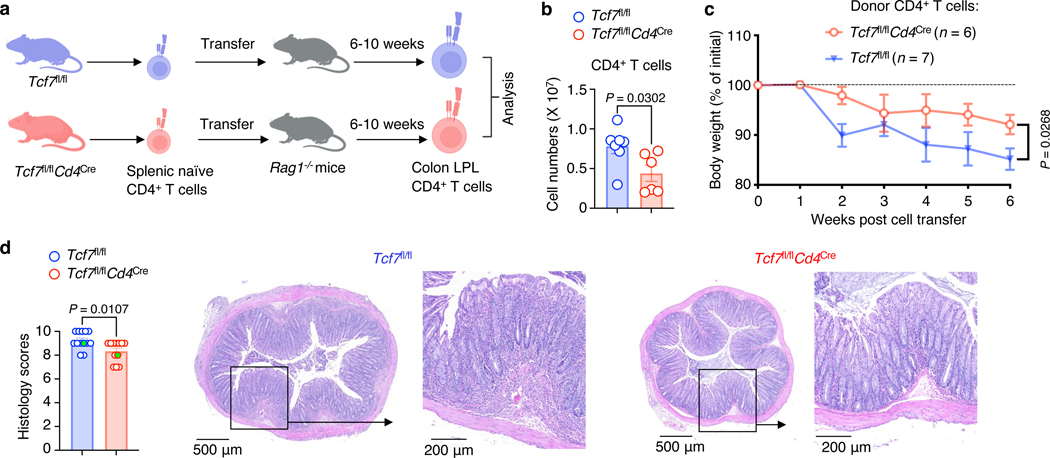
To understand the role of T cells in the pathogenesis of ulcerative colitis (UC), we analyzed colonic T cells isolated from patients with UC and controls. Here we identified colonic CD4+ and CD8+ T lymphocyte subsets with gene expression profiles resembling stem-like progenitors, previously reported in several mouse models of autoimmune disease. Stem-like T cells were increased in inflamed areas compared to non-inflamed regions from the same patients. Furthermore, TCR sequence analysis indicated stem-like T cells were clonally related to proinflammatory T cells, suggesting their involvement in sustaining effectors that drive inflammation. Using an adoptive transfer colitis model in mice, we demonstrated that CD4+ T cells deficient in either BCL-6 or TCF1, transcription factors that promote T cell stemness, had decreased colon T cells and diminished pathogenicity. Our results establish a strong association between stem-like T cell populations and UC pathogenesis, highlighting the potential of targeting this population to improve clinical outcomes.


Conflict of interest statement

Declaration of Interests

The authors declare no competing interests.

Figures

Extended Data Figure 1:
Extended Data Figure 1:. Stem-like T cells are present in colonic tissue
a, Flow-cytometric plots show sequential gating strategy used for isolating T cells from colonic tissue samples for single-cell RNA-seq, CITE-seq and TCR-seq analyses. b, Violin plots show the per-cell distribution of unique genes, unique molecular identifiers (UMI), and percentage of UMI mapped to mitochondrial genome in T cell clusters in colonic tissue samples (n = 36). Box plots extend from the 25th to 75th percentile and the center line represents the median. Whiskers are bounded by 25th percentile - 1.5*interquartile range or 75th percentile + 1.5*interquartile range. c, UMAP showing Seurat-based clustering of 13,887 T cells (7,047 CD8+, 6,743 CD4+ and 97 cycling T cells), colored based on cluster type; labels on clusters indicate T cell subsets and their assigned cluster identity. d, UMAP illustrating log normalized UMI counts of CD4 and CD8α surface antibody in single cells, measured by CITE-seq (top), and Seurat-normalized expression levels of CD4 and CD8A transcripts in single cells (bottom). e, GSEA plot shows enrichment of indicated gene signatures in the indicated cell clusters compared to the rest of the CD4+ and CD8+ T cells; q value (FDR) and normalized enrichment score (NES) determined using fgsea package on R.
Extended Data Figure 2:
Extended Data Figure 2:. Analysis of published single-cell transcriptomic studies in UC cohorts.
a, Analysis of published single-cell datasets from UC cohorts. UMAP showing Seurat-based clustering of colonic T cells, colored based on cluster type; the major T cell subsets (annotated by authors) present in each cluster are shown in Supplementary Table 5. UMAPs (left to right) show Seurat-normalized expression levels of genes enriched in the stem-like CD4+ T cells, stem- like CD8+ T cells, and CXCL13 or CXCR5 gene transcripts in single cells. Stem-like genes were identified in our dataset (Supplementary Table 4).
Extended Data Figure 3:
Extended Data Figure 3:. Stem-like T cells are enriched in inflamed regions.
a, Percentage of the CD4+ and CD8+ colonic T cell subsets from the indicated sources of colonic tissue samples obtained from each study subject. b, Plot shows Z-score average expression (color scale) and percentage of cells (size scale) that expressed the selected gene transcripts that were significantly enriched (FDR ≤ 0.05) in the indicated colonic CD8+ T cell clusters when compared to the other CD8+ T cells. c, UMAP shows Seurat-normalized expression levels of the indicated gene transcripts in single colonic CD8+ colonic T cells.
Extended Data Figure 4:
Extended Data Figure 4:. Expression of TFH and pro-inflammatory genes by colonic T cells in UC.
a, (Left) CD4, CD8, BCL-6 immunohistochemistry staining of colonic tissue samples. Indicated markers are light red, the CD31 marker staining, as described in methods, is in a dark brown color. (Right) BCL-6+CD4+ and BCL-6+CD8+ T cells counts from the indicated groups (n = 5 for healthy; n = 4 for inflamed tissue from patients with active UC). b, UMAPs show Seurat- normalized expression level of indicated gene transcripts in colonic CD4+ single cells. c, UMAP shows Seurat-normalized expression level of IL21R transcripts in colonic single CD4+ and CD8+ cells. Bar graphs in (a) depict mean± SEM, each symbol represents data from an individual human subject. Statistical significance for the comparisons was computed using Student’s unpaired two- tailed t test (a).
Extended Data Figure 5:
Extended Data Figure 5:. BCL-6-deficient mouse CD4+ T cells induced less colitis and had reduced TH17 cells
a, Flow-cytometric plots show sequential gating strategy for isolating CD4+CD45RBhighCD25 T cells from spleen. b, Three experimental repeats of adoptive T cell transfer model of colitis in which 2.5 × 10⁵ splenic CD4+CD45RBhighCD25 T cells from Bcl6fl/flCd4Cre mice or Bcl6fl/fl mice were transferred into Rag1−/− mice (numbers of mice in each experiment are shown in the figure); Body weight measurements of recipient Rag1−/− mice; plots depicts mean ± SEM. c, Flow- cytometric plots show sequential gating strategy for isolating CD4+ T cells from colon LP of recipient Rag1−/− mice and analyzing cells for intracellular cytokine production. d, Representative flow cytometry contour plots and frequency of colon LP CD4+ T cells that express the indicated cytokines following ex vivo stimulation with PMA plus ionomycin for 4 hours (Bcl6fl/fl n = 4; Bcl6fl/flCd4Cre n = 5). e, UMAPs show Seurat-normalized expression levels of Ccl5 and Gzmk gene transcripts in single colonic CD4+ T cells. f, Representative flow cytometry contour plots and frequency of CD4+ T cells that express IL-17A after in vitro differentiation under TH17 conditions (Bcl6fl/fl n = 3; Bcl6fl/flCd4Cre n = 3); experiment was performed once. Bar graphs in (d, f) depict mean ± SEM, each symbol represents data from an individual mouse; all data from are representative from one of at least two independent experiments with similar results. Statistical significance for the comparisons was computed using two-way ANOVA (b), Student’s unpaired two-tailed t test (d, f).
Extended Data Figure 6:
Extended Data Figure 6:. TCF1-deficiency attenuated pathogenicity of CD4+ T cells
a, (Left) CD4, CD8, TCF1, and Hoechst immunofluorescence staining of colonic tissues. TCF1 detects proliferating epithelial cells as well as some T cells. Nuclear TCF1 staining in T cells is surrounded by a rim of CD4 or CD8 staining, as indicated by arrows for representative cells. (Right) TCF1+CD4+ and TCF1+CD8+ T cell counts from the indicated groups (n = 7 for healthy; n = 11 for inflamed tissue from patients with active UC). b, CD4+ T cell numbers from colon LP of the indicated recipient Rag1−/− mice (Tcf7fl/fl n = 6; Tcf7fl/flCd4Cre n = 6). c, Frequency of unstimulated colon LP CD4+ T cells that expressed surface CD8α or FOXP3+ and colon CD4+ T cells that expressed IFNγ or IL-17A following ex vivo stimulation with PMA plus ionomycin for 4 hours (Tcf7fl/fl n = 7; Tcf7fl/flCd4Cre n = 6). d, Body weight measurements of recipient Rag1−/− mice (Tcf7fl/fl n = 6; Tcf7fl/flCd4Cre n = 6); the graph depicts mean ± SEM. Bar graphs in (a) depict mean ± SEM, each symbol represents data from an individual human subject. Bar graphs in (b-c) depict mean ± SEM, each symbol represents data from an individual mouse. Data (b-c) are representative from one of at least two independent experiments with similar results. Statistical significance for the comparisons was computed using Mann-Whitney two-sided test (a), Student’s unpaired two-tailed t test (b,c), two-way ANOVA (d).
Extended Data Figure 7:
Extended Data Figure 7:. TCF1 expressing stem-like mouse CD4+ T cells induced more colitis
a, Flow-cytometric plots showing co-staining of intracellular GFP and TCF1 in the indicated mice. b, Flow-cytometric plots showing the frequency of GFP+CD4+ and GFP+CD8+ T cells in the spleen of Tcf7GFP reporter mice. c, GSEA plot shows enrichment of the indicated gene signatures in the GFP+CD4+ and GFPCD4+ T cells in colon LP lymphocytes (LPL) of recipient Rag1−/− mice. d, Body weight measurements of the secondary recipient Rag1−/− mice (n = 4 or 6 for each group); the graph depicts mean ± SEM. e, Representative histology images in Fig. 7d. f, CD4+ T cell numbers from colon LP of the indicated recipient Rag1−/− mice (n = 4 or 6 for each group). Bar graphs in (f) depict mean ± SEM, each symbol represents data from an individual mouse. Data (d,e,f) are from one experiment. Statistical significance for the comparisons was computed using two-way ANOVA (d), Kruskal–Wallis test and adjustments were made for multiple comparisons (f).
Extended Data Figure 8:
Extended Data Figure 8:. Mouse colonic CD8+ T function was dependent of CD4+ T cells
a, Flow-cytometric plots show sequential gating strategy used for isolating TCRβ+CD8β+CD4- T cells from spleen. b, Histology scores for the degree of colon tissue inflammation (n = 5 for CD4+ + CD8+ T cell transfer; n = 6 for CD8+ T cell transfer). c, Representative flow cytometry contour plots and frequency of colon LP CD8+ T cells that expressed the indicated cytokines following ex vivo stimulation with PMA-Ionomycin for 4 hours (n = 5 for CD4+ + CD8+ T cell transfer; n = 6 for CD8+ T cell transfer). Bar graphs in (b,c) depict mean ± SEM, each symbol represents data from an individual mouse; all data from are representative of one of two independent experiments with similar results except that histology in (b) was performed only once. Statistical significance for the comparisons was computed using one-way ANOVA (b), Student’s unpaired two-tailed t test (c).
Figure 1:
Figure 1:. Stem-like CD4 and CD8 T cells were found in colonic tissue
a, Study overview. b, Single-cell transcriptomes of colonic T cells from healthy controls and UC patients displayed by uniform manifold approximation and projection (UMAP). Seurat-based clustering of 13,887 T cells, colored based on cluster type; labels indicate assigned T cell subset cluster identity. c, Gene set enrichment analysis (GSEA) plot shows enrichment of the indicated gene signatures (Supplementary Table 3) obtained from the sources shown. False discovery rate (FDR) and normalized enrichment score (NES) determined using fgsea package on R. d, Plot shows Z-score average expression (color scale) and percentage of cells (size scale) that expressed selected marker gene transcripts that were significantly enriched (FDR ≤ 0.05) in the indicated cluster when compared to the other colonic CD8+ T cells. e, Shows similar plots for CD4+ T cells.
Figure 2:
Figure 2:. Stem-like CD8+ T cells in inflamed tissue are related to pathogenic T cells
a, Percentages of the indicated CD8+ T cell subsets in the four indicated sources of colonic tissue, including healthy controls (n = 5), patients in remission (n = 7), non-inflamed tissue from those with active disease (n = 10), and inflamed tissue (n = 14). Data from paired non-inflamed and inflamed colonic tissue samples of patients with active UC (n = 10) shown below. b, Plot shows Seurat-normalized mean expression (color scale) and percentage of cells (size scale) that expressed selected transcripts significantly enriched (FDR ≤ 0.05) in stem-like CD8+ T cell when compared to the remainder of the colonic CD8+ T cells. c, UMAP shows Seurat-normalized expression levels of the indicated transcripts in single CD8+ T cells. d, Transcripts significantly enriched in the main groups of colonic CD8+ T cells from the four tissue sources. e, Single-cell TCR sequence analysis of CD8+ T cells isolated from inflamed colonic tissue of patients with active UC. The bars show the number of cells with shared TCRs, subsets with shared TCRs indicated by the vertical lines. f, UMAP shows stem-like CD8+ T cells that shared TCR sequences with TC17 and TGZMK cells. Bar graphs in a depict mean± SEM, each symbol represents data from an individual subject. Statistical significance for the comparisons was computed using Kruskal–Wallis test and adjustments were made for multiple comparisons (a, top) and Student’s paired two-tailed t test (a, bottom); *P < 0.05, **P < 0.01, ***P < 0.001 and ns, non-significant P value.
Figure 3:
Figure 3:. Stem-like CD4+ T cells were clonally related to TH17 cells through an intermediary population
a, Percentage of the indicated CD4+ T cell subsets from the indicated sources of colonic tissue obtained from healthy controls (n = 5), patients with UC in remission (n = 7), with active disease from non-inflamed tissue (n = 10) and inflamed tissue (n = 14); Data from paired inflamed and non-inflamed colonic tissue samples from patients with active UC is shown below (n = 10). b, Single-cell trajectory analysis showing relationship between cells in different CD4+ T cells clusters (line), constructed using Monocle 3 and visualized by UMAP. c, Plot shows Z-score average expression (color scale) and percentage of cells (size scale) that expressed selected transcripts that are significantly enriched (FDR ≤ 0.05) in stem-like CD4+ T cells and TH17 cells. d, UMAP shows Seurat-normalized expression of indicated gene transcripts in single colonic CD4+ T cells. e, Heatmap showing expression of the significantly enriched transcripts (adjusted P value < 0.05) in the indicated clusters. f, Single-cell TCR sequence analysis of CD4+ T cells isolated from inflamed colonic tissue of patients with active UC. The bars show the number of cells with shared TCRs, the subsets with shared TCRs indicated by the vertical lines. g, UMAP shows stem-like CD4+ T cells that shared TCR sequences with TINT and TH17 cells clusters. h, Plot shows the correlation between the proportion of stem-like CD4+ and CD8+ T cells present in inflamed colonic tissues of patients with active UC (n = 14). Bar graphs in a depict mean± SEM, each symbol represents data from an individual subject. Statistical significance for the comparisons was computed using Kruskal–Wallis test and adjustments were made for multiple comparisons (a, top), and Student’s paired two-tailed t test (a, bottom); Significance for the correlation in (h) was computed using Spearman correlation; *P < 0.05, **P < 0.01, ***P < 0.001 and ns, non-significant P value.
Figure 4:
Figure 4:. BCL-6 deficiency attenuated the pathogenicity of CD4+ T cells
a, Illustration of the adoptive T cell transfer model of colitis. b, Body weight measurements of recipient Rag1−/− mice; the graph depicts mean ± SEM (n = 6 for each genotype). c, (Left) Histology scores for the degree of colon tissue inflammation (n = 6 for each genotype); two samples with filled green dots were shown in the representative images. (Right) Hematoxylin and eosin (H&E) staining of mouse colon tissues from Rag1−/− mice that received the indicated CD4+ T cells. Scale bars indicated. d, CD4+ T cell numbers from colon LP of the indicated recipient Rag1−/− mice (Bcl6fl/fl n = 4; Bcl6fl/flCd4Cre n = 5). e, Representative flow cytometry contour plots and frequency of colon LP CD4+ T cells that expressed the indicated cytokines following ex vivo stimulation with Phorbol 12-myristate 13-acetate plus ionomycin for 4 hours (left), and unstimulated CD4+ T cells that expressed surface CD8α (right) (Bcl6fl/fl n = 4; Bcl6fl/flCd4Cre n = 5). Bar graphs in (c,d,e) depict mean ± SEM, each symbol represents data from an individual mouse; data (b,d,e) are representative from one of at least two independent experiments with similar results. Statistical significance for the comparisons was computed using two-way ANOVA (b), Student’s unpaired two-tailed t test (c,d,e).
Figure 5:
Figure 5:. BCL-6 deficiency impaired TH17 and CD4+ CTL development
a, Single-cell transcriptomes of colon LP CD4+ T cells from recipient Rag1−/− mice displayed by UMAP. Seurat-based clustering of 18,860 cells combined from WT and Bcl6fl/flCd4Cre mice, colored based on cluster type. b, RNA velocity analysis visualized by UMAP depicting likely developmental trajectories of WT (top) and BCL-6 deficient (lower) CD4+ T cells. Arrows indicate velocity streamlines. c, UMAPs show Seurat-normalized expression levels of Il17a and Il22 gene transcripts in single colonic CD4+ T cells. d, GSEA plot shows enrichment of TFH and TH17 gene signatures in cluster 4 compared to the rest of the colonic CD4+ T cells; P value and normalized enrichment score (NES) determined using fgsea package on R. e, UMAPs show colonic CD4+ T cells from each Rag1−/− mice that received BCL-6-deficient or WT CD4+ T cells. (Right) Plot shows the percentage of CD4-CTL (cluster 2) and TH17 (cluster 4) cells in the indicated recipient Rag1−/− mice (Bcl6fl/fl n = 6; Bcl6fl/flCd4Cre n = 6). Bar graphs in (e) depict mean ± SEM, each symbol represents data from an individual mouse. Statistical significance for the comparisons was computed using Student’s unpaired two-tailed t test (e).
Figure 6:
Figure 6:. TCF1-deficiency attenuated pathogenicity of CD4+ T cells
a, Illustration of the adoptive T cell transfer model of colitis with 2.5 × 10⁵ splenic CD4+CD45RBhighCD25 T cells from Tcf7fl/flCd4Cre mice or Tcf7fl/fl mice transferred into Rag1−/− mice. b, CD4+ T cell numbers from colon LP of the indicated recipient Rag1−/− mice (Tcf7fl/fl n = 7; Tcf7fl/flCd4Cre n = 6). c, Body weight measurements of recipient Rag1−/− mice; the graph depicts mean ± SEM (Tcf7fl/fl n = 7; Tcf7fl/flCd4Cre n = 6). d, (Left) Histology scores for the degree of colon tissue inflammation (combination of 2 independent experiments; Tcf7fl/fl n = 13; Tcf7fl/flCd4Cre n = 12); two samples with filled green dots were shown as representative images on the right. (Right) Hematoxylin and eosin (H&E) staining of mouse colon tissues from Rag1−/− mice that received the indicated CD4+ T cells. Scale bars indicated. Bar graphs in (b,d) depict mean ± SEM, each symbol represents data from an individual mouse; data (b,c) are representative from one of at least two independent experiments with similar results. Statistical significance for the comparisons was computed using Student’s unpaired two-tailed t test (b,d), two-way ANOVA (c).
Figure 7:
Figure 7:. TCF1-expressing stem-like mouse CD4+ T cells induced more colitis
a, Illustration of the secondary adoptive T cell transfer model of colitis with 2.5 × 10⁵ splenic CD4+CD45RBhighCD25- T cells from Tcf7GFP reporter mice transferred into Rag1−/− mice. 8 weeks later, GFP+ or GFPneg CD4+ T cells from the LP lymphocytes (LPL) or spleen and mesenteric lymph nodes (MLNs), labeled as secondary lymphoid organs (SLO), were transferred into separate cohorts of disease-free Rag1−/− mice. b, Representative flow cytometry contour plots show frequency of GFP-expressing CD4+ T cells in recipient Rag1−/− mice following the primary transfer. c, Body weight measurements of the recipient Rag1−/− mice in the secondary transfer model; the graph depicts mean ± SEM. d, Histology scores for the degree of colon tissue inflammation (n = 7 or 8 for each group); samples with filled green dots were shown as representative images in Extended Data Fig. 7e. e, Representative flow cytometry contour plots of colon LPL from the recipient Rag1−/− mice in the secondary transfer model. f, CD4+ T cell numbers from colon LP of the indicated recipient Rag1−/− mice in the secondary transfer (n = 7 or 8 for each group). Bar graphs in (d,f) depict mean ± SEM, each symbol represents data from an individual mouse; data (d,f) are from one experiment. Statistical significance for the comparisons was computed using two-way ANOVA (c), Kruskal–Wallis test and adjustments were made for multiple comparisons (d,f).
Figure 8:
Figure 8:. Effects of CD4+ T cells on CD8+ T cells
a, Illustration of the adoptive T cell transfer model of colitis with 1 × 10⁵ splenic naïve CD4+CD45RBhighCD25- T cells and/or 5 × 10⁵ splenic TCRβ+CD8β+CD4- T cells transferred into Rag1−/− mice. b, Body weight measurements of recipient Rag1−/− mice. The plot depicts mean ± SEM. c, Representative flow cytometry contour plots and numbers of colon LP CD4+ and CD8+ T cells (CD4+ T cell transfer and CD4+ + CD8+ T cell transfer, n = 5; CD8+ T cell transfer n = 6). d, Illustration of the adoptive T cell transfer model of colitis with splenic wildtype naïve CD4+CD45RBhighCD25 T cells and splenic TCRβ+CD8β+CD4 T cells from Bcl6fl/flCd8aCre mice or Bcl6fl/fl mice. e, CD8+ T cell numbers from colon LP of the indicated recipient Rag1−/− mice (Bcl6fl/fl n = 5; Bcl6fl/flCd8aCre n = 6). f, (Top) Single-cell transcriptomes of colon LP CD8+ T cells from recipient Rag1−/− mice displayed by UMAP. Seurat-based clustering of cells from Bcl6fl/fl and Bcl6fl/flCd8aCre mice, colored based on cluster type. (Bottom) Plot shows the percentage of stem-like CD8+ T cells in the indicated recipient Rag1−/− mice. g, UMAPs show Seurat-normalized expression levels of indicated gene transcripts or Tcf7+CD8+ T cell gene signature in single colonic CD8+ T cells. h, GSEA plot shows enrichment of the indicated gene signatures in the indicated clusters compared to the rest of the colonic CD8+ T cells. i, Violin plot shows Seurat-normalized expression levels of Gzmb transcripts in single colonic CD8+ T cells. j, Representative flow cytometry plot and mean fluorescence intensity (MFI) of colon LP CD8+ T cells that expressed Granzyme B following ex vivo stimulation (Bcl6fl/fl n = 5; Bcl6fl/flCd8aCre n = 6). Bar graphs in (c,e,f,j) depict mean ± SEM, each symbol represents data from an individual mouse; all data from are representative of one of two independent experiments. Statistical significance for the comparisons was computed using two-way ANOVA (b), Student’s unpaired two-tailed t test (c,e,f,j).

References

    1. Kobayashi T. et al. Ulcerative colitis. Nature Reviews Disease Primers 6, 74 (2020). 10.1038/s41572-020-0205-x - DOI - PubMed
    1. de Souza HSP & Fiocchi C. Immunopathogenesis of IBD: current state of the art. Nature Reviews Gastroenterology & Hepatology 13, 13–27 (2016). 10.1038/nrgastro.2015.186 - DOI - PubMed
    1. Hirten RP & Sands BE New Therapeutics for Ulcerative Colitis. Annual Review of Medicine 72, 199–213 (2021). 10.1146/annurev-med-052919-120048 - DOI - PubMed
    1. Smillie CS et al. Intra- and Inter-cellular Rewiring of the Human Colon during Ulcerative Colitis. Cell 178, 714–730.e722 (2019). 10.1016/j.cell.2019.06.029 - DOI - PMC - PubMed
    1. Corridoni D. et al. Single-cell atlas of colonic CD8(+) T cells in ulcerative colitis. Nat Med 26, 1480–1490 (2020). 10.1038/s41591-020-1003-4 - DOI - PubMed

Methods-only references

    1. Maaser C. et al. ECCO-ESGAR Guideline for Diagnostic Assessment in IBD Part 1: Initial diagnosis, monitoring of known IBD, detection of complications. J Crohns Colitis 13, 144–164 (2019). 10.1093/ecco-jcc/jjy113 - DOI - PubMed
    1. Rubin DT, Ananthakrishnan AN, Siegel CA, Sauer BG & Long MD ACG Clinical Guideline: Ulcerative Colitis in Adults. Am J Gastroenterol 114, 384–413 (2019). 10.14309/ajg.0000000000000152 - DOI - PubMed
    1. Picelli S. et al. Full-length RNA-seq from single cells using Smart-seq2. Nat Protoc 9, 171–181 (2014). 10.1038/nprot.2014.006 - DOI - PubMed

MeSH terms

Substances