. 2024 Jul;16(7):1560-1578.
doi: 10.1038/s44321-024-00082-6. Epub 2024 Jun 19.

Mutation analysis in individual circulating tumor cells depicts intratumor heterogeneity in melanoma

Affiliations

Mutation analysis in individual circulating tumor cells depicts intratumor heterogeneity in melanoma

Mark Sementsov et al. EMBO Mol Med. 2024 Jul.

Abstract

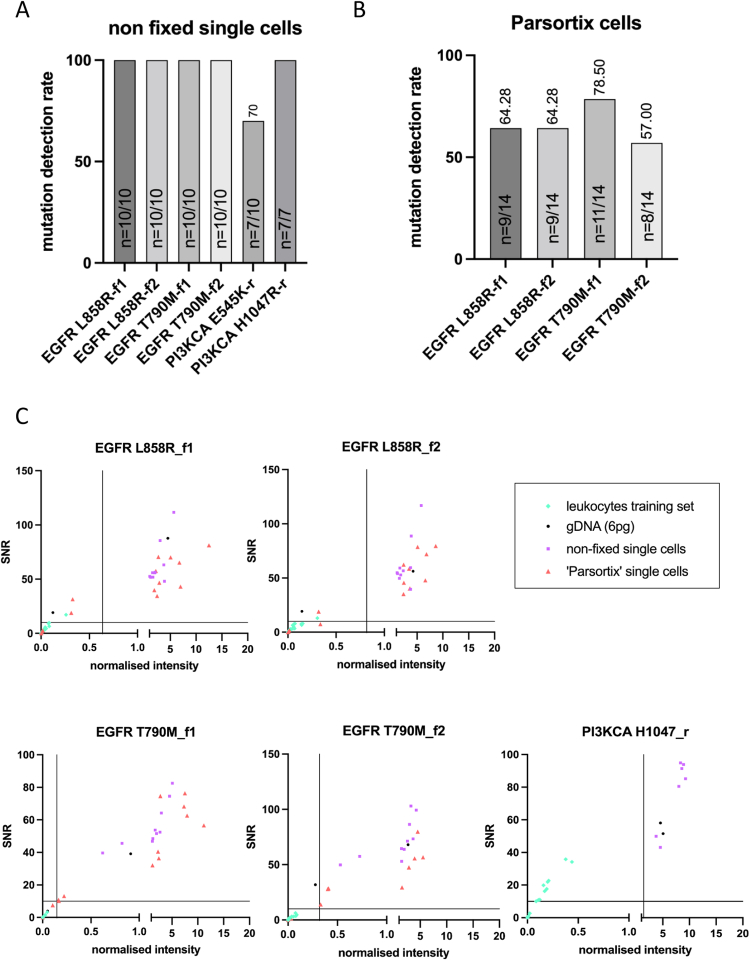
Circulating tumor DNA (ctDNA) is the cornerstone of liquid biopsy diagnostics, revealing clinically relevant genomic aberrations from blood of cancer patients. Genomic analysis of single circulating tumor cells (CTCs) could provide additional insights into intra-patient heterogeneity, but it requires whole-genome amplification (WGA) of DNA, which might introduce bias. Here, we describe a novel approach based on mass spectrometry for mutation detection from individual CTCs not requiring WGA and complex bioinformatics pipelines. After establishment of our protocol on tumor cell line-derived single cells, it was validated on CTCs of 33 metastatic melanoma patients and the mutations were compared to those obtained from tumor tissue and ctDNA. Although concordance with tumor tissue was superior for ctDNA over CTC analysis, a larger number of mutations were found within CTCs compared to ctDNA (p = 0.039), including mutations in melanoma driver genes, or those associated with resistance to therapy or metastasis. Thus, our results demonstrate proof-of-principle data that CTC analysis can provide clinically relevant genomic information that is not redundant to tumor tissue or ctDNA analysis.

Keywords: Circulating Tumor Cells; Heterogeneity; Melanoma; Tumor.


Conflict of interest statement

MS, LO, JK, AL, BS, IH, JCS, AA, YB, HW, BD, SR, SD, BV, GR, RS, SP, KP, and LK declare no competing interest. AS and DI are employees of Agena Bioscience and hold shares of Mesa Labs. PM declares participation in Data Safety Monitoring Advisory Boards for MSD, Pierre Fabre, GSK, Roche, Bristol Myers Squibb, Novartis, Sanofi, Beiersdorf, Almirall, Hermal, AMGEN, and Sun-Pharma. CG is a member of the advisory board of, and has received honoraria and travel expenses from Almirall, Amgen, Beiersdorf, BioNTech, Bristol-Myers Squibb, Immunocore, Janssen, MSD Sharp & Dohme, Novartis, Pierre-Fabre, Roche, Sanofi Genzyme, SUN Pharma, Sysmex, ouside the submitted work; CG holds shares of Dermagnostix.

Figures

Figure 1
Figure 1. Melanoma CTC analysis complements ctDNA analysis for mutation detection
(A) Left: Schematic figure of the Parsortix® enrichment workflow with melanoma tumor cell lines. Left panel: melanoma tumor cells were spiked into ‘Transfix’ blood, captured in the Parsortix® cassette and harvested on a slide for staining to be picked by manual micromanipulation. Created using BioRender.com. Right panel: Recovery rate obtained for each assay on single cell with Parsortix® enrichment. Detection rate is displayed above the bar and the number of cells with successful mutation detection over the number of efficiently lysed cells is mentioned within bars. Note that recovery data are presented for each PCR assay in case multiple PCR assays for the same mutation are present in the panel. (B) Number of mutations in ctDNA or CTCs in samples with both sufficient amount of cfDNA and at least one CTC efficiently lysed, as defined by internal process controls. Of note, the assays with positive signals observed in the leukocytes validation set have been removed. P-value was calculated using the Wilcoxon signed-rank test for paired data. (C) Landscape of the mutations detected in the different melanoma samples (tissue, cfDNA, CTC). On the top of the panel, patient ID is indicated with the type of sample analyzed. We distinguished samples obtained before initiation of treatment from those obtained during treatment. For patient 26, we grouped the 3 samples obtained during treatment. ‘Tissue UltraSEEK’ stands for the analysis of gDNA from a tumor tissue sample with UltraSEEK® Melanoma Panel. The assays with positive values on leukocytes validation set are marked with an asterisk. SDHD.Mut3 stands for SDHD mutation Chr11:111, 957,544 C > T. Source data are available online for this figure.
Figure 2
Figure 2. Mutation detection on different individual CTCs isolated with CellSearch® and DEPArray™ combined workflow.
(A) Left: Schematic figure of the CellSearch®/DEPArray™ enrichment workflow with melanoma and breast tumor cell lines. Left panel: melanoma or breast tumor cells were spiked into ‘CellSave’ blood, captured on the CellSearch® platform and isolated as single cells with the DEPArray™ system. Created using BioRender.com. Right panel: Recovery rate obtained for each assay on single cell with CellSearch®/DEPArray™ enrichment. The detection rate is displayed above the bar and the number of cells with successful mutation detection over the number of efficiently lysed cells is mentioned within bars. Note that recovery data are presented for each PCR assay in case multiple PCR assays for the same mutation are present in the panel. (B, C) Illustrative picture of melanoma CTCs and of the mutation calls in 2 melanoma patients (B. patient MEL21; C. Patient MEL31). Scale bar represents ca. 10 µm. (D) Illustrative picture of breast cancer CTCs and its subsequent analysis with UltraSEEK® protocol (for 8 CTCs) or sequencing after WGA (for 6 CTCs). Successful cell lysis and gDNA amplification was obtained in 4/8 CTCs with UltraSEEK® protocol and from 2/6 CTCs after WGA quality control. PI3KCA E545K mutation was detected in 4/4 CTC and 1/2 CTC, respectively. Scale bar represents ca. 10 µm. Source data are available online for this figure.
Figure EV1
Figure EV1. Mutation detection at the single cell level with the UltraSEEK Melanoma Panel.
(A) The UltraSEEK® Melanoma Panel was tested on 5 mutations (certain mutations are detected by 2 different assays in the same panel) with our modified protocol on individual cells from melanoma tumor cell lines not chemically preserved. The number of cells with successful mutation detection over the number of efficiently lysed cells is mentioned. Created with BioRender.com. (B) Normalized intensity and signal to noise ratio (SNR) values obtained for each PCR assay for gDNA tested at 6.6 pg input in duplicate, not chemically preserved single cells and ‘Parsortix’ processed single cells. The horizontal line represents the threshold value of SNR (set to 10) and of the normalized intensity calculated on leukocytes. For MAP2K1 P124S_f2, only non-fixed single cells data are displayed due to the positive signal observed on one leukocyte that led to excluding this assay from further analysis. Source data are available online for this figure.
Figure EV2
Figure EV2. Melanoma CTC enrichment with Parsortix® workflow.
(A) Cell recovery rate for different melanoma cell lines. Recovery rate was calculated from spiking 30 melanoma cells into blood of healthy donors. Each dot represents one technical replicate, bar height represents the mean of recovery rate and error bars Standard Deviation. (B) Illustration of melanoma CTCs found in patients. CTCs were defined as nucleated elements (DRAQ5 positive) either MCAM/NG2-positive and/or Melanoma-marker/S100B-positive but CD45/CD16-negative cells. Source data are available online for this figure.
Figure EV3
Figure EV3. Mutation detection at the single cell level with the UltraSEEK® Lung Panel.
(A) The UltraSEEK® Lung Panel was tested on 2 EGFR mutations and 2 PI3KCA mutations with our modified protocol on individual cells from lung (H1975) or breast tumor cell lines (MCF7 and T47D) not chemically preserved. The number of cells with successful mutation detection over the number of efficiently lysed cells is mentioned. (B) The UltraSEEK® Lung Panel was tested on the 2 EGFR mutations with our modified protocol on individual cells from lung tumor cell lines processed with Parsortix® enrichment method. The number of cells with successful mutation detection over the number of efficiently lysed cells is mentioned. (C) Normalized intensity and signal-to-noise ratio (SNR) values obtained for each PCR assay for gDNA tested at 6.6 pg input in duplicate, not chemically preserved single cells and ‘Parsortix’ processed single cells. Source data are available online for this figure.
Figure EV4
Figure EV4. Normalized intensity and SNR values for the mutations detected among CTC processed with the CellSearch® enrichment method.
For each assay, the horizontal line represents the threshold value of SNR (set to 10 according to manufacturer’s recommendation) and of the normalized intensity calculated on leukocytes. (A) Normalized intensity and SNR values for the mutations detected among CTC from patient MEL 21. (B) Normalized intensity and SNR values for the mutations detected among CTCs from patient MEL 31. (C) Normalized intensity and SNR values for the PI3KCA E545K mutation detected among breast tumor cell lines and CTC from breast cancer patient. Source data are available online for this figure.
Figure EV5
Figure EV5. Comparison of turnaround times of UltraSEEK®-adapted protocol and “standard” protocol to analyze hotspots mutations from single CTCs.
*Duration of the protocol for WGA is dependent on WGA technologies. We included cell lysis that is also necessary into WGA protocol global time. We chose to compare the UltraSEEK®-adapted protocol to WGA and next-generation sequencing (NGS) as it appears for us that NGS was the most adequate technology to analyze in parallel multiple hotspot mutations. Created using BioRender.com.

References

    1. Abbosh C, Birkbak NJ, Wilson GA, Jamal-Hanjani M, Constantin T, Salari R, Le Quesne J, Moore DA, Veeriah S, Rosenthal R, et al. Phylogenetic ctDNA analysis depicts early-stage lung cancer evolution. Nature. 2017;545:446–451. doi: 10.1038/nature22364. - DOI - PMC - PubMed
    1. Abbosh C, Frankell AM, Harrison T, Kisistok J, Garnett A, Johnson L, Veeriah S, Moreau M, Chesh A, Chaunzwa TL, et al. Tracking early lung cancer metastatic dissemination in TRACERx using ctDNA. Nature. 2023;616:553–562. doi: 10.1038/s41586-023-05776-4. - DOI - PMC - PubMed
    1. Alix-Panabières C, Pantel K. Liquid biopsy: from discovery to clinical application. Cancer Discov. 2021;11:858–873. doi: 10.1158/2159-8290.CD-20-1311. - DOI - PubMed
    1. Asante D-B, Mohan GRKA, Acheampong E, Ziman M, Calapre L, Meniawy TM, Gray ES, Beasley AB. Genetic analysis of heterogeneous subsets of circulating tumour cells from high grade serous ovarian carcinoma patients. Sci Rep. 2023;13:2552. doi: 10.1038/s41598-023-29416-z. - DOI - PMC - PubMed
    1. Babayan A, Alawi M, Gormley M, Müller V, Wikman H, McMullin RP, Smirnov DA, Li W, Geffken M, Pantel K, et al. Comparative study of whole genome amplification and next generation sequencing performance of single cancer cells. Oncotarget. 2016;8:56066–56080. doi: 10.18632/oncotarget.10701. - DOI - PMC - PubMed

Substances

LinkOut - more resources