. 2024 Aug;4(8):1137-1152.
doi: 10.1038/s43587-024-00646-8. Epub 2024 Jun 19.

Principal component-based clinical aging clocks identify signatures of healthy aging and targets for clinical intervention

Affiliations

Principal component-based clinical aging clocks identify signatures of healthy aging and targets for clinical intervention

Sheng Fong et al. Nat Aging. 2024 Aug.

Abstract

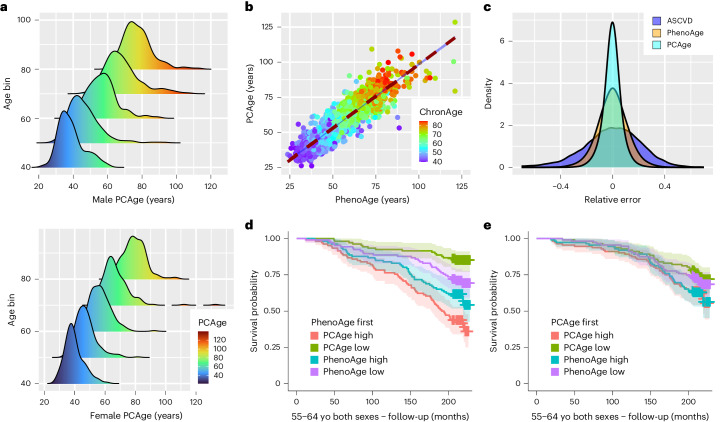
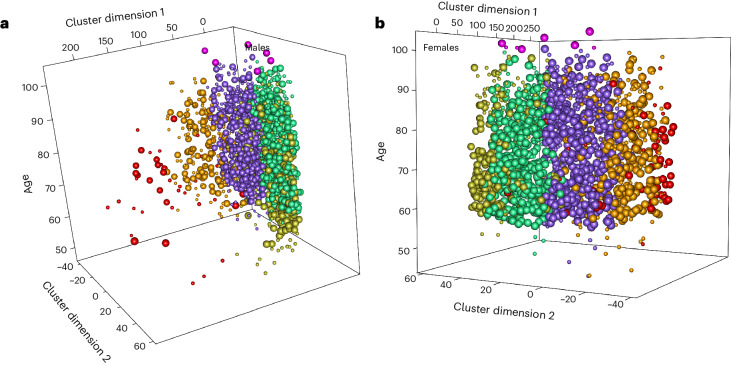
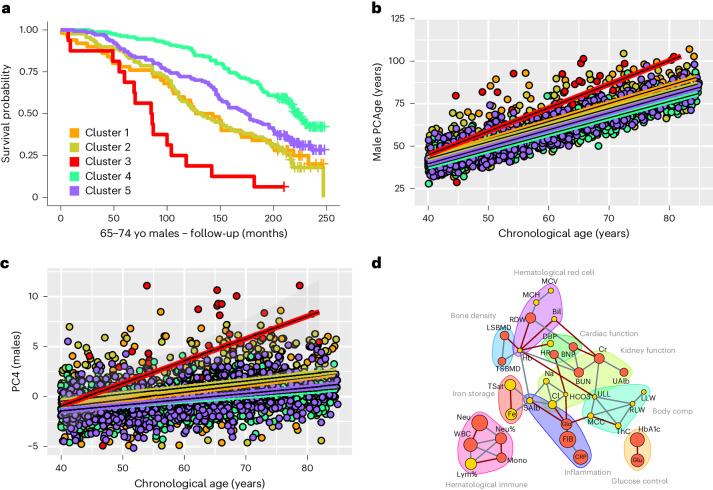
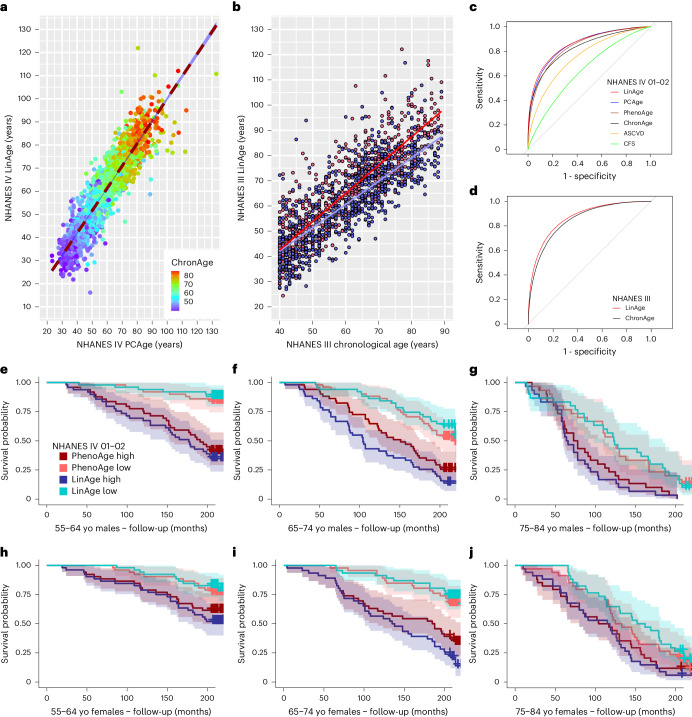
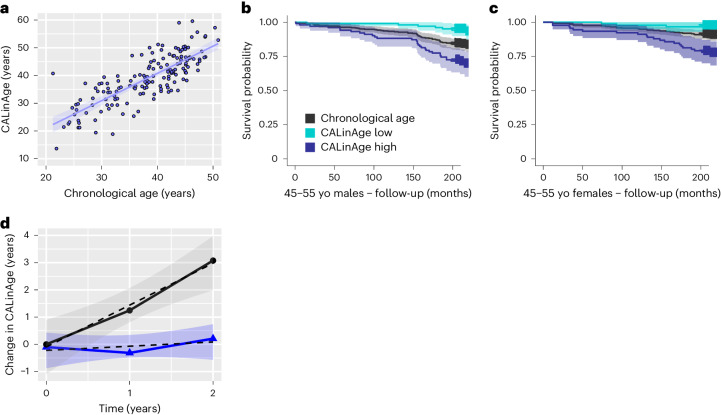
Clocks that measure biological age should predict all-cause mortality and give rise to actionable insights to promote healthy aging. Here we applied dimensionality reduction by principal component analysis to clinical data to generate a clinical aging clock (PCAge) identifying signatures (principal components) separating healthy and unhealthy aging trajectories. We found signatures of metabolic dysregulation, cardiac and renal dysfunction and inflammation that predict unsuccessful aging, and we demonstrate that these processes can be impacted using well-established drug interventions. Furthermore, we generated a streamlined aging clock (LinAge), based directly on PCAge, which maintains equivalent predictive power but relies on substantially fewer features. Finally, we demonstrate that our approach can be tailored to individual datasets, by re-training a custom clinical clock (CALinAge), for use in the Comprehensive Assessment of Long-term Effects of Reducing Intake of Energy (CALERIE) study of caloric restriction. Our analysis of CALERIE participants suggests that 2 years of mild caloric restriction significantly reduces biological age. Altogether, we demonstrate that this dimensionality reduction approach, through integrating different biological markers, can provide targets for preventative medicine and the promotion of healthy aging.


Conflict of interest statement

The authors declare no competing interests.

Figures

Fig. 1
Fig. 1. PCAge predicts BA in males and females.
a, Scatter plot and linear regression of CA versus PCAge for males (blue) and females (red). PCAge is strongly correlated with CA for males (PCC = 0.88, R2 = 0.77, P < 0.001) and females (PCC = 0.90, R2 = 0.81, P < 0.001). b,d,f, Kaplan–Meier survival curves showing 20-year survival for males in different CA bins. Biologically younger males (best 25% quartile for BA, PCAge Low, cyan) and biologically older males (worst 25% quartile for BA, PCAge High, blue) are compared to males with BA similar to their CA (mean CA, black), males in the best 25% quartile for ASCVD risk score (CVD risk Low, orange) and males in the worst 25% quartile for ASCVD risk score per CA category (CVD risk High, red). Across all age categories, biologically younger males (PCAge Low, cyan) experienced significantly lower mortality compared to controls (P = 0.02 for 55–64, P < 0.001 for 65–74 and P = 0.03 for 75–84), whereas biologically older males (PCAge High, blue) experienced significantly higher mortality (P < 0.001 for 55–64 and 65–74 and P = 0.03 for 75–84). There were no statistically significant differences in the risk of dying between individuals with high ASCVD score and high PCAge. However, PCAge also captured subjects who were aging well, beyond just having low CVD risk. c,e,g, Kaplan–Meier survival curves over 20-year follow-up for females similar to b, d and f. When compared to mean CA (black), significant survival differences were observed in females (P = 0.05 for PCAge High (blue) in 55–64, P = 0.03 for PCAge Low (cyan) in 65–74, P = 0.003 for PCAge High (blue) in 65–74, P = 0.01 for PCAge Low (cyan) in 75–84 and P < 0.001 for PCAge High (blue) in 75–84), although this did not reach statistical significance for PCAge Low (cyan) in 55–64 (P = 0.06). In females, PCAge clearly outperforms the ASCVD score in predicting survival, specifically in those with CA 65–74 (P = 0.002 for PCAge High (blue) versus CVD risk High (red), although P = 0.09 for PCAge Low (cyan) versus CVD risk Low (orange)). Survival analyses were performed using log-rank tests. Areas shaded in color in bg indicate 95% error bands for lines of the same color. yo, years old.
Fig. 2
Fig. 2. Testing PCAge for robustness and precision.
a, Ridgeline plots of male and female populations binned by decade for CA. For each CA bin, PCAge for male and female populations possessed a long tail toward the right and contained distinct subpopulations of subjects who were significantly biologically older, especially in the 65–74-year and 75–84-year age bins. Subjects with positive PCAge Deltas of at least 20 years were significantly more likely to suffer from age-dependent diseases (median comorbidity index = 0.18, interquartile range (IQR) = 0.14–0.31 years, n = 41 males and 13 females versus the mean and s.d. of the median comorbidity index for age and sex-matched subjects within the normal distribution, which was 0.09 ± 0.02, n = 10,000 by bootstrapping, P < 0.001) and died significantly faster (median survival = 4.7 more years, IQR = 2.1–13.5 years, n = 41 males and 13 females versus the mean and s.d. of the median survival for age and sex-matched subjects who survived for 17.9 ± 0.4 more years, n = 10,000 by bootstrapping, P < 0.001). b, Scatter plot and linear regression of PhenoAge versus PCAge for males and females. The color gradient (ChronAge) reflects the CA of each subject. c, Impact of random errors in clinical parameters on BA clocks and disease score. For each clinical parameter, random errors were sampled from a Gaussian distribution with mean or 0% and s.d. 10%. The distribution for relative errors in the ASCVD score, PCAge and PhenoAge are compared. PCAge, using linear projections (PCAs) of many variables, is less impacted than models using only a small number of features. d, Kaplan–Meier survival curves over 20-year follow-up for subjects with PhenoAges of 55–64 years, stratified by PCAge or PhenoAge. PCAge High are subjects in the worst 25% quartile for PCAge; PCAge Low are subjects in the best 25% quartile for PCAge; PhenoAge High refers to subjects in the worst 25% quartile for PhenoAge; and PhenoAge Low refers to subjects in the best 25% quartile for PhenoAge. e, Equivalent to d but showing Kaplan–Meier survival curves for subjects with PCAges of 55–64 years. Survival analyses were performed using log-rank tests. Areas shaded in color in d and e indicate 95% error bands for lines of the same color. yo, years old.
Fig. 3
Fig. 3. Cluster analysis.
a, 3D plot of the five male clusters: ‘healthy aging’ (green), ‘mild cardio-metabolic’ (purple), ‘major cardio-metabolic’ (orange), ‘cardio-metabolic failure’ (red) and ‘multi-morbid’ (yellow). Centenarians are color-coded in pink. b, 3D plot of the five female clusters represented by the same colors as males in a. For both plots, the z axis shows CA at the end of the 20-year follow-up period (large spheres) or at death (small spheres). Subjects from the ‘healthy aging’ clusters had the lowest median PCAge and the smallest (most negative) PCAge Delta (P < 0.001). By contrast, subjects from the ‘cardio-metabolic failure’ clusters had the highest median PCAge and PCAge Delta (P < 0.001) (Supplementary Table 5). Across all clusters, there were six male and eight female centenarians. When we compared the centenarians to individuals of the same initial CA but who did not attain centenarian status, we found that centenarians had significantly lower mean PCAge Delta (−3.4 ± 4.7 years, n = 14 versus +1.0 ± 6.3 years, n = 259, P = 0.0056 by unpaired two-sided t-test), indicating that centenarians already had significantly lower BA at the time of the initial survey (that is, 15–20 years before turning 100).
Fig. 4
Fig. 4. PCs to extract mechanisms of aging and age-related disease(s).
a, Kaplan–Meier survival curves comparing cluster-specific survival for 65–74-year CA males. Males from the ‘healthy aging’ cluster (Cluster 4, green) had the lowest mortality, whereas males from the ‘cardio-metabolic failure’ cluster (Cluster 3, red) had the highest mortality. Males from the ‘multi-morbid’ clusters (Cluster 2, yellow), although significantly different from subjects of the ‘cardio-metabolic’ clusters (Cluster 5, purple, and Cluster 1, orange), experienced similar mortality to males from the ‘major cardio-metabolic’ cluster (Cluster 1, orange). Log-rank tests were statistically significant for all individual comparisons (P < 0.001), except between the ‘major cardio-metabolic’ and ‘multi-morbid’ clusters (P = 0.8) and between the ‘major cardio-metabolic’ and ‘mild cardio-metabolic’ (Cluster 5, purple) clusters (P = 0.1). b, Scatter plot and linear regression of CA versus PCAge for each male cluster. Cluster-specific aging rate is the slope of the linear fit between CA and PCAge. It is not the biological aging rate of individual subjects but characterizes the relationship between BA and CA across clusters. Males in the ‘healthy aging’ cluster (green) had the slowest cluster-specific aging rate, on average 1.03 years per calendar year (slope = 1.03, R2 = 0.87, P < 0.001). Males from the cardio-metabolic axis had increasing cluster-specific aging rates (slope = 1.07, R2 = 0.84, P < 0.001 for ‘mild cardio-metabolic’ (purple) and slope = 1.14, R2 = 0.70, P < 0.001 for ‘major cardio-metabolic’ (orange)), with the highest rate in the ‘cardiometabolic failure’ (red) (slope = 1.47, R2 = 0.61, P < 0.001) cluster. Males from the ‘multi-morbid’ cluster (yellow) had intermediate rate (slope = 1.06, R2 = 0.73, P < 0.001). c, Scatter plot and linear regression of CA versus PC4 for each male cluster. Although dispersion was high, PC4 increased with age in all clusters, including the ‘healthy aging’ (green) (slope = 0.047, R2 = 0.154, P < 0.001), ‘mild cardio-metabolic’ (purple) (slope = 0.058, R2 = 0.145, P < 0.001), ‘major cardio-metabolic’ (orange) (slope = 0.02, R2 = 0.023, P < 0.001), ‘multi-morbid’ (yellow) (slope = 0.068, R2 = 0.13, P < 0.001) and ‘cardio-metabolic failure’ (red) (slope = 0.24, R2 = 0.333, P < 0.001) clusters. d, Partial correlation network of clinical parameters within the top 10% by magnitude of weights in PC4. The circle size for each parameter is proportional to its weight within PC4. Parameters in red had a positive weight and increased with CA, whereas parameters in yellow had a negative weight and decreased with CA. yo, years old. MCV, mean cell volume; MCH, mean cell hemoglobin; RDW, red cell distribution width; Hb, hemoglobin; Bil, bilirubin; LSBMD, lumbar spine bone mineral density; TSBMD, thoracic spine bone mineral density; DBP, diastolic blood pressure; HR, heart rate; BNP, n-terminal pro-brain natriuretic peptide; Cr, creatinine; BUN, blood urea nitrogen; UAlb, urine albumin; Na, sodium; Cl, chloride; HCO3, bicarbonate; ULL, upper leg length; MCC, maximal calf circumference; ThC, thigh circumference; RLW, right leg weight; LLW, left leg weight; HbA1c, glycohemoglobin; Glu, glucose; SAlb, serum albumin; Glo, globulin; Fib, fibrinogen; CRP, c-reactive protein; TSat, transferrin saturation; Fe, iron; WBC, white blood cell count; Neu, neutrophil count; Neu%, neutrophil percent; Mono, monocyte count; Lym%, lymphocyte percent.
Fig. 5
Fig. 5. ACE-I/ARBs normalize modifiable clinical parameters, involved in renal function, cardiac function and inflammation, within PC4 space to reduce mortality risk and BA.
a, Comparison of PC4 networks of subjects with high urine ACR and not on treatment, superimposed on reference healthy subjects with normal urine ACR and without hypertension, hyperlipidemia or diabetes mellitus. b, Comparison of PC4 networks of ACE-I/ARB-treated subjects superimposed on reference healthy subjects. Parameters in red had a positive weight in PC4, increasing with CA, whereas parameters in yellow had a negative weight and decreased with CA. During the comparison, parameters that became worse were scaled by the log2 fold change relative to healthy subjects. Urine albumin (UAlb) is colored orange because it was used as the original selection criterion. Refer to Fig. 4 for a list of abbreviations. c, Notched box plots of PC4 weights for healthy subjects (blue), untreated subjects with high urine ACR (red) and ACE-I/ARB-treated subjects (green) (n = 140 per group). Notch of box blots indicates median value. Lower and upper hinges correspond to 25th and 75th percentiles, respectively. Whiskers extend to ±1.5 multiplied by interquartile range, with points outside this range drawn individually. Multiple group comparisons were performed using the Kruskal–Wallis test. Post hoc analyses were performed using Dunn’s test. d, Notched box plots of PCAge Delta for the same groups (n = 140 per group), constructed and analyzed as in c. e, Kaplan–Meier survival curves for the same groups in c. Survival analyses were performed using log-rank tests. Areas shaded in color indicate 95% error bands for respective lines. Rx, treatment.
Fig. 6
Fig. 6. LinAge recapitulates PCAge in BA prediction.
a, Scatter plot and linear regression of LinAge versus PCAge for both sexes in the NHANES IV test cohort. The color gradient (ChronAge) reflects CA. LinAge is strongly correlated with PCAge (PCC = 0.92, R2 = 0.84, P < 0.001, n = 2,036). PCAge Deltas were correlated with LinAge Deltas (PCC = 0.68). b, Scatter plot and linear regression of CA versus LinAge for males (blue) and females (red) in the NHANES III external validation cohort. LinAge is highly correlated with CA for males (blue symbols, PCC = 0.79, R2 = 0.62, P < 0.001, n = 715) and females (red symbols, PCC = 0.87, R2 = 0.76, P < 0.001, n = 819). c, ROC curves for 20-year all-cause mortality for LinAge, PCAge, PhenoAge, ChronAge, ASCVD and CFS scores in the test cohort. There was no significant difference in AUCs between PCAge (AUC = 0.8643) and LinAge (AUC = 0.8655). PCAge was significantly more informative than the ASCVD score (AUC = 0.7594, P < 0.001) in predicting future mortality. Compared to LinAge, ChronAge (AUC = 0.8289, P < 0.001), the CFS score (AUC = 0.6585, P < 0.001) and PhenoAge (AUC = 0.8474, P < 0.001) were significantly less predictive of 20-year survival. d, Similarly, in the NHANES III cohort, LinAge (AUC = 0.8741) predicted future all-cause mortality at 25-year follow-up significantly better than ChronAge (AUC = 0.8590, P = 0.03). ROC curves were compared using DeLong’s test. ej, Kaplan–Meier survival curves of male or female subjects from the test cohort over 20-year follow-up. Subjects from each CA bin were stratified, selecting the highest (worst) and lowest (best) 25% difference between their CA and either LinAge or PhenoAge. In each age bin, subjects in the lowest (best) quartile of LinAge Delta (LinAge Low) were compared with the equivalent group of PhenoAge Delta (PhenoAge Low). Similarly, subjects in the highest (worst) quartile of LinAge Delta (LinAge High) were compared with the equivalent group of PhenoAge Delta (PhenoAge High). Across all age and sex categories, LinAge and PhenoAge captured subjects who aged unusually well (LinAge/PhenoAge Low) or badly (LinAge/PhenoAge High). Although the separation between survival curves for the best 25% and worst 25% quartiles of LinAge was wider than for PhenoAge in most age bins, the two clocks performed similarly in others. Areas shaded in color in ej indicate 95% error bands for lines of the same color. yo, years old.
Fig. 7
Fig. 7. Caloric-restricted subjects have significantly lower aging rates.
A custom PC-based clock was created to measure BA of CALERIE trial subjects. This clock was built exclusively on features found in data from both the NHANES IV 1999–2002 cohorts and the CALERIE trial. The CALinAge clock was trained in the NHANES IV 1999–2000 cohort, tested in the NHANES IV 2001–2002 cohort and then applied to CALERIE trial subjects. Comparison of CALinAge residuals with LinAge residuals in the NHANES IV 2001–2002 testing cohort confirmed a high degree of correlation between these two clocks (PCC = 0.70, n = 3,391). a, Scatter plot and linear regression of CA versus CALinAge for both sexes before the start of the CALERIE trial. CALinAge is highly correlated with CA (PCC = 0.80, R2 = 0.64, P < 0.001, n = 159). b,c, KaplanMeier survival curves showing actual survival in the NHANES IV 2001–2002 test cohort over the 20-year follow-up period for both sexes in the 45–55-year CA category. Compared to subjects with BA similar to their CA, subjects in the best 25% quartiles for BA (CALinAge Low) experienced significantly lower mortality over the 20-year follow-up (P = 0.01 for males and P = 0.05 for females), whereas subjects in the worst 25% quartiles for BA (CALinAge high) experienced significantly higher mortality (P = 0.003 for males and P = 0.001 for females). Survival analyses were performed using log-rank tests. Areas shaded in color in b and c indicate 95% error bands for lines of the same color. d, Change in CALinAge BA from baseline (0 years) to 1-year and 2-year follow-ups in the AL (black) and CR (blue) groups of the CALERIE trial. The points represent the mean values of change between the timepoint and baseline for each group. The shaded areas show the 95% confidence interval for the overall linear fit of the change in CALinAge as a function of treatment time for each group. Areas shaded in gray indicate 95% error bands for best linear fit for each condition. yo, years old.
Extended Data Fig. 1
Extended Data Fig. 1. PCAge also predicts BA in chronologically 45–54 year old males and females.
Kaplan-Meier survival curves over a 20-year follow up period for 45–54 year old males and females for mean CA (Chronological Age, black), biologically younger males/females in the best 25% quartile for BA per CA category (PCAge Low, cyan), biologically older males/females in the worst 25% quartile for BA per CA category (PCAge High, blue), biologically younger males/females in the best 25% quartile for ASCVD score per CA category (CVD risk Low, orange), and biologically older males/females in the worst 25% quartile for ASCVD score per CA category (CVD risk High, red). a, Compared to mean CA (black), male subjects in the best 25% quartile, with younger PCAges relative to their CAs (PCAge Low, cyan), had a shallower decline in survival (P = 0.002), whereas male subjects in the worst 25% quartile, with older PCAges relative to their CAs (PCAge High, blue), had a steeper decline in survival (P = 0.03). b, Compared to mean CA (black), female subjects in the worst 25% quartile, with older PCAges relative to their CAs (PCAge High, blue), had a steeper decline in survival (P = 0.001), although there was no statistically significant difference between mean CA (black) and female subjects in the best 25% quartile (PCAge Low, cyan) (P = 0.08). For both sexes, there were no statistically significant differences between the ASCVD score and PCAge in the ability to predict survival in the 45–54 age category. Survival analyses were performed using log-rank tests. Areas shaded in color in each panel indicate 95% error bands for lines of the same color.
Extended Data Fig. 2
Extended Data Fig. 2. Kaplan-Meier survival curves by PhenoAge and PCAge categories for male and females.
We compared PhenoAge’s and PCAge’s ability to stratify the test cohort by either first selecting individuals based on their PhenoAge before predicting survival based on their PCAge (a-c), or by first selecting based on PCAge before predicting survival based on PhenoAge (d-f). a-c, Across all PhenoAge categories, we found that PCAge could further predict survival within the PhenoAge selection, as evidenced by the statistically significantly wider degree of separation in the survival curves between the best 25% and worst 25% quartiles (P = 0.004 for PCAge Low (green) versus PCAge High (orange) and P = 0.1 for PhenoAge Low (purple) versus PhenoAge High (cyan) in the 45–54 PhenoAge category, P < 0.001 for PCAge Low (green) versus PCAge High (orange) and P < 0.001 for PhenoAge Low (purple) versus PhenoAge High (cyan) in the 65–74 PhenoAge category, P < 0.001 for PCAge Low (green) versus PCAge High (orange) and P = 0.05 for PhenoAge Low (purple) versus PhenoAge High (cyan) in the 75–84 PhenoAge category). d-f, However, when we evaluated the performance of PhenoAge in survival prediction in subjects selected according to their PCAge instead, we found significant differences only in the 65–74 (P < 0.001) and 75–84 (P = 0.004) PCAge categories. Our findings therefore suggest that PCAge in many cases could identify additional healthy aging and other at-risk individuals beyond that predicted by PhenoAge. Survival analyses were performed using log-rank tests. Areas shaded in color in a-f indicate 95% error bands for lines of the same color.
Extended Data Fig. 3
Extended Data Fig. 3. Kaplan-Meier survival curves by CA category for male and female clusters.
a, Survival curves for male clusters in the 55–64 CA category. Log-rank tests were statistically significant for all individual curve comparisons, except between the ‘major cardio-metabolic’ (orange) and ‘multi-morbid’ (yellow) clusters (P = 0.6), and between the ‘healthy aging’ (green) and ‘mild cardio-metabolic’ (purple) clusters (P = 0.5). b, Refer to Fig. 4a. c, Survival curves for male clusters in the 75–84 CA category. Log-rank tests were statistically significant for all individual curve comparisons, except between the ‘major cardio-metabolic’ (orange) and ‘multi-morbid’ (yellow) clusters (P = 0.7), ‘major cardio-metabolic’ (orange) and ‘mild cardio-metabolic’ (purple) clusters (P = 0.05), and between the ‘healthy aging’ (green) and ‘mild cardio-metabolic’ (purple) clusters (P = 0.6). d, Survival curves for female clusters in the 55–64 CA category. Log-rank tests were statistically significant only for individual curve comparisons between the ‘mild cardio-metabolic’ (purple) and ‘multi-morbid’ (yellow) clusters (P = 0.02), ‘mild cardio-metabolic’ (purple) and ‘cardio-metabolic failure’ (red) clusters (P = 0.001), ‘mild cardio-metabolic’ (purple) and ‘major cardio-metabolic’ (orange) clusters (P = 0.04), and between the ‘healthy aging’ (green) and ‘cardio-metabolic failure’ (red) clusters (P = 0.02). e, Survival curves for female clusters in the 65–74 CA category. Log-rank tests were statistically significant only for individual curve comparisons between the ‘healthy aging’ (green) and ‘multi-morbid’ (yellow) clusters (P = 0.01), mild cardio-metabolic’ (purple) and ‘cardio-metabolic failure’ (red) clusters (P = 0.03), and between the ‘healthy aging’ (green) and ‘cardio-metabolic failure’ (red) clusters (P = 0.01). f, Survival curves for female clusters in the 75–84 CA category. Log-rank tests were statistically significant only for individual curve comparisons between the ‘mild cardio-metabolic’ (purple) and ‘multi-morbid’ (yellow) clusters (P = 0.008), and between the ‘healthy aging’ (green) and ‘multi-morbid’ (yellow) clusters (P = 0.006). Subjects from the ‘healthy aging’ clusters experienced the shallowest declines in survival across all CA categories, except for 55–64 year old females.
Extended Data Fig. 4
Extended Data Fig. 4. Cluster-specific aging rates and PC4 rates for females.
a, Scatter plot and linear regression of CA versus PCAge for each of the five female clusters – ‘healthy aging’ (green), ‘mild cardio-metabolic’ (purple), ‘major cardio-metabolic’ (orange), ‘cardio-metabolic failure’ (red), and ‘multi-morbid’ (yellow). Females in the ‘healthy aging’ cluster (green) had the slowest cluster-specific aging rate, biologically aging on average 1.04 years per calendar year (slope=1.04, R2 = 0.86, P < 0.001 for females). Females from the cardio-metabolic axis had progressively faster cluster-specific aging rates (slope=1.04, R2 = 0.86, P < 0.001 for ‘mild cardio-metabolic’ (purple), and slope=1.12, R2 = 0.80, P < 0.001 for ‘major cardio-metabolic’ (orange)), with the highest cluster-specific aging rate seen in the ‘cardiometabolic failure’ (red) females (slope=1.31, R2 = 0.66, P < 0.001). Females from the ‘multi-morbid’ cluster (yellow) had intermediate cluster-specific aging rates (slope=1.10, R2 = 0.82, P < 0.001). b, Scatter plot and linear regression of CA versus PC4 for each of the five female clusters. Although dispersion was high, PC4 increased with age for the ‘healthy aging’ (green) (slope=0.012, R2 = 0.007, P = 0.038), ‘mild cardio-metabolic’ (purple) (slope=0.02, R2 = 0.023, P < 0.001), ‘major cardio-metabolic’ (orange) (slope=0.023, R2 = 0.013, P = 0.02), and ‘multi-morbid’ (yellow) (slope=0.04, R2 = 0.058, P < 0.001) clusters. There was no statistically significant increase with age in the already high PC4 values in the ‘cardio-metabolic failure’ (red) (slope=0.04, R2 = 0.058, P = 0.19) cluster.
Extended Data Fig. 5
Extended Data Fig. 5. LinAge and PhenoAge in chronologically 45–54 year old males and females.
a-b, Kaplan-Meier survival curves showing actual survival in the NHANES 2001–2002 test cohort over a 20-year follow up period for both sexes comparing biologically younger subjects in the bottom 25% quartile for LinAge Delta (LinAge Low, cyan) and PhenoAge Delta (PhenoAge Low, orange) with biologically older subjects in the upper 25% quartile for LinAge Delta (LinAge High, blue) and PhenoAge Delta (PhenoAge High, red) in the 45–54 CA category. Mortality is overall low in this CA bin and both clocks perform similarly with no statistically significant differences between LinAge Low (cyan) and PhenoAge Low (orange), as well as between LinAge High (blue) and PhenoAge High (red), in either sex. Areas shaded in color in each panel indicate 95% error bands for lines of the same color.

Similar articles

Cited by

References

    1. Kennedy, B. K. et al. Geroscience: linking aging to chronic disease. Cell159, 709–713 (2014). 10.1016/j.cell.2014.10.039 - DOI - PMC - PubMed
    1. Ingram, D. K. Toward the behavioral assessment of biological aging in the laboratory mouse: concepts, terminology, and objectives. Exp. Aging Res.9, 225–238 (1983). 10.1080/03610738308258457 - DOI - PubMed
    1. Comfort, A. Test-battery to measure ageing-rate in man. Lancet2, 1411–1414 (1969). 10.1016/S0140-6736(69)90950-7 - DOI - PubMed
    1. Ferrucci, L. et al. Measuring biological aging in humans: a quest. Aging Cell19, e13080 (2020). 10.1111/acel.13080 - DOI - PMC - PubMed
    1. Nakamura, E., Miyao, K. & Ozeki, T. Assessment of biological age by principal component analysis. Mech. Ageing Dev.46, 1–18 (1988). 10.1016/0047-6374(88)90109-1 - DOI - PubMed

LinkOut - more resources