. 2024 Jul;631(8019):118-124.
doi: 10.1038/s41586-024-07507-9. Epub 2024 Jun 19.

The mechanism for directional hearing in fish

Affiliations

The mechanism for directional hearing in fish

Johannes Veith et al. Nature. 2024 Jul.

Abstract

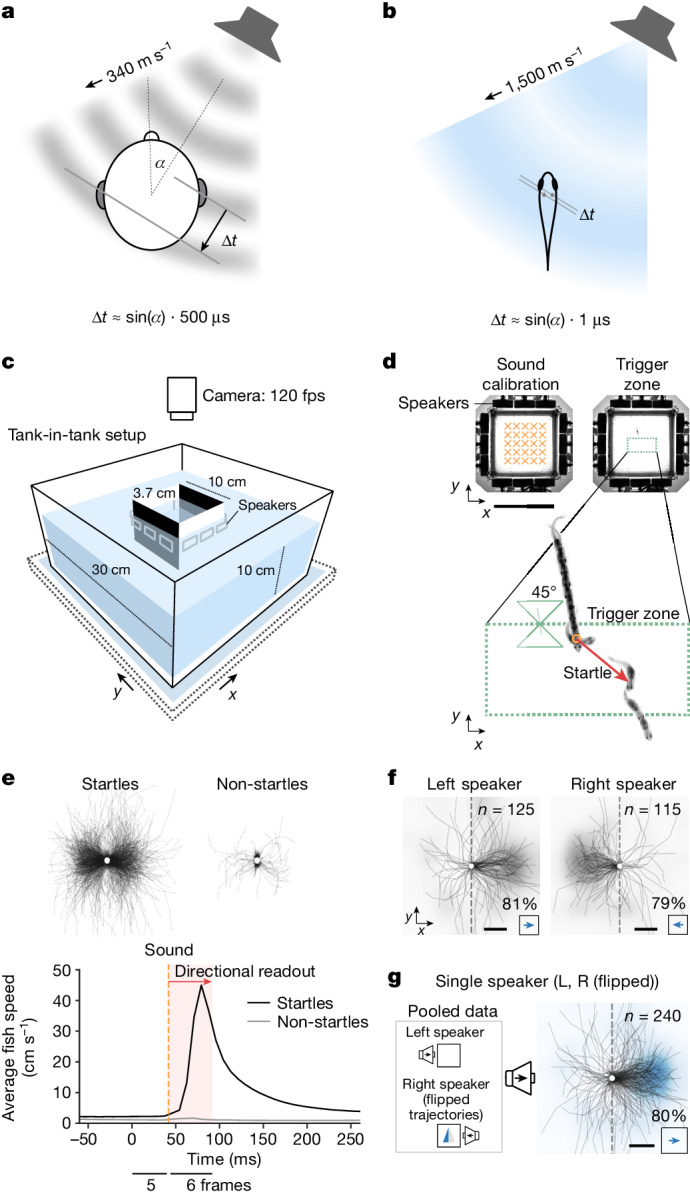
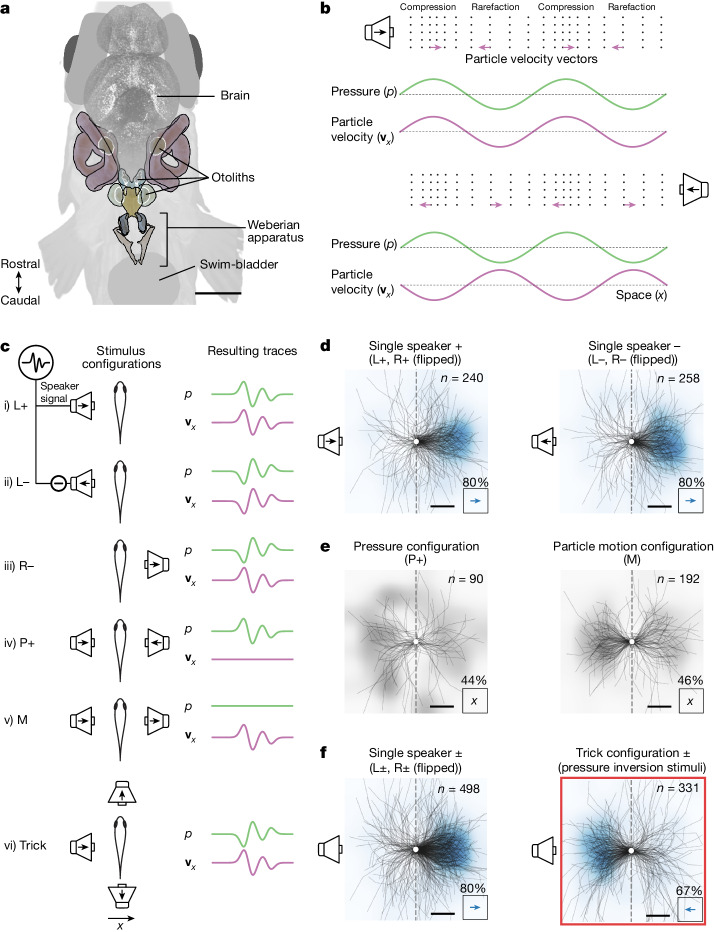
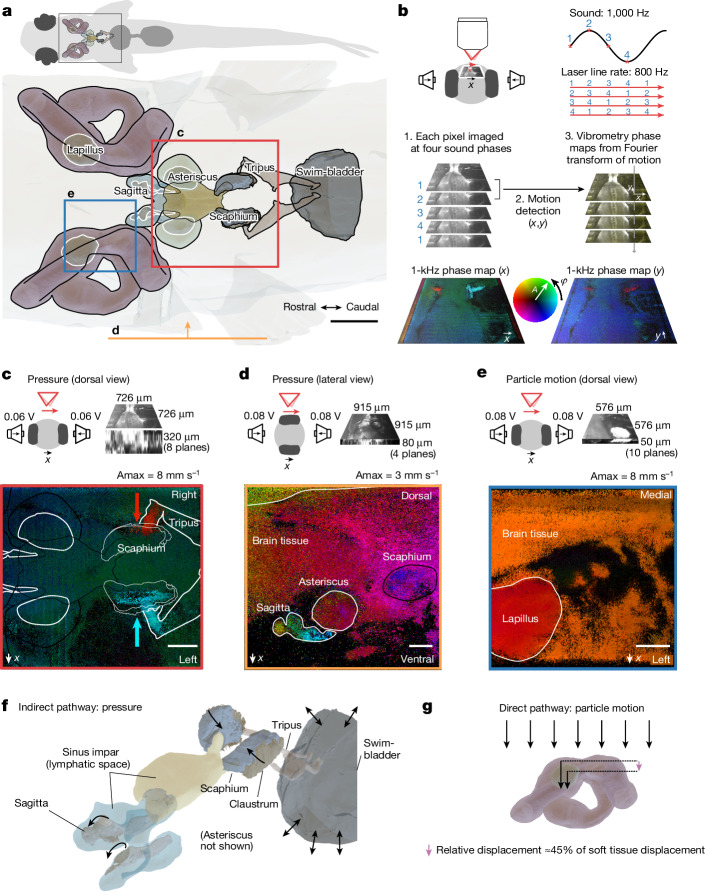
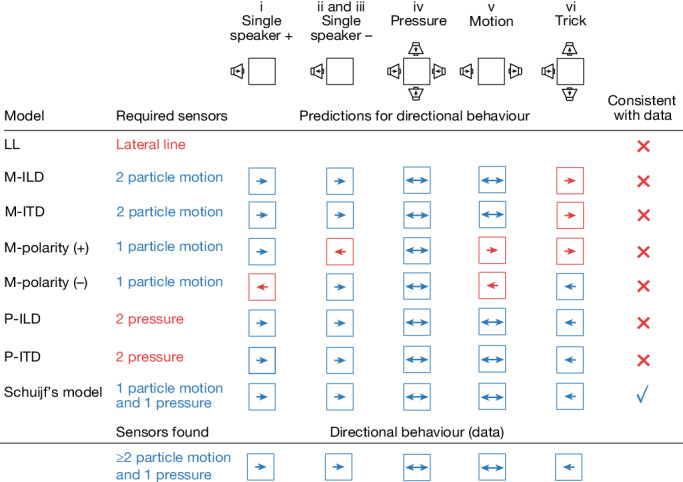
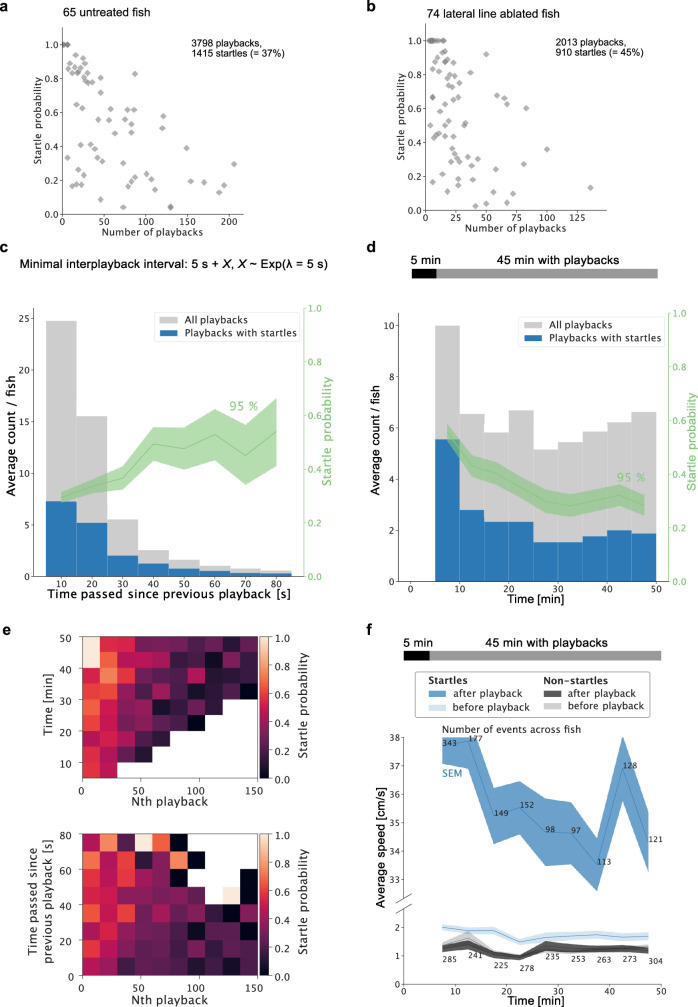
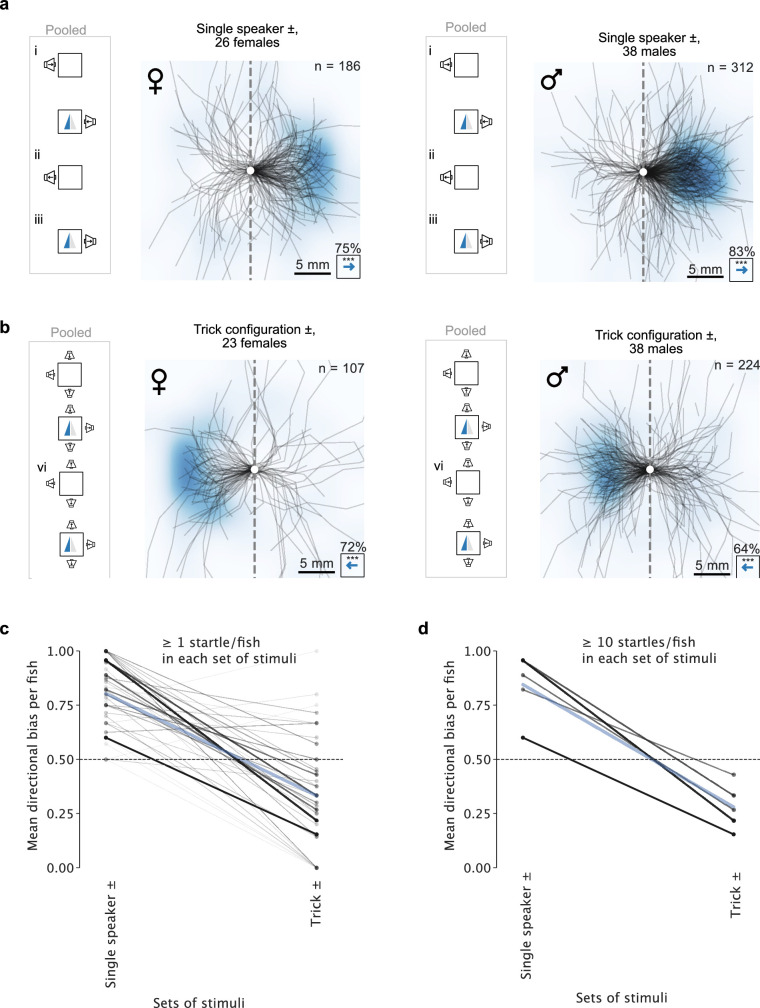
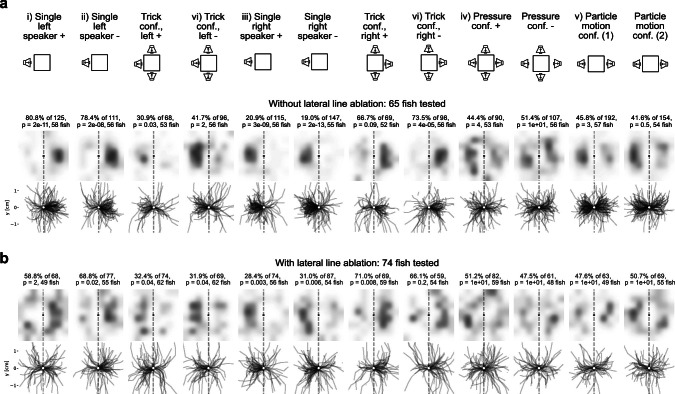
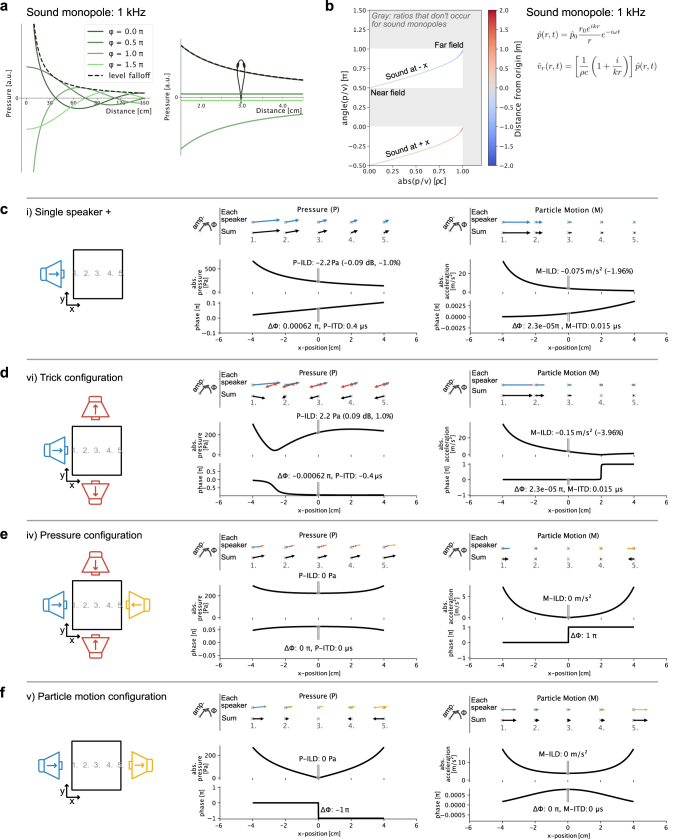
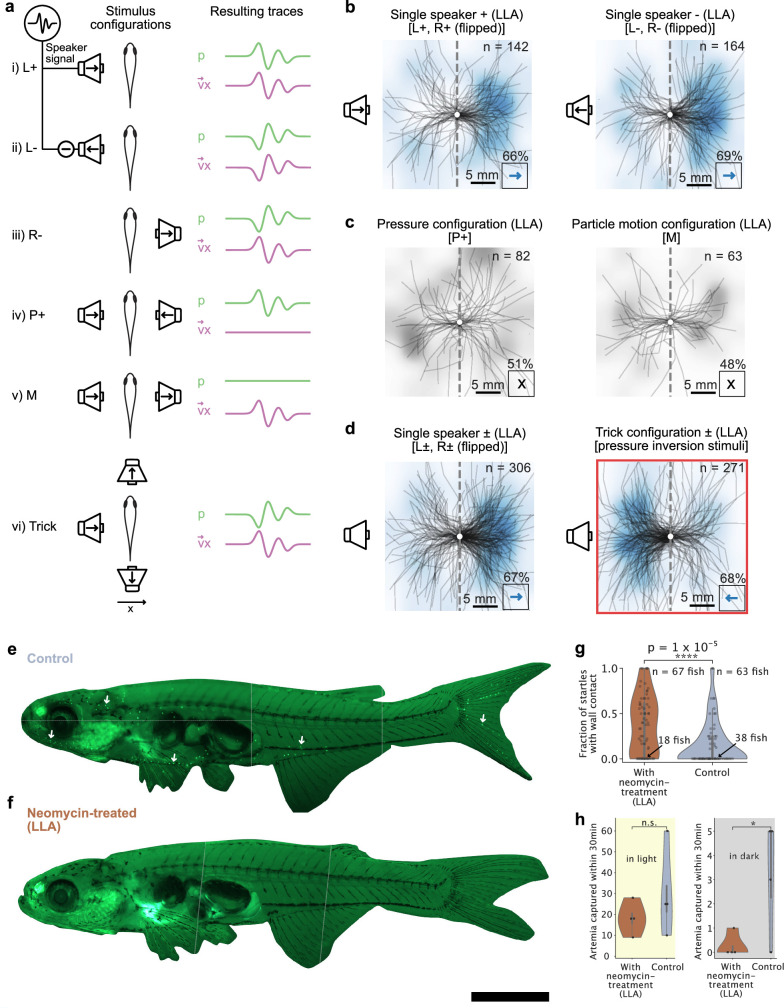
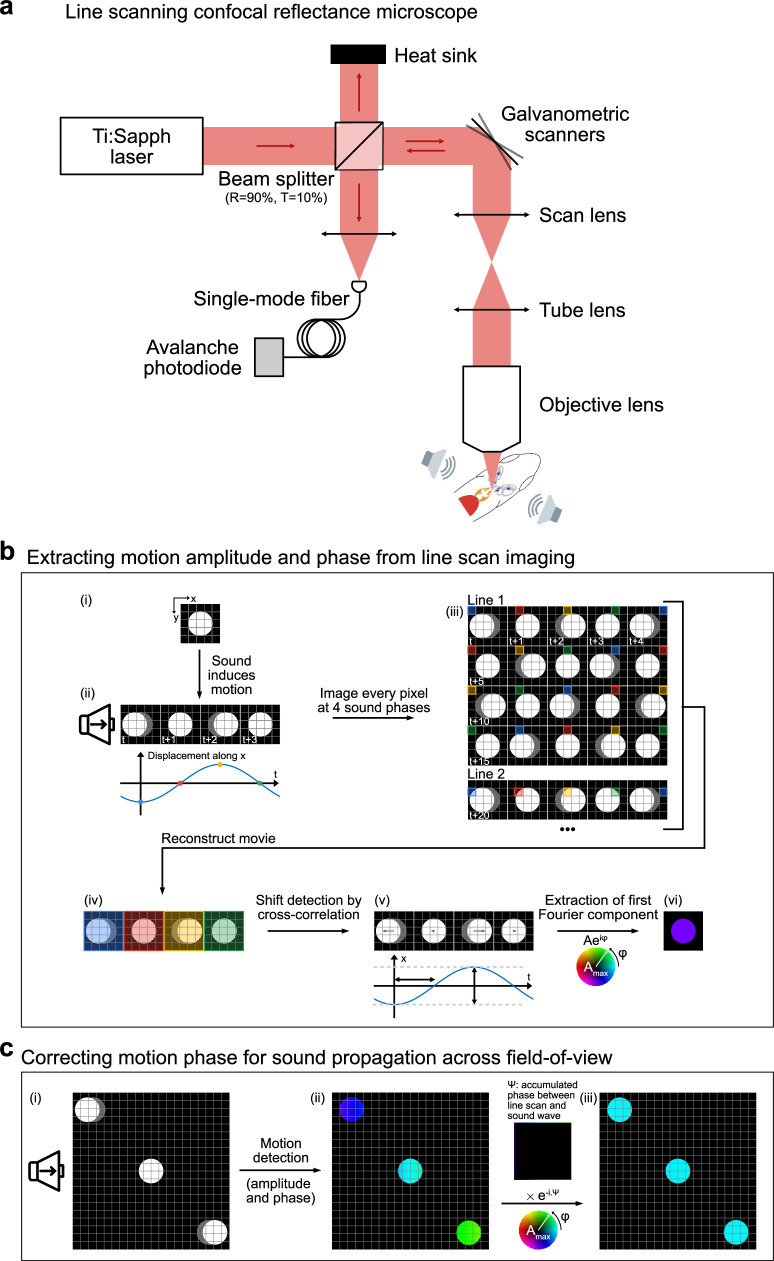
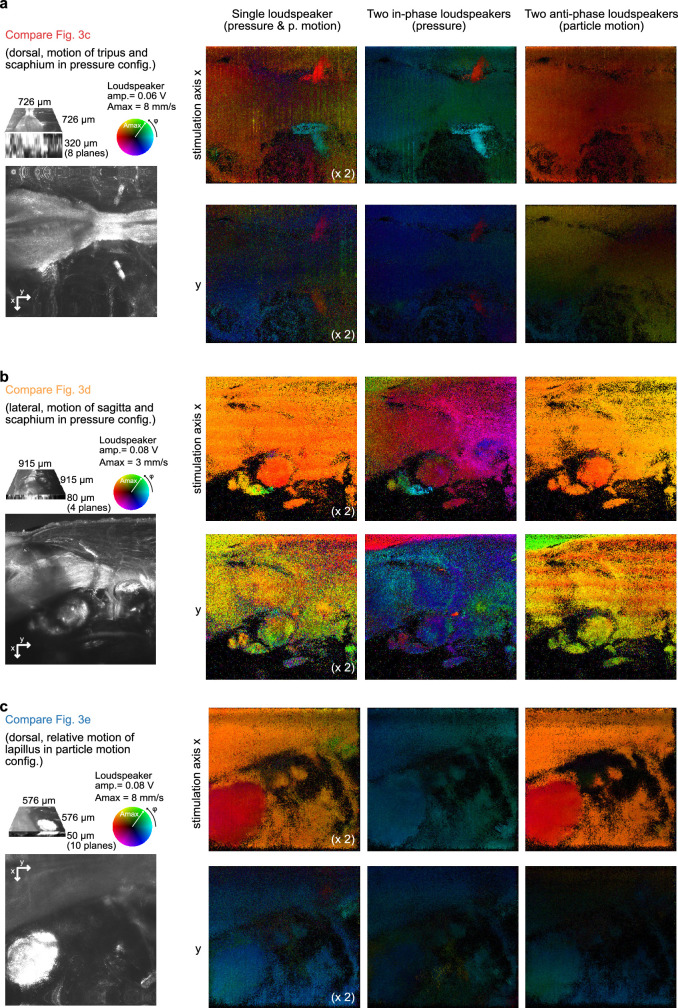
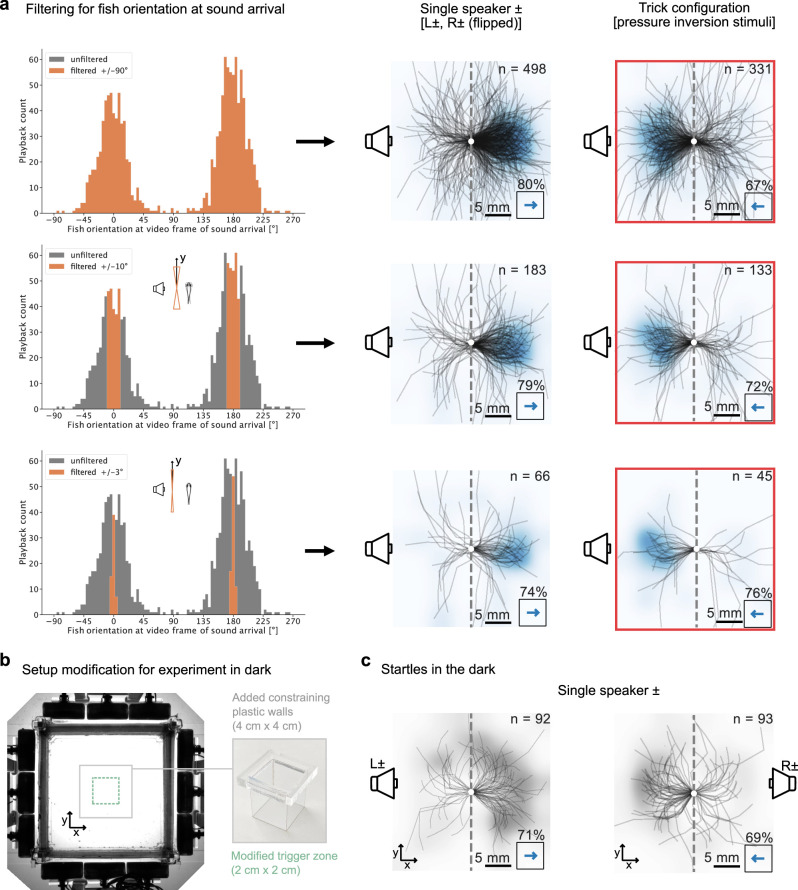
Locating sound sources such as prey or predators is critical for survival in many vertebrates. Terrestrial vertebrates locate sources by measuring the time delay and intensity difference of sound pressure at each ear1-5. Underwater, however, the physics of sound makes interaural cues very small, suggesting that directional hearing in fish should be nearly impossible6. Yet, directional hearing has been confirmed behaviourally, although the mechanisms have remained unknown for decades. Several hypotheses have been proposed to explain this remarkable ability, including the possibility that fish evolved an extreme sensitivity to minute interaural differences or that fish might compare sound pressure with particle motion signals7,8. However, experimental challenges have long hindered a definitive explanation. Here we empirically test these models in the transparent teleost Danionella cerebrum, one of the smallest vertebrates9,10. By selectively controlling pressure and particle motion, we dissect the sensory algorithm underlying directional acoustic startles. We find that both cues are indispensable for this behaviour and that their relative phase controls its direction. Using micro-computed tomography and optical vibrometry, we further show that D. cerebrum has the sensory structures to implement this mechanism. D. cerebrum shares these structures with more than 15% of living vertebrate species, suggesting a widespread mechanism for inferring sound direction.


Conflict of interest statement

The authors declare no competing interests.

Figures

Fig. 1
Fig. 1. Sounds elicit a directional startle reflex in Danionella cerebrum.
a, Schematic of a pressure wave, arriving at the auditory organs with a detectable ITD in humans. b, ITDs are heavily diminished underwater (value approximated for D. cerebrum). c, Behavioural setup (Methods). d, Playback paradigm. Before the experiment, sound pressure and particle acceleration are calibrated at multiple points inside the inner tank (top left, orange crosses; see also Extended Data Fig. 1c–e). Playback is triggered if three conditions are met: the fish swims into the trigger zone (top right, dotted green rectangle), the fish is oriented ≤45° to the y axis, and ≥5 s have passed since the last playback (Methods). e, Startles are detected by a speed threshold after sound playback (Methods; see Extended Data Fig. 4 for details on startle dynamics). Top: centred trajectories after playback for startles (n = 1,415) and non-startles (n = 2,383) across all fish (n = 65). Bottom: average fish speed for startles and non-startles, aligned to sound trigger at t = 0. f, Centred startle trajectories in two sound configurations show a directional escape away from the left (81% of n = 125 startle trials across 58 fish; two-sided binomial test: P = 2 × 10−12) or right (79% of n = 115 startle trials across 56 fish; two-sided binomial test: P = 2 × 10–10) speaker. g, Pooled centred trajectories from f with flipped trajectories for the right speaker stimulus summarize the directional escape away from the single speaker (80% of n = 240 startle trials across 63 fish; two-sided binomial test: P = 1 × 10−21). f,g, The heat maps are normalized and smoothed two-dimensional histograms over endpoint positions of the trajectories (grey for single-stimulus data; blue for pooled data). Scale bars, 10 cm (d) and 5 mm (f-g). Source data
Fig. 2
Fig. 2. The relative phase between pressure and particle motion predicts startle direction.
a, Schematic of D.cerebrum hearing apparatus anatomy. b, Schuijf’s model: a plane wave from the left differs from a plane wave from the right in terms of the phase relationship between pressure and directed particle velocity. c, Illustration of stimulus configurations. Plus, minus and arrows inside speaker symbols refer to speaker signal polarity. L, left speaker; R, right speaker; P, only pressure; M, only motion. The schematics of resulting traces illustrate the pressure and particle velocity relationship (see Extended Data Figs. 2 and 3 for actual traces). Speaker schematics show a simplified configuration. Active echo cancellation typically involved three speakers (Supplementary Table 2). df, Centred startle trajectories after sound playback. All statistical tests are two-sided binomial tests. d, Directional escapes away from a single speaker for a positive polarity signal (same data as Fig. 1g) and negative polarity signal (80% escapes, P = 7 × 10−23, n = 258 startle trials to this sound in 61 fish). e, Absence of significant directional bias in the positive polarity condition with only pressure (44% of n = 90 to right, not significant; P > 0.05) and only particle motion (46% of n = 192 to right, not significant; P > 0.05). f, Single-speaker playbacks pooled over both polarities evoke a directional escape (80% escapes, P = 4 × 10−43, n = 498 startle trials in 64 fish). Selective inversion of pressure polarity by an additional pair of speakers along the orthogonal axis inverts the relative polarity between pressure and particle velocity, which tricks the fish into performing startles approaching the active speaker (67% approach, P = 1 × 10−9, n = 331 startle trials in 61 fish). Scale bars, 500 µm (a) and 5 mm (df). Source data
Fig. 3
Fig. 3. The D.cerebrum hearing apparatus can detect pressure and particle motion separately.
a, Segmentation of the hearing apparatus based on micro-CT. The fields of view for vibrometry phase maps in ce are indicated. b, Illustration of the vibrometry method. A laser-scanning confocal reflectance microscope is used to image the motion of auditory structures in a sound field. Each pixel is sampled at four sound phases to record sound-induced motion in the xy plane. See Methods and Extended Data Fig. 10 for details. ce, Particle velocity phase (φ) and amplitude (A) maps for motion along the left–right speaker axis; phase colour wheel shown in b, normalized to the amplitude Amax indicated above the maps. c, A pressure stimulus causes anti-phase motion of the tips of the tripus and scaphium along the medial–lateral axis (indicated with red and cyan arrows). d, Along the dorso-ventral axis, a pressure stimulus creates phase-lagged motion of the scaphium and sagitta with the surrounding tissue. e, A particle motion stimulus results in relative motion between the lapillus and surrounding tissue along the medial–lateral axis. Pooling over pixels within the region of interest, the displacement amplitude of the surrounding tissue is 1.24 µm ± 0.14 µm, and that of the lapillus is 0.95 µm ± 0.05 µm. At a relative phase of 0.14 π ± 0.05 π, the relative displacement can be as large as 0.56 µm (that is, 45% of the surrounding tissue motion). f, Indirect pathway for pressure sensing: in a pressure field, the swim bladder oscillates, which moves the tripus and the scaphium inwards and outwards. Lymphatic spaces probably couple the motion of the scaphium to the sagitta,. g, Direct pathway for particle motion sensing: the tissue of the fish couples to the particle motion of water, but the denser lapillus lags in phase and moves with lower amplitude, leading to a relative displacement that could be sensed by utricular hair cells underneath the lapillus. Observations shown in ce were repeated once, four times and once in other fish, respectively, with similar results. Arrows in f,g indicate direction of motion. Scale bars, 250 µm (a) and 100 µm (ce).
Fig. 4
Fig. 4. Evidence for Schuijf’s model of phase comparison.
We consider seven models for directional hearing that depend on different sensory structures and predict different behaviours (an eighth lateral line (LL)-based mechanism can be ruled out as we observe directional behaviour despite lateral line ablation). Interaural time difference (M-ITD) and level difference (M-ILD) mechanisms based on particle motion can be rejected on the basis of the behavioural data in the trick configuration. A strategy that is based on escaping positive (M-polarity (+)) or negative (M-polarity (−)) initial motion can be rejected as inverted polarity waveforms fail to invert the startle direction. Finally, a mechanism based on sensing pressure level or time differences (P-ILD, P-ITD)—consistent with behavioural data—can be rejected as D.cerebrum possess only a single pressure sensor. This leaves Schuijf’s model as the one that correctly predicts an inversion of startle direction in the trick configuration and that is based on sensory cues that D.cerebrum is able to sense.
Extended Data Fig. 1
Extended Data Fig. 1. Setup design and sound calibration equipment.
a, Photo of the setup. b, Schematic of the setup indicating size and material. The room and water temperature is kept at 27 °C; the room light is indirect light reflecting from white walls. Infrared (IR) light illuminates the setup from below. c, Schematic of sound calibration points inside the inner tank overlaid over a heatmap of fish positions inside the inner tank across all 65 recordings. D. cerebrum avoids the black walls and oscillates between the two white walls. Pressure and particle acceleration were measured at 25 points (x) on a grid spanning a 6 cm x 6 cm square, covering the trigger zone (green dotted rectangle). Sounds were conditioned to deliver target waveforms to the fish’s swimming position within the trigger zone based on each speaker’s pressure and acceleration impulse responses for these 25 points. Points outside the trigger zone were measured to calculate pressure gradients across the edge of the trigger zone, see Methods. d, Left: Hydrophone, Aquarian Scientific, AS-1. Right: Triaxial acceleration sensor, ICP® - Model 356A45, PCB Piezotronics. e, The motorized arm moved the sensor to each grid position. Left: pressure measurement (was also used to compute acceleration indirectly). Right: direct acceleration measurement with the PCB sensor.
Extended Data Fig. 2
Extended Data Fig. 2. Sound targeting cancels reverb effects.
a, Schematic of sound calibration points (x) inside the inner tank. Green dotted rectangle: trigger zone. Orange dotted square: 9 measurements and target locations shown in c-d. b, Impulse response kernel for the left speaker at the center calibration point for three sound cues: pressure, x acceleration, and y acceleration. Pressure and x/y acceleration impulse responses were recorded for each speaker and each position on the grid, totaling to 3 x 4 x 25 = 300 waveforms capturing the acoustic properties of the tank. c, Naive playback paradigm (not used): The same waveform is played back via the left speaker, and sound cues are recorded at nine positions. Left: constant speaker signals. Right: Pressure and x/y acceleration measured at nine positions, spanning a 4.5 cm x 4.5 cm square at the center of the inner tank, vary considerably across this area, and the measured waveform does not resemble the playback waveform. d, Sound conditioning paradigm (used): Based on the impulse responses, different speaker signals are calculated for each target position. Left: speaker signals are different for each target position. Top and bottom speakers help to cancel y acceleration. Right: Pressure and x/y acceleration measured at the same nine positions. The waveforms resemble the defined target waveforms and are stable across positions.
Extended Data Fig. 3
Extended Data Fig. 3. Accuracy of six exemplary sound stimuli.
a, Schematic of sound calibration points (x) inside the inner tank, indicating the sound target position and recording position for speaker signals and recordings shown in b. b, Pressure and acceleration measurements for sound configurations i) - vi) (see Fig. 2c for schematic), targeted for the inner tank’s center calibration point and measured at the same position. Target waveforms (target) are defined as pressure, x accelerations, and y accelerations. Peak pressure: 223.87 Pa, peak x acceleration: 7.59 m/s2. The speaker signals (top panels in i-vi) are calculated based on impulse responses to deliver the target waveforms to the target position with the constraint that, e.g., the right speaker is inactive in the left speaker configurations (i & ii) and in the left speaker trick configurations (vi). For a given speaker signal, convolution with the respective impulse response kernels predicts (prediction) the measured waveforms.
Extended Data Fig. 4
Extended Data Fig. 4. Startle detection and dynamics.
a, Fish translational speed, shown for all n = 3798 playbacks across twelve stimulus configurations, and across 65 fish aligned to playback trigger at t = 0 ms (thin lines). The mean speed across playbacks is shown as a thick line. To trigger a playback, the fish had to swim into the trigger zone. This explains the small increase in mean speed prior to t = 0 ms (white arrow). b, We used a 25 ms time window (between vertical dashed lines) and classified trials as startle trials if the temporal average speed across this time window exceeded a threshold of 17 cm/s (horizontal line). The remaining ones were classified as non-startle trials. The threshold was set such that the average speed across non-startle trials increased slightly after playback (black arrow). This reflects a conservative choice for startle detection, classifying a few startles as non-startles rather than classifying non-startles as startles. c, Top: The average speeds computed across a 25 ms time window before each playback are below the selection threshold of 17 cm/s. Bottom: The average speed distribution within the 25 ms time window indicated in b, after playback, is bimodal. Hence, startles can be readily identified by a speed threshold. d, Body bend: The average absolute angle taken between six edges along the fish’s body axis after playback across startles increases sharply. It remains constant if averaged across non-startles. Startles are initiated by a strong body bend. e, Centered trajectories for all playbacks with startle reaction (n = 1415) across all 65 fish after aligning initial fish heading. The first 50 ms of startle responses are shown. f, Normalized heatmaps of the fish head position at consecutive times relative to the position at the start of the startle response. The top row shows snapshots of the trajectories shown in e. After a fast initial displacement to the left or right, D. cerebrum continues on a forward trajectory.
Extended Data Fig. 5
Extended Data Fig. 5. Habituation of the startle response.
a-b, Startle probability of each fish across all sound configurations as a function of the number of playbacks triggered by the fish. a, For main experiment (in untreated fish). b, For experiment in neomycin-treated fish. c-f, Details on habituation, data from main experiment (in untreated fish). c, Startle probability (the fraction of playbacks with startles, computed per bin) increases with time since the previous playback (green curve, the 95% confidence interval is given by Wilson scores). d, Startle probability (the fraction of playbacks with startles, computed per bin) decreases throughout the recording (green curve, the 95% confidence interval is given by Wilson scores). e, Startle probability as 2D binned statistics to show the interaction between time in recording and time since the last playback with the number of previous playbacks (Nth playback); white: no data. f, Average speeds over the course of the recording. Because fish that startle after playback have a higher speed before playback (see also Extended Data Fig. 4b), a decreased swimming speed could explain the decreasing startle probability over the course of the recording shown in d. Average speed is computed across 25 ms at a time 1 s before sound onset (before playback) and across 25 ms after sound onset (after playback), separately for startle and non-startle trials. The confidence interval indicates the standard error of the mean. Note the split y-axis. The speed of fish before playback stayed constant over the course of the recording. Hence habituation is not explained by a decrease in swimming activity over 50 min. a-f, Together, startle probability increases if the fish is in a fast swimming state and decreases, the less time has passed since the last playback and the more playbacks have been played previously (both signs of habituation).
Extended Data Fig. 6
Extended Data Fig. 6. Directional startles are present for both sexes and in individual fish.
Centered startle trajectories for single speaker configurations and trick configurations, same data as shown in Fig. 2f but separated by sex. Both male and female D. cerebrum startle away from single active speakers and startle towards the active speaker in the trick configuration. a, Single speaker configuration. Left: females (75% of 186 startles away from the speaker in 26 female fish that startled, two-sided binomial test: p = 9 × 10⁻¹²). Right: males (83% of 312 startles away from the speaker in 38 male fish that startled, two-sided binomial test: p = 1 × 10⁻³³). b, Trick configuration. Left: females (72% of 107 startles towards the speaker in 23 female fish that startled, two-sided binomial test: p = 6 × 10⁻⁶). Right: males (64% of 224 startles towards the speaker in 38 fish that startled, two-sided binomial test: p = 2 × 10⁻⁵). a-b, Percentages indicate the fraction of startle displacements into the direction of the blue arrow. The heatmaps are normalized and smoothed 2D histograms over endpoint positions of the shown trajectories. c, To estimate the directional bias in individual fish, we selected fish with at least one startle in both the single speaker condition and the trick condition (N = 46) to compute the number of fish with a mean directional bias away from the speaker (bias > 0.5): 41 of 46 fish in the single speaker configuration, two-sided binomial test: p = 4 x 10⁻⁸, and 10 of 46 in the trick configuration, two-sided binomial test: p = 2 × 10⁻⁴. Hence, individual fish escaped away from the single left–right speaker but approached it in the trick condition. d, The mean directional bias computed across fish with ≥ 10 startles in both conditions (N = 5, a subset of a) amounted to a directional bias of mean ± std. = 84% ± 13% away from the speaker in the single speaker configuration and to 72% ± 9% towards the speaker in the trick configuration. c-d, Line thickness is proportional to the number of minimum startles in response to one of the two sets of stimuli. Blue line: average directional bias across fish directional biases.
Extended Data Fig. 7
Extended Data Fig. 7. Data summary on all twelve stimuli for both cohorts.
Centered startle trajectories and displacement heatmaps for each stimulus used in the experiments, startle trials are pooled across all tested fish. a, for fish without an ablated lateral line. b, for fish with an ablated lateral line. a-b, Percentages indicate fraction of startles to the right. P-values report the probability that startles are unbiased in any direction (Two-sided binomial test, null hypothesis: p = 0.5, Bonferroni-corrected: n = 12 stimuli).
Extended Data Fig. 8
Extended Data Fig. 8. Sound monopoles and sound configurations.
a, Pressure level (dashed line) falloff next to a sound monopole at several phase snapshots of a propagating wave. Left: Falloff of a 1 kHz wave over 1.5 m. Right: The falloff across the width of the fish at 3 cm distance to a monopole sound source stems from the level falloff with distance. b, Both amplitude ratio and relative phase between pressure and particle velocity change in a distance-dependent manner. Both sound directions (-x, x) stay separate in the relative phase between pressure and particle velocity. c-f, Results of a simple model used to illustrate level and phase of pressure and motion along the horizontal x-axis of the inner tank. The idealized speaker activations in the different sound configurations are modeled as sinusoidal monopole sound sources (see pressure equation in b) located 6 cm away from the origin with frequency f = 780 Hz and speed of sound c = 1500 m/s. Acceleration is calculated from the spatial pressure gradient along the x-axis. The top rows are phasor representations of pressure or motion at five positions along the horizontal axis as indicated in the left cartoon. ILDs and ITDs are computed across a distance of 600 µm centered at the origin. See also Fig. 4 for a summary on ILD and ITD across sound configurations. c, In the single speaker configuration, P-ILD, P-ITD, M-ILD, and M-ITD could be interpreted as rightward cues by the fish. M-ITD is even smaller than P-ITD as motion phase propagates slower than pressure phase in the near field. d, In the trick configuration, P-ILD and P-ITD are inverted, while M-ILD and M-ITD remain unchanged as compared to the single speaker configuration. c-d, See Methods section on interaural cues for comparable P-ILD and M-ILD measurements in our setup. Note that we model monopoles in open water here, but the actual speakers are extended pressure sources in a tank. e-f, In both the pressure configuration and the particle motion configuration P-ILD, P-ITD, M-ILD, and M-ITD are zero or undefined.
Extended Data Fig. 9
Extended Data Fig. 9. Directional behaviour is present after lateral line ablation.
a-d, Same as in Fig. 2c–f but for lateral line ablated (LLA) D. cerebrum a, Illustration of six different stimulus configurations. The cartoons of resulting traces illustrate the pressure and particle velocity relationship, idealized for a plane wave scenario. b-d, Centered startle trajectories after sound playback. b, Directional escapes away from a single speaker for a positive polarity waveform (66% escapes, two-sided binomial test: p = 0.0003 across n = 142 startles in 67 fish with startle trials in this sound configuration) and negative polarity waveform (69% escapes, two-sided binomial test: p = 1 × 10⁻⁶ across n = 164 startles in 69 fish with startle trials in this sound configuration). c, Absence of directional bias in the positive polarity condition with only pressure (51 %, two-sided binomial test: n.s.; p > 0.05) and only particle motion (48%, two-sided binomial test: n.s.; p > 0.05). See Extended Data Fig. 8 for opposite polarity results. d, Single speaker playbacks pooled over both polarities evoke a directional escape (67% escapes, two-sided binomial test: p = 1 × 10⁻⁹ across n = 306 startles in 72 fish with startle trials in this sound configuration). Selective inversion of pressure polarity by an additional opposing pair of speakers along the orthogonal axis inverts the relative polarity between pressure and particle velocity. This implements the trick condition, in which the fish is tricked into performing startles approaching the active speaker (68% approaches, two-sided binomial test: p = 2 × 10⁻⁹ across n = 271 startles in 73 fish with startle trials in this sound configuration). b-d, Percentages indicate the fraction of startle displacements into the direction of the blue arrow. The heatmaps are normalized and smoothed 2D histograms over endpoint positions of the shown trajectories (gray for single stimulus data, blue for pooled data). e-f, D. cerebrum stained with DASPEI, imaged under an epifluorescence microscope. Images are constructed from several fields of view (gray dotted lines). Scale bar: 2 mm e, In untreated fish, neuromasts are visible as green dots (see exemplary white arrows). f, After neomycin treatment, no neuromasts are visible, confirming lateral line ablation. g-h, Functional indicators of lateral line ablation. g, Neomycin-treated fish have significantly more wall contacts within the secondary escape trajectory, i.e. within ~500 ms (independent one-sided t-test p = 1 × 10⁻⁵, after blind manual classification of the first ten startles in each recording into startles with and without wall contact. Some fish had less than ten startles, hence black dots are not always multiples of 10%). h, Left: In the light, untreated control shoals of mixed-sex adult D. cerebrum did not capture significantly more Artemia than neomycin-treated shoals (n = 4 shoals in each condition, independent one-sided t-test, p = 0.17). Right: In the dark, untreated shoals captured more Artemia (p = 0.024, independent one-sided t-test, n = 4 shoals in each condition), possibly using their intact lateral line sense. g-h, vertical gray stripe on violin plot indicates quartiles of data.
Extended Data Fig. 10
Extended Data Fig. 10. Method for extracting 2D phase maps of tissue motion with laser scanning confocal reflectance microscopy.
a, Experimental setup (see Methods section on vibrometry for details on the acoustic stimulation system). b, Illustration of phase map extraction: (i) A single bead is located within the field-of-view and (ii) oscillates in the horizontal x direction during acoustic stimulation. (iii) The bead is imaged with a laser scanning microscope, with each pixel being acquired at a different time. Line-scan and acoustic stimulation are synchronized to probe the bead at four different phases (blue: 0, red: π/2, yellow: π, green: 3π/2). (iv) Data are reshaped to reconstruct the full movie of the bead motion. (v) The bead displacement is computed using a cross-correlation-based algorithm (see Methods). (vi) The amplitude and phase of the first Fourier component of the bead displacement are extracted and plotted respectively with hue and color. c, (i) The sound phase and consequently the bead displacement phase is drifting when the pressure wave propagates along the horizontal x direction. Different motion phases are then detected for objects at different locations in the field-of-view, although being stimulated by the same sound wave. (ii) This additional phase Ψ is subtracted to yield a phase map with free objects exhibiting the same phase for the same sound stimulation. The final phase relationship between various objects therefore only depends on the mechanical properties of the imaged structure.
Extended Data Fig. 11
Extended Data Fig. 11. 2D optical vibrometry in three sound configurations.
Phase-amplitude particle velocity maps for 1 kHz component in response to 1 kHz speaker signals in the single speaker configuration (column 1), the pressure configuration (column 2), and the particle motion configuration (column 3). Depicted velocity amplitudes were scaled up by a factor of two in the single speaker condition to more readily compare responses to the pressure and motion configurations, where two speakers created a signal with approximately twice the pressure and motion amplitude. Across all three panels a-c, single-speaker maps resemble the addition of the pressure and motion maps. Sound stimulation was along the x-axis in all cases. See Fig. 3a for the location of depicted views and Fig. 3c–e for names of anatomical regions. a, Tripus tip and scaphium contract along the fish’s medial-lateral axis (x) in the pressure configuration but not in the particle motion configuration. b, The scaphium and the sagitta move at different phases along the fish’s ventral-dorsal axis (x) relative to surrounding tissue in the pressure configuration but not in the particle motion configuration. c, The lapillus moves with a phase lag to surrounding tissue along the medial-lateral axis (x) in the particle motion configuration but not the pressure configuration.
Extended Data Fig. 12
Extended Data Fig. 12. Excluding rostro-caudal swim bladder mechanism and cryptic visual cues.
a, To test the hypothesis that the pair of rostral and caudal swim bladder could implement a P-ILD or P–ITD sensor along the rostrocaudal axis, we filtered for playbacks where D. cerebrum was aligned orthogonal to the left–right axis during sound arrival at the fish location. Top: all data, same as Fig. 2f. Middle: filtered for ± 10° alignment to y-axis, Single speaker (79% escapes, two-sided binomial test: p = 6 × 10⁻¹⁶, n = 183 startle trials in N = 59 fish), Trick configuration (72% escapes, two-sided binomial test: p = 3 × 10⁻⁷, n = 133 startle trials in N = 56 fish). Bottom: filtered for ± 3° alignment to y-axis, Single speaker (74% escapes, two-sided binomial test: p = 1 × 10⁻⁴, n = 66 startle trials in N = 47 fish), Trick configuration (76% escapes, two-sided binomial test: p = 8 × 10⁻⁴, n = 45 startle trials in N = 45 fish). b-c, Replication of the experiment in the dark to exclude the possibility of unknown visual cues. b, Top view of the modified setup for playback experiment in the dark. In the dark, the white inner tank walls could no longer prompt D. cerebrum to swim orthogonal to the left–right axis. To nevertheless trigger playbacks at the center of the tank with the fish being aligned orthogonally within a 45° cone, we added an additional constraining tank made from thin transparent plastic, thereby increasing the likelihood of triggering playback. c, Centered startle trajectory for experiment in the dark. Left: activation of the left speaker leads to rightward startles (71%, two-sided binomial test: p = 9 × 10⁻⁵, n = 92 startle trials in N = 43 fish). Right: activation of the right speaker leads to leftward startles (69%, two-sided binomial test: p = 0.0004, n = 93 startle trials in N = 43 fish).

Similar articles

Cited by

References

    1. Jeffress, L. A. A place theory of sound localization. J. Comp. Physiol. Psychol.41, 35–39 (1948). - PubMed
    1. Carr, C. & Konishi, M. A circuit for detection of interaural time differences in the brain stem of the barn owl. J. Neurosci.10, 3227–3246 (1990). - PMC - PubMed
    1. Konishi, M. Coding of auditory space. Annu. Rev. Neurosci.26, 31–55 (2003). - PubMed
    1. Knudsen, E. I. & Konishi, M. Mechanisms of sound localization in the barn owl (Tyto alba). J. Comp. Physiol. A133, 13–21 (1979).
    1. Kandel, E. R., Koester, J. D., Mack, S. H. & Siegelbaum, S. A. in Principles of Neural Science (eds Kandel, E. R. et al.) 651–681 (McGraw Hill, 2021).

Substances

LinkOut - more resources