. 2024 Jul;631(8019):189-198.
doi: 10.1038/s41586-024-07575-x. Epub 2024 Jun 19.

Human SARS-CoV-2 challenge uncovers local and systemic response dynamics

Affiliations

Human SARS-CoV-2 challenge uncovers local and systemic response dynamics

Rik G H Lindeboom et al. Nature. 2024 Jul.

Erratum in

  • Author Correction: Human SARS-CoV-2 challenge uncovers local and systemic response dynamics.
    Lindeboom RGH, Worlock KB, Dratva LM, Yoshida M, Scobie D, Wagstaffe HR, Richardson L, Wilbrey-Clark A, Barnes JL, Kretschmer L, Polanski K, Allen-Hyttinen J, Mehta P, Sumanaweera D, Boccacino JM, Sungnak W, Elmentaite R, Huang N, Mamanova L, Kapuge R, Bolt L, Prigmore E, Killingley B, Kalinova M, Mayer M, Boyers A, Mann A, Swadling L, Woodall MNJ, Ellis S, Smith CM, Teixeira VH, Janes SM, Chambers RC, Haniffa M, Catchpole A, Heyderman R, Noursadeghi M, Chain B, Mayer A, Meyer KB, Chiu C, Nikolić MZ, Teichmann SA. Lindeboom RGH, et al. Nature. 2024 Aug;632(8025):E3. doi: 10.1038/s41586-024-07838-7. Nature. 2024. PMID: 39090314 Free PMC article. No abstract available.

Abstract

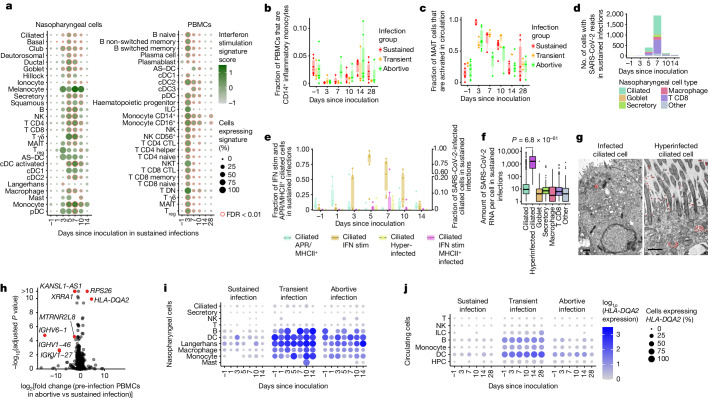
The COVID-19 pandemic is an ongoing global health threat, yet our understanding of the dynamics of early cellular responses to this disease remains limited1. Here in our SARS-CoV-2 human challenge study, we used single-cell multi-omics profiling of nasopharyngeal swabs and blood to temporally resolve abortive, transient and sustained infections in seronegative individuals challenged with pre-Alpha SARS-CoV-2. Our analyses revealed rapid changes in cell-type proportions and dozens of highly dynamic cellular response states in epithelial and immune cells associated with specific time points and infection status. We observed that the interferon response in blood preceded the nasopharyngeal response. Moreover, nasopharyngeal immune infiltration occurred early in samples from individuals with only transient infection and later in samples from individuals with sustained infection. High expression of HLA-DQA2 before inoculation was associated with preventing sustained infection. Ciliated cells showed multiple immune responses and were most permissive for viral replication, whereas nasopharyngeal T cells and macrophages were infected non-productively. We resolved 54 T cell states, including acutely activated T cells that clonally expanded while carrying convergent SARS-CoV-2 motifs. Our new computational pipeline Cell2TCR identifies activated antigen-responding T cells based on a gene expression signature and clusters these into clonotype groups and motifs. Overall, our detailed time series data can serve as a Rosetta stone for epithelial and immune cell responses and reveals early dynamic responses associated with protection against infection.


Conflict of interest statement

R.G.H.L., L.M.D., R.E. and S.A.T. are inventors on a filed patent that is related to the detection and application of activated T cells. In the past 3 years, S.A.T. has received remuneration for scientific advisory board membership from Sanofi, GlaxoSmithKline, Foresite Labs and Qiagen. S.A.T. is a co-founder and holds equity in Transition Bio and Ensocell. From 8 January 2024, S.A.T. is a part-time employee of GlaxoSmithKline. R.E. is a co-founder and equity holder in Ensocell. P.M. is a Medical Research Council (MRC)-GlaxoSmithKline EMINENT clinical training fellow with project funding unrelated to the topic of this work and receives co-funding from the National Institute for Health Research (NIHR) University College London Hospitals (UCLH) Biomedical Research Centre. P.M. reports consultancy fees from SOBI, AbbVie, UCB, Lilly, Boehringer Ingelheim and EUSA Pharma, all unrelated to this study. S.M.J. has received fees for advisory board membership in the last three years from Bard1 Lifescience. He has received grant income from GRAIL Inc. He is an unpaid member of a GRAIL advisory board. He has received lecture fees for academic meetings from Cheisi and AstraZeneca. His wife works for AstraZeneca. R.C.C. has research collaborations with Chiesi Chiesi Farmaceutici S.p.A. and GSK and receives consulting fees from Vicore, outside the submitted work. A. Mann, A.C., M.K., M.M. and A.B. are full-time employees at hVIVO Services. The other authors declare no competing interests.

Figures

Fig. 1
Fig. 1. Extensive temporal cell-state dynamics after SARS-CoV-2 inoculation.
a, Illustration of the study design and cohort composition. b,c, Uniform manifold approximation and projection (UMAP) plots of all nasopharyngeal cells (n = 234,182), colour coded by their broad cell-type annotation (b), by the infection group (c, top) and by days since inoculation (c, bottom). Only cells from sustained infection cases are shown in c, bottom. Treg, regulatory T cell; AS–DC, AXL+SIGLEC6+ dendritic cell. d,e, UMAP plots as in b and c, but showing all PBMCs (n = 371,892). CTL, cytotoxic T lymphocyte; DN, double negative. f, Fold changes in abundance of nasopharynx-resident broad immune cell-type categories. Immune cell abundance was scaled to the total amount of detected epithelial cells in every sample before calculating the fold changes over days since inoculation compared with pre-infection (day –1) by fitting a GLMM on scaled abundance. Fitted fold changes are colour coded and we used the local true sign rate and Benjamini–Hochberg procedure to calculate false-discovery rates (FDRs), which are shown as the size of each dot. The mean cell-type proportions over all cells and samples are shown in the green heatmap to the right of the dot plot to aid the interpretation of changes in cell-type abundance. Illustration in a was created using BioRender (https://www.biorender.com).
Fig. 2
Fig. 2. Cell-state-specific antiviral responses and infection.
a, Mean expression of interferon-stimulated genes in participants with sustained infections for nasopharyngeal cells (left) and PBMCs (right). Red circles indicate significant change from day –1 by Bonferroni-corrected Mann–Whitney U-test. b, Relative fraction of circulating inflammatory monocytes over time since inoculation. n = 8,479 inflammatory monocytes examined over 73 unique samples. c, Fraction of circulating MAIT cells that are activated. n = 6,370 MAIT cells examined over 77 unique samples. d, Number of SARS-CoV-2+ nasopharyngeal cells (after background subtraction) in sustained infection cases. e, Fraction of ciliated cells that are annotated into response or infection cell states. Sustained infection cases are shown. Interferon-stimulated (IFN stim) and APR+ ciliated cells are shown on the left y axis, whereas infected ciliated cells are shown on the right y axis. n = 61,087 ciliated cells examined over 42 unique samples. MHCII, MHC class II. f, Number of viral reads per SARS-CoV-2+ cell. P value by two-sided Mann–Whitney U-test, n = 2,505 infected cells examined over 12 unique samples. g, Representative transmission electron micrographs of infected (left) and hyperinfected ciliated cells (right) from SARS-CoV-2-infected in vitro human nasal epithelial cultures. Viral particles are false coloured red to aid visualization. Scale bar, 1 μm. h, Differential expression analysis of pre-inoculation PBMCs (day –1), comparing abortive with sustained infection cases. Red points highlight significantly changing genes with a FDR < 0.01 and a log2 fold change > 2 or < –2. Nasopharyngeal analysis is shown in Extended Data Fig. 6e. Adjusted P values by Wald test accounting for sex, cell type and sequencing library identifier. i,j. HLA-DQA2 expression in nasopharyngeal cells (i) and in PBMCs (j). HPC, haematopoietic progenitor cell. Significance for b, c and e is shown in Extended Data Fig. 7e–g. In all box plots, the centre line is the median, the box shows the interquartile range (IQR) and the whiskers are extreme values after removing outliers.
Fig. 3
Fig. 3. Adaptive immune responses emerge at day 10 after inoculation.
a, Circulating T cells (from PBMCs) across all infection groups, with distinct clusters of activated T cells highlighted in bold. CM, central memory; EM, effector memory; EMRA, CD45RA+ effector memory; RTE, recent thymic emigrant; TH1, T helper 1. b, Marker gene and protein expression of activated T cell subsets. c, Percentages of nasopharyngeal T cells across all infection groups that were activated. n = 28,426 T cells examined over 104 unique samples. d, Boxplot as in c, but showing circulating activated T cells. n = 155,058 T cells examined over 77 unique samples. e, UMAP as in a, but showing nasopharyngeal T cells. f, Fold changes in conventional T cell state abundance compared with pre-inoculation in sustained infections. Only cell states that significantly change at a FDR < 10% at least once are shown. Nasopharyngeal T cell abundance was scaled to the total amount of detected epithelial cells. Fold changes and significance were calculated by fitting a GLMM as shown in Fig. 1. The mean cell-type proportions over all cells and samples is shown in the green heatmap to the right of the dot plots. g, TCR clonality and expansion of activated T cells at day 14 in sustained infection cases was validated using bulk PBMC TCR sequencing. For TCRs that matched the single-cell gene expression, normalized clonality TCRα (left) and TCRβ (right) data are separated by type and expressed as the average fraction of total clones in sample contributed by a cell of that type. n = 1,988 activated T cells examined over 30 unique samples. UMI, unique molecular identifier. h, Abundance of TCR clusters relative to all TCRs, with activated TCR clusters colour coded and their TCR motifs shown. In all box plots, the centre line is the median, the box shows the IQR and the whiskers are extreme values after removing outliers.
Fig. 4
Fig. 4. Integrating COVID-19 patient data reveals public SARS-CoV-2 TCR motifs.
a, UMAP of the integration of five COVID-19 patient datasets (n = 946,584 T cells) with paired RNA and V(D)J sequencing data. Cell-type labels were inferred using CellTypist, trained on manual annotations of PBMCs from the current study. b, Fraction of activated T cells across all T cells in COVID-19 (n = 240 samples, 517,485 PBMCs), convalescent (n = 82 samples, 149,653 PBMCs) and healthy (n = 88 samples, 206,860 PBMCs) samples of five COVID-19 patient datasets. Significance levels after two-sided and uncorrected Mann–Whitney–Wilcoxon testing are shown. In all box plots, the centre line is the median, the box shows the IQR and the whiskers are extreme values after removing outliers. c, Activated T cell types highlighted on the UMAP representation from a. d, Clustermap of pairwise TCR distances with the sequence logos for 11 shared motifs on the right-hand side. Each column and row corresponds to a unique TCR, and the distance to each TCR in the set is indicated by colour. Only activated T cells with public motifs shared by five or more individuals are shown. Low distances indicate similar TCRs, with distances of 40 and less potentially producing TCRs that recognize the same epitopes. For sequence logos, letter height indicates frequency of amino acid at that position across T cells pertaining to the motif. Amino acids are coloured by side chain chemistry: acidic (red), basic (blue), hydrophobic (black), neutral (purple), polar (green). Data were obtained from refs. ,,–. e, Clinical measurements and symptoms averaged over participants challenged with SARS-CoV-2 and developing sustained infection for day –1 to day 14 after inoculation. Major molecular events in the immune response are highlighted with arrows.
Extended Data Fig. 1
Extended Data Fig. 1. Overview of Single-Cell Human SARS-CoV-2 Challenge Study cohort.
(a) Timeline of the samples collected from each of the 16 participants enrolled in our single-cell profiling study. Sample collections are shown relative to the date of SARS-CoV-2 inoculation (day 0). Samples are shown by infection group (sustained, transient and abortive), with their sex (self-identified). *Indicates participants who were either vaccinated (participant 9) or reported to have developed a community infection, before or immediately after blood samples were taken on day 28 (participants 7 and 8). See ‘Study participant and design’ section in the methods for more details. Visualization of the nasal (mid-turbinate) and throat (pharyngeal) viral kinetics via swabs. Shown for each participant as measured (twice daily at 12 h intervals) via (b) RT-qPCR and (c) quantitative culture by focus forming assay (FFA), with values shown. The lower limit of quantification (LLOQ) for RT-qPCR was 3 log10 copies per ml, with positive detections less than the LLOQ assigned a value of 1.5 log10 copies per milliliter and undetectable samples assigned a value of 0 log10 copies copies per milliliter. In the FFA the LLOQ was 1.27 FFU ml−1; viral detection less than the LLOQ was assigned 1 log10 FFU ml−1; and undetectable samples were assigned 0 log10 FFU ml−1. Patients were identified as testing positive if they had at least one RT-qPCR test where the viral load was able to be quantified (≥LLOQ). Six participants were seen to present multiple, sequential, positive RT-qPCR results and were classified as having a sustained infection. Three participants were seen to have standalone positive results and were classified having transient infections. Seven participants never presented a single RT-qPCR test result ≥ LLOQ and these were classified as abortive infections. FFA tests were only performed for patients identified as having sustained infections. Infection intervals for each participant were calculated based on the first and last values across the nose and throat, where positive tests below the LLOQ were counted if they occurred <2 days of a quantifiable (≥ LLOQ) test result. *Indicates where the patient was discharged from quarantine prior to testing negative. The black octagon highlights patients that were still reporting positive results at day 28 post-inoculation.
Extended Data Fig. 2
Extended Data Fig. 2. All identified and annotated cells.
(a) UMAP of all PBMCs, color-coded and labeled by detailed cell state annotation. Subsets of B cells with differential immunoglobulin chain usage are not shown in full detail for clarity. (b) UMAP of all nasopharyngeal cells, color-coded and labeled by detailed cell state annotation.
Extended Data Fig. 3
Extended Data Fig. 3. Marker gene expression used for annotation.
Marker gene expression of cell states annotated in (a) nasopharyngeal immune cells, (b) nasopharyngeal epithelial cells, (c) myeloid and progenitor PBMCs.
Extended Data Fig. 4
Extended Data Fig. 4. Marker gene expression used for annotation of PBMCs.
Marker gene expression of cell states annotated in (a) T, NK and ILC cells in PBMCs, (b) B cells in PBMCs.
Extended Data Fig. 5
Extended Data Fig. 5. Temporal response states.
(a) Line plot showing the mean proportions of interferon stimulated cells over time since inoculation within cell types with a distinct and annotated cluster of interferon stimulated cells for nasopharyngeal cells (top) and PBMCs (bottom). (b) Representative Immunofluorescence confocal image of SARS-CoV-2 infected human nasal epithelial cultures grown at air-liquid interface at 72 h post infection. Image shown as a maximum intensity projection of the z-stack. Cells are stained with antibodies for MX1 (green), SARS-CoV-2 spike protein (red), phalloidin (white) and DAPI (blue). White box indicates an area of high colocalisation of MX1 and spike protein staining. Scale bar represents 50μm. (c) Dotplot visualizing the mean expression of interferon stimulated genes across cell types and time since inoculation for every participant, for PBMCs (left) and nasopharyngeal cells (right). Red circles indicate significance that was calculated with a Mann Whitney U test compared to the other time points, followed by Bonferroni correction. (d) Marker gene expression of activated MAIT cells. (e) Representative flow cytometry plots showing activation marker expression (Ki67, CD71, CD69 and HLA-DR) by mucosal associated invariant T cells (MAITs; gated as lymphocytes/single-cells/live-cells/CD3+/CD161++TCR-Vα7.2+) from one non-infected control (left; orange) and one SARS-CoV-2 infected individual at the time of the first positive PCR infection (right; black). Numbers indicate percent positive for each marker including double positives. (f) Summary data for single marker (left) or co-expression (right) of activation markers by n = 116,386 total peripheral MAIT cells from n = 18 individual participants; n = 9 uninfected controls (open circles) and n = 9 individuals with co-incident infection (closed circles). P value shown for two-sided Mann-Whitney-U test. Bars, median.(g) Marker gene expression of response states observed in ciliated cells. (h) Boxplot validating relative changes in acute phase response ciliated cell signature expression in our validation cohort of bulk RNA-seq data of nasopharyngeal swabs from sustained infection cases, n = 61. P value shown from the comparison pre-infection to day 1 post-inoculation was determined using a two-sided Mann-Whitney U test. In all box plots, the central line is the median, the box shows the IQR and the whiskers are extreme values upon removing outliers. (i) Dotplot as in Extended Data Fig. 7, showing changes in myeloid cell type abundances compared to pre-infection in sustained infection cases that significantly change on at least one time point compared to pre-infection, for nasopharyngeal (bottom) and circulating myeloid cells (top). The size of the circle denotes the false discovery rate (FDR) The green color scale of the adjacent heatmap depicts the proportion of each cell type relative to all cells.
Extended Data Fig. 6
Extended Data Fig. 6. Temporal response states and activated T cells.
(a) Dotplot visualizing the mean expression of viral entry factors (ACE2, TMPRSS2, FURIN) and SARS-CoV-2 induced (interferon signalling related) genes (CXCL10, ILI44L, MX2), and viral reads. (b) Expression of viral genes by genomic region for each cell type with viral reads. (c) Heatmap of Spearman correlations between host gene expression and number of viral reads per cell, split by cell type. Shown genes have the highest correlation with viral reads in ciliated cells. (d) Barplots showing the distribution of detected viral reads over the SARS-CoV-2 genome in the five most highly infected cell types. The blue line represents a LOESS fit over the data. The top-right inset illustrates a uniform read distribution versus a 3’ biased read distribution. (e) Volcano plot of a differential gene expression analysis comparing pre-inoculation nasopharyngeal cells (day -1) from subsequent abortive infection cases to sustained infection cases. Adjusted P values were calculated with a two-sided Wald test while accounting for sex and cell type. (f) Boxplot showing the predictive power of circulating cell type-specific HLA-DQA2 expression in predicting before inoculation (day -1) if a participant subsequently becomes sustained infected. Five-fold cross validation using a 1:1 test-train split is shown in a logistic regression model, based on the mean HLA-DQA2 expression and fraction of HLA-DQA2 expressing cells per cell type. (g) Boxplot as in (f), but showing the predictive power of HLA-DQA2 expression in nasopharyngeal cell types. (h) HLA-DQA2 expression in our validation bulk RNA-seq datasets including all timepoints, split by infection group, for blood (n = 216) and nasal (n = 100) samples. P values were determined using a two-sided Mann-Whitney-U test. (i) TCR repertoire overlap of nasopharyngeal and circulating conventional T cells, stratified by cell state. We only considered the beta TCR chain to identify overlapping T cell clones and included T cells without a detected TRA sequence. (j) Memory formation analysis in an individual with sustained SARS-CoV-2 infection. Unique TCR clones are distinguished by color and numbered with their clone_id identifier. A shaded area is drawn when the same clone appeared with several distinct cell type labels, and the size of the shaded area informs their relative ratios. (k) TCR bulk data with matched single-cell labels as in Fig. 3g, but showing the fraction of unique TCR UMIs on abortive infections for activated and other T cells. No particular changes are observed across the three time points sampled. n = 4123 T cells examined over 29 unique samples. (l) The fraction of activated T cells that participate in TCR clonotype groups versus the fraction of cells in each group that originate from participants with sustained infections, which reveals that clonotype groups that contain activated T cells are exclusively populated by T cells from sustained infections. Clonotype groups are defined based on TCR distance as described in detail in the methods, and can include T cells from multiple participants and several T cell subtypes. (m) Scatterplot as in (l), but showing BCR clonotype groups and the fraction of antibody secreting B cells instead of activated T cells. (n) Fraction of unique paired-chain clones matching SARS-CoV-2 entries in Immune Epitope Database (IEDB) across all T cell clones within that broad T cell compartment. Significance level after two-sided Whitney-Mann testing shown for activated vs effector T cells (putative SARS-CoV-2 fraction 3.5 times higher in activated T cells, p = 7.437 ∗ 10−89). (o) Temporal inference on PBMCs from publicly available COVID-19 patients (n = 210), showing the difference between predicted time since viral exposure and reported time since onset of symptoms, split by reported severity. (p) Coincidence analysis of TCR sequence diversity restriction in phenotypic subsets. Fraction of clonotype pairs within each phenotypic cluster that share identical CDR3 amino acid sequences (but distinct nucleotide sequences) normalized by the same statistics calculated across all clonotypes, for alpha, beta, and both chains together. The ratio of within cluster versus overall sequence coincidence probabilities is a measure of the breadth of epitopes targeted by the different clonotypes within a cluster. (q) Boxplot showing the pre-infection expression of HLA-DQA2 (n = 16 participants) in nasopharyngeal (left) and circulating (right) professional antigen presenting cell types, across participants and the infection groups. In all box plots, the central line and the notch are the median and its approximate 95% confidence interval, the box shows the IQR and the whiskers are extreme values upon removing outliers.
Extended Data Fig. 7
Extended Data Fig. 7. Detailed temporal dynamics in cell state abundances.
(a) Proportion of CD8+ infiltrating T cells that use αβ TCRs, typical Dv2/Gv9 γδ TCRs, or atypical γδ TCRs is shown. (b) The relative immune repertoire composition of γδ T cells in circulation and nasopharynx after challenge are shown in the left and right bars, respectively. γδ chain pairs that are significantly more or less abundant between circulation and nasopharynx (p < 0.05) are highlighted with an asterisk. Exact uncorrected P values are 0.02 for TRDV2_TRGV9, TRDV1_TRGV4, TRDV3_TRGV4, and TRDV1_TRGV3, and 0.03 for TRDV3_TRGV5, TRDV1_TRGV10, TRDV3_TRGV8, and TRDV1_TRGV5, and were determined using a two-sided Mann-Whitney-U test. (c) Plot as in Fig. 3h, but showing BCR clusters. Immunoglobulin class usage within each activated BCR cluster is shown in the rightmost bars. (d) Dotplot as in Fig. 3f, showing the fold changes in B cells in sustained infections. Legend for mean cell type proportions (f). (e) Fold changes in abundance of cell states in PBMCs. Detailed annotation of interferon stimulated subsets and immunoglobulin class specific cell states are not shown for clarity. Immune cell abundances were scaled to the total amount of detected PBMCs in every sample prior to calculating the fold changes over days since inoculation compared to pre-infection (day -1) by fitting a GLMM on scaled abundances. The mean cell type proportions over all cells and samples is shown in the green heatmap right of the dotplot to aid the interpretation of changes in cell type abundances. (f) Dotplot as in (e), but showing nasopharyngeal immune cells. Immune cell abundances were scaled to the total amount of detected epithelial cells in every sample. (g) Dotplot as in (e), but showing nasopharyngeal epithelial cells. (h) Linegraph validating the relative expression dynamics over time since inoculation of the type I interferon signalling signature from in sustained infection cases from our validation bulk RNA-seq datasets. (i) Boxplots showing bulk RNA-seq measurements of type I interferon signalling in blood and nasal swabs over time as shown in (h), but only focussing on samples with a paired blood and nasal measurement to perform paired analyses. Uncorrected P values of a paired two-sided Mann-Whitney-U test comparing nasal and blood samples at each time point are shown at the top. Preinfection baseline nasal and blood samples were collected at the day before and the same day as the inoculation, respectively. In all box plots, the central line is the median, the box shows the IQR and the whiskers are extreme values upon removing outliers. (j) Correlation analysis of relative cell type abundance and viral load as determined by qPCR. Peason correlation coefficients are shown on the X axis. Minus log10 transformed p values shown on the Y axis were corrected for multiple testing by the Benjamini-Hochberg procedure. Only infected cell types or cell types with an FDR < 0.01 are labeled. Dots from infected cell types were coloured black.
Extended Data Fig. 8
Extended Data Fig. 8. Validation of antigen-specific activated T cells.
(a) UMAP of all CD8+ T cells from the Dextramer assay, with cell types predicted by CellTypist model trained on previous PBMC data. Activated T cells form a distinct cluster. (b) Cell counts for CD8+ T cell types by HLA compatibility of donor with the highest-bound Dextramer. Only Activated T cells have positive log2 fold change for HLA-matched Dextramers. (c) UMAP as in (a), colored by HLA compatibility, again showing enrichment of activated T cells amongst HLA compatible pairs. (d) Gating strategy used to enrich SARS-CoV-2 antigen specific T cells via MACSQuant Tyto cell sorting. Cells were sequentially stained with a multi-allele panel of dCODE dextramer- PE complexes, with the addition of anti-human CD3-APC and CD14-FITC FACS antibodies as references to help us identify T cell specific binding. Debris and cell aggregates were gated out first using BSB-H (backscatter blue laser-height) SSC-H (side scatter-height). From the cells, DAPI+ dead cells were excluded. T cells (CD3+) and monocytes (CD14+) were then gated for (CD3+ and\or CD14+ population) and the sort gate defined from this population as all PE-dCODE Dextramer® positive cells. This lenient sorting strategy was decided upon in order to collect enough cells for 10×5’ single-cell analysis downstream and to ensure we were capturing all SARS-CoV-2 antigen specific cells. Any non-specific binding (e.g. to monocytes) and background noise could then be removed computationally. (e) Proportions of activated T cells bound to Dextramers loaded with selected SARS-CoV-2 antigens. The total amount of bound cells to each Dextramer is shown, color-coded by predicted cell state. If barcodes from several Dextramers were detected to be bound to the same cell, we only selected the Dextramer with the highest signal as bound. As a control to separate background and real binding, cells are separated based on the HLA haplotype compatibility with the tested Dextramer. Only Dextramers with at least 10 HLA matched bound cells are shown. FDR corrected p values were determined by a Fisher-exact test comparing the proportion of HLA matched activated T cells in the Dextramer bound cells to the proportion of unbound HLA matched activated T cells. N represents the number of cells in each bar. The right-most bar represents the overall distribution of cell types across all Dextramer experiments. (f) Predicted time since viral exposure is plotted against reported time since onset of symptoms. Lines represent LOESS fits of the data split and color coded by reported severity. (g) Linegraph validating the relative expression dynamics across time of the activated T cell signature shown in Fig. 4b, in our bulk RNA-seq validation dataset of nasal swabs. (h) Linegraph as in (g), but showing bulk RNA-seq blood samples.
Extended Data Fig. 9
Extended Data Fig. 9. Controls for microscopy data.
(a) Representative immunofluorescence confocal image of mock infected pediatric human nasal epithelial cultures grown at air-liquid interface at 72 h post-infection. Image shown as a maximum intensity projection of the z-stack. Cells are stained with antibodies for MX1 (green), SARS-CoV-2 spike protein (red) and DAPI (blue). Scale bar represents 30 μm. (b) Representative transmission electron micrographs of an uninfected ciliated cell (top left) and infected ciliated cell (top right) or hyper-infected ciliated cells (bottom panels). SARS-CoV-2 viral particles are false colored with red to aid visualization. Images taken using SARS-CoV-2 infected human nasal epithelial cultures grown in air-liquid interface 72 h post-infection. Scale bar represents 1 μm.
Extended Data Fig. 10
Extended Data Fig. 10. Temporally resolved epithelial and immune response in SARS-CoV-2 infections.
Summary figure highlighting the key finding from the study. These includes; 1) distinct temporal differences in the cellular dynamics observed between the different infection groups; 2) several novel conserved antiviral responses and higher baseline expression of HLA-DQA2 in participants who were exposed to the virus but who did not go on to develop a sustained infection; 3) novel characteristics of sustained infection, with a rapid relay observed in the blood compared to the site of inoculation, a dynamic local ciliated response occurring early on during infections (pre-symptoms) and a temporally restricted, distinct, SARS-CoV-2 specific activated T cell population which leads to immunological memory; and 4) the identification of public motifs in SARS-CoV-2 specific activated T cells. In addition, our work provides community tools for inference of specific TCR motifs (Cell2TCR) in activated T cells, a detailed publicly available reference database underpinning the detection of future biomarkers and antigen (Ag) targets for therapeutic applications. Schematic created with BioRender.com.

References

    1. Wagstaffe, H. R. et al. Mucosal and systemic immune correlates of viral control after SARS-CoV-2 infection challenge in seronegative adults. Sci. Immunol.9, eadj9285 (2024). 10.1126/sciimmunol.adj9285 - DOI - PubMed
    1. Blanco-Melo, D. et al. Imbalanced host response to SARS-CoV-2 drives development of COVID-19. Cell181, 1036–1045.e9 (2020). 10.1016/j.cell.2020.04.026 - DOI - PMC - PubMed
    1. Hadjadj, J. et al. Impaired type I interferon activity and inflammatory responses in severe COVID-19 patients. Science369, 718–724 (2020). 10.1126/science.abc6027 - DOI - PMC - PubMed
    1. Schulte-Schrepping, J. et al. Severe COVID-19 is marked by a dysregulated myeloid cell compartment. Cell182, 1419–1440.e23 (2020). 10.1016/j.cell.2020.08.001 - DOI - PMC - PubMed
    1. Stephenson, E. et al. Single-cell multi-omics analysis of the immune response in COVID-19. Nat. Med.27, 904–916 (2021). 10.1038/s41591-021-01329-2 - DOI - PMC - PubMed

MeSH terms