. 2024 Jul;631(8020):449-458.
doi: 10.1038/s41586-024-07601-y. Epub 2024 Jun 19.

Computational design of soluble and functional membrane protein analogues

Affiliations

Computational design of soluble and functional membrane protein analogues

Casper A Goverde et al. Nature. 2024 Jul.

Abstract

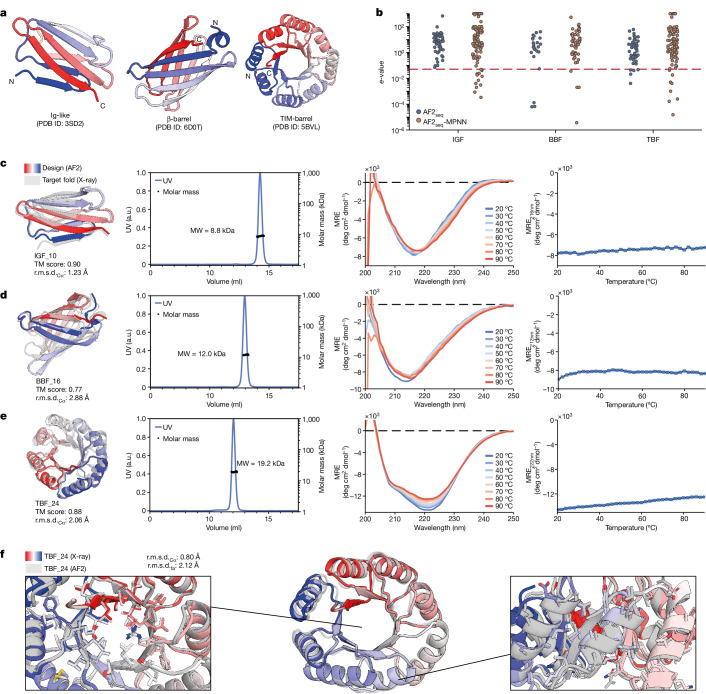
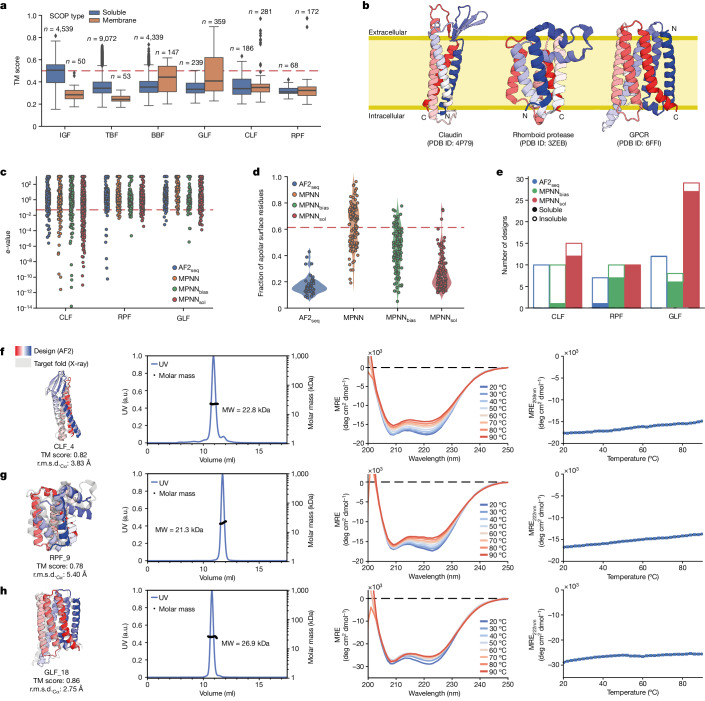
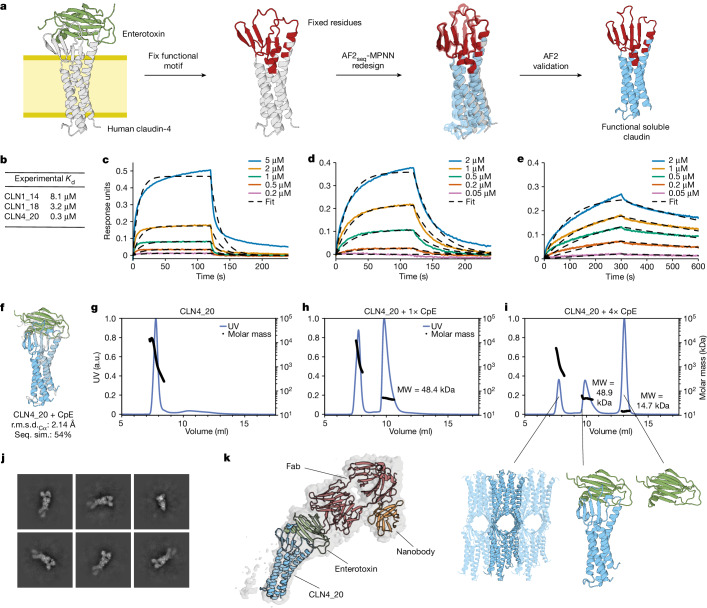
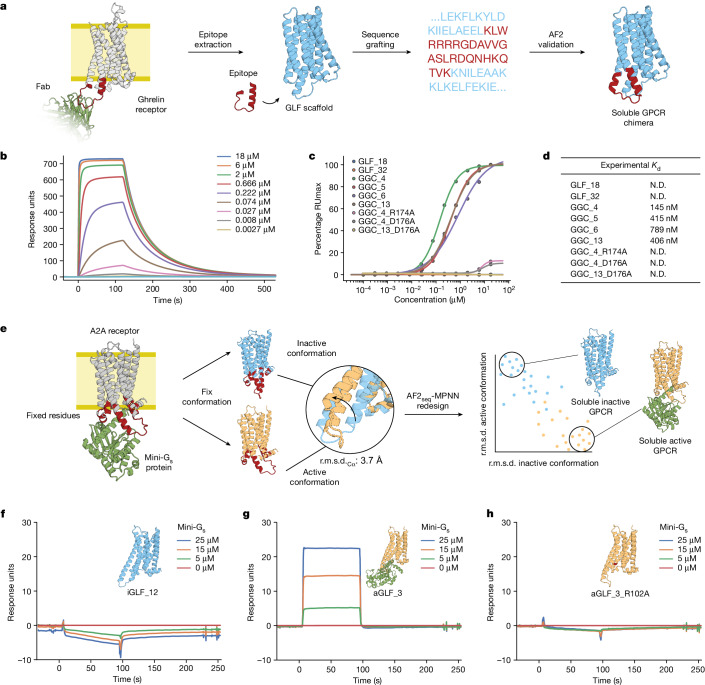
De novo design of complex protein folds using solely computational means remains a substantial challenge1. Here we use a robust deep learning pipeline to design complex folds and soluble analogues of integral membrane proteins. Unique membrane topologies, such as those from G-protein-coupled receptors2, are not found in the soluble proteome, and we demonstrate that their structural features can be recapitulated in solution. Biophysical analyses demonstrate the high thermal stability of the designs, and experimental structures show remarkable design accuracy. The soluble analogues were functionalized with native structural motifs, as a proof of concept for bringing membrane protein functions to the soluble proteome, potentially enabling new approaches in drug discovery. In summary, we have designed complex protein topologies and enriched them with functionalities from membrane proteins, with high experimental success rates, leading to a de facto expansion of the functional soluble fold space.


Conflict of interest statement

The authors declare no competing interests.

Figures

Fig. 1
Fig. 1. Overview of the fold space across different environments and computational design approach.
a, Overview of the occurrence of soluble and membrane folds in the SCOP structural database, with depictions of selected representatives. b, Schematic representation of the integrated design pipeline for backbone and sequence generation. Given a target structure, an initial sequence is generated using AF2 through loss function optimization. The resulting structure is then passed to ProteinMPNN to sample new amino acid sequences for a given fold. ProteinMPNN designs are filtered on the basis of structural similarity to the target, confidence and sequence diversity. c, Novelty of generated sequences resulting from different backbone sampling methods, evaluated by e-values relative to the non-redundant protein sequence database. d, Sequence recovery of core and surface residues of TBF ProteinMPNN designs generated on the basis of the reference crystal X-ray structure (Protein Data Bank (PDB) 5BVL), Rosetta-perturbed backbones (backrub protocol), molecular dynamics simulation trajectories or AF2seq-generated structures. Source Data
Fig. 2
Fig. 2. Experimental characterization of designed complex protein topologies.
a, Cartoon depiction of three protein topologies that have been challenging for computational design: IGF, BBF and TBF. b, Closest e-value hits for the AF2seq and AF2seq-MPNN designs when searching a non-redundant protein sequence database. The significance threshold of 0.05 is highlighted, indicating little sequence homology with natural sequences. ce, Characterization of designs IGF_10 (c), BBF_16 (d) and TBF_24 (e) showing superposition of the design (colour) and the target fold (grey), the corresponding SEC–MALS measurement, circular dichroism spectra at different incubation temperatures and the circular dichroism melting curve. f, X-ray structure of TBF_24 (coloured) superimposed on the design model (grey). Source Data
Fig. 3
Fig. 3. Experimental characterization of soluble analogues of membrane proteins.
a, Structural similarity for each of the target folds against the SCOP database. TM score cut-off of 0.5 is highlighted, denoting significant structural similarity to the reference fold. The centre line represents the median of the data (50th percentile), whereas the box (coloured) represents the 25th and 75th percentiles of the values. The whiskers show the minimum and maximum values of the distribution. Data points were considered to be outliers (black diamonds) if they fell outside the 1.5 interquartile range. b, Cartoon representation of three transmembrane topologies chosen to be redesigned as soluble folds: the CLF, RPF and GLF. c, Closest e-value hits of the solubilized CLF, RPF and GLF against a non-redundant protein sequence database. Most of the designed sequences differed substantially from natural sequences, as indicated by e-values higher than the significance threshold of 0.05 (red line). d, Fraction of hydrophobic residues found on the surface of the GLF designs using different sequence-generation methods following AF2seq backbone generation. The fraction of surface hydrophobics of the native GLF is 0.61 (red line). e, Number of designs resulting in soluble expression of the designed soluble membrane protein analogues. fh, Experimental characterization of CLF_4 (f), RPF_9 (g) and GLF_18 (h). Comparison of the design (colour) and target fold (grey) solution behaviour by SEC–MALS, circular dichroism spectra at different incubation temperatures and melting temperature profiles by circular dichroism. Source Data
Fig. 4
Fig. 4. Soluble analogues of membrane proteins solved by X-ray crystallography.
a, X-ray structure of CLF_4 (coloured) superimposed on the design model (grey). b, X-ray structure of CLF_4 (coloured) superimposed on the design model (grey). c, Molecular lipophilicity potential of the surface of the claudin design target and the soluble design CLF_4. d, X-ray structure of RPF_9 (coloured) superimposed on the design model (grey). e, X-ray structure of RPF_9 (coloured) superimposed on the design model (grey). f, Molecular lipophilicity potential of the surface of the rhomboid protease design target and the soluble design RPF_9. g, X-ray structure of GLF_32 (coloured) superimposed on the design model (grey). h, X-ray structure of GLF_32 (coloured) superimposed on the design model (grey). i, Molecular lipophilicity potential of the surface of the GPCR design target and the soluble GLF_32 design. After redesign of the original membrane folds with MPNNsol, the hydrophobicity (yellow) of the surface was significantly reduced, and polarity was increased (blue).
Fig. 5
Fig. 5. Functionalization of soluble analogues of claudin proteins.
a, Design workflow for solubilizing claudins with fixed functional residues. CpE is known to bind to human claudin-1 and claudin-4. b, Binding affinities derived from kinetic measurements for binding of solubilized claudins to CpE. ce, Binding kinetics for binding of solubilized claudins CLN1_14 (c) CLN1_18 (d) and CLN4_20 (e) to CpE. Association and dissociation during BLI are shown as solid lines and the respective fits as dashed lines. f, Cartoon depiction of design model of CLN4_20 bound to cCpE toxin (coloured) overlaid with the target fold (grey). gi, SEC–MALS analysis of CLN4_20 mixed with 0× (g), 1× (h) or 4× (i) molar excess of CpE toxin. j, Representative two-dimensional classes of CLN4_20 bound to cCpE toxin, COP2 Fab and a nanobody. k, Model of CLN4_20 complex docked into reconstructed cryo-EM density.
Fig. 6
Fig. 6. Functionalization of soluble analogues of GPCR proteins.
a, Design of a workflow for functionalization of soluble scaffolds through grafting of the native epitope corresponding to the ICL3 loop of the ghrelin GPCR receptor that can be probed with a Fab (PDB 6KO5). b, Representative SPR sensorgram displaying binding kinetics of increasing concentrations of ghrelin targeting antibody binding to GLF–ghrelin chimera 4 (GGC_4). c, Binding affinities determined by SPR of the designed GGC constructs and corresponding negative controls. d, Table summarizing experimental affinity constants from data shown in c. N.D. indicates that Kd values could not be extrapolated confidently. e, Design of a workflow for conformation-specific design of the active (PDB 5G53) and inactive (PDB 3VGA) forms of the adenosine A2A receptor to facilitate or preclude mini-Gs protein binding. fh, SPR sensorgram of the inactive form iGLF_12 (f), active form aGLF_3 (g) and binding knockout mutant of aGLF_3 soluble analogue (h).
Extended Data Fig. 1
Extended Data Fig. 1. RMSD of designed TIM-barrel structures vs the target fold crystal structure (PDB ID: 5BVL).
a, Backbone RMSD deviations of input structures used for ProteinMPNN sequence redesign. b, Backbone RMSD deviations of the highest ranked AF2 predicted structure derived from the ProteinMPNN-designed sequences from panel a. c, Sequence recovery percentage by ProteinMPNN in the core and on the surface with different values of Gaussian noise applied to the backbone atoms. d, The e-values of the generated ProteinMPNN sequences with varying degrees of noise compared to AF2seq generated sequences. e, Backbone RMSD deviations of predicted structures of ProteinMPNN and AF2seq generated sequences. f, AF2 confidence (pLDDT) scores of predicted structures.
Extended Data Fig. 2
Extended Data Fig. 2. Computational analysis of GPCR backbone (PDB ID: 6FFI) perturbation methods for diversifying sequence design.
a, Backbone RMSDs relative to the reference crystal structure after being perturbed using Rosetta backrub, MD simulations, or using our AF2seq pipeline. b, Sequence recovery rates of ProteinMPNN sequence generation on the perturbed backbones. c, Backbone RMSD of the top ranking AF2 model of ProteinMPNN sequences relative to the reference crystal structure. d, AF2 confidence scores of top ranking ProteinMPNN-derived predictions.
Extended Data Fig. 3
Extended Data Fig. 3. Relative Contact Order (RCO) plotted against sequence length of de novo designed and natural proteins.
Both RCO and sequence length describe the complexity of a protein (see Methods). This metric quantifies the number of contacts in a protein structure dependent on the sequence separation in order to capture the nonlocality in sequence of those contacts. a, Curated set of structures from computationally designed proteins reported by Verkuil et al. and Woolfson (shown in circles) were compared to the design targets in this paper (shown in crosses). This assessment shows that many of the designed topologies show high contact orders relative to other computationally designed proteins previously reported. Symbols are colored according to b, Comparison with natural folds shows that in general native proteins have higher contact orders then computationally designed proteins.
Extended Data Fig. 4
Extended Data Fig. 4. Sequence and structural conservation analysis of β-barrel (BBF) and TIM-barrel folds (TBF).
a, Cartoon depiction of example BBF design colored by sequence diversity of all designs on an individual residue level. b, Sequence diversity plotted on a per-residue level of all BBF designs. The dotted line represents the mean sequence diversity of the structure. c, Sequence logo of residue occurrence of experimentally validated and folded BBF designs highlighting residue variability at sites critical for maintaining β-barrel topology. d, Cartoon depiction of the crystal structure of TBF_24 colored by backbone RMSD per residue when compared against the target fold (left) and the design model (right), with RMSD per residue values plotted in panel e.
Extended Data Fig. 5
Extended Data Fig. 5. GLF_18 X-ray structure.
a, X-ray structure of GLF_18 (colored) superimposed on the design model (gray). b, X-ray structure of GLF_18 (colored) superimposed on the design model (gray). c, Molecular lipophilicity potential of the surface of the GPCR design target and the soluble GLF_18 design. RMSD - root mean square deviation computed over the Cα atoms of the backbone. RMSDfa - root mean square deviation computed over all the atoms in the structure.
Extended Data Fig. 6
Extended Data Fig. 6. Backbone RMSDs of CLF_4 and RPF_9 crystal structures relative to the target fold and design model.
a, Cartoon representation of the crystal structure of CLF_4, with the left and right models colored by backbone RMSD per residue when compared against the target fold and the design model, respectively. b, RMSD per residue values for both comparisons. In the comparison with the target fold the largest differences are found in the β-sheet region. c, Cartoon representation of the crystal structure of RPF_9, with the left and right structures colored by backbone RMSD per residue when compared against the target fold and the design model, respectively. d, RMSD per residue values for both comparisons. The loop region between residues 35 and 42 was not structurally similar between the RPF_9 design and the target fold, however, the X-ray structure closely matches the designed model.
Extended Data Fig. 7
Extended Data Fig. 7. Sequence and structural conservation analysis of GPCR-like folds (GLF).
a, Cartoon representation of a GLF colored by residue diversity of the in vitro validated folded designs. b, The sequence diversity of all GLF designs is visualized on a per-residue level in the plot, with a dotted line indicating the average sequence diversity across the structure. c, Sequence logo of residues in experimentally validated and folded GLF designs. The natural GLF contained a highly conserved DRY motif in the first intracellular loop (residues 26 to 28) and a PXXY motif (residues 225 to 227) in the seventh helix which are not present in our designs. All other positions depicted contained proline residues in the design target, which have a higher prevalence for some positions but are not required. d, Cartoon depiction of the crystal structure of GLF_18 colored by backbone RMSD per residue when compared against the target fold (left) and the design model (right), with individual values plotted in panel e. f, Depiction of the GLF_32 crystal structure colored by backbone RMSD, with individual values plotted per residue in panel g.
Extended Data Fig. 8
Extended Data Fig. 8. Characterization of the solubilized human Claudin-1 (CLN1) and Claudin-4 (CLN4) presenting functional motifs.
a, Cartoon depiction of design (colored) overlaid on the target fold (gray). b, SEC-MALS analysis of corresponding design in panel a. The expected Mw for the monomeric design ranges from 27.2 to 28.1 kDa. c, CD spectroscopy measurements at different temperatures. d, Thermostability curve based on CD measurements. e, Left, CLN4_20-cCpE-COP2-nanobody complex unsharpened cryoEM map used for model docking colored by local resolution. Middle, Gold-standard FSC curve with resolution cutoff indicated at 0.143. Right, Particle distribution heatmap of the final reconstruction.
Extended Data Fig. 9
Extended Data Fig. 9. Biophysical characterization of the inactive state GLFs containing G-protein binding sites.
a, Cartoon depiction of design (colored) overlaid on the target fold (gray). b, SEC-MALS analysis of corresponding design in panel a. The expected Mw for the monomeric design ranges from 33.3 to 33.7 kDa. c, SPR sensorgram of different MiniGs concentrations in the presence of the designs from panel a.
Extended Data Fig. 10
Extended Data Fig. 10. Biophysical characterization of the active state GLFs containing G-protein binding sites.
a, Cartoon depiction of design (colored) overlaid on the target fold (gray). The point mutants of the aGLF (orange) show a zoom with the point mutation (red) in the presence of mini-gs (green). b, SEC-MALS analysis of corresponding design in panel a. The expected Mw for the monomeric design ranges from 33.1 to 34.1 kDa. c, SPR sensorgram of different MiniGs concentrations in the presence of the designs from panel a.

Update of

References

    1. Listov, D., Goverde, C. A., Correia, B. E. & Fleishman, S. J. Opportunities and challenges in design and optimization of protein function. Nat. Rev. Mol. Cell Biol.10.1038/s41580-024-00718-y (2024). - PMC - PubMed
    1. Katritch, V., Cherezov, V. & Stevens, R. C. Structure-function of the G protein-coupled receptor superfamily. Annu. Rev. Pharmacol.53, 531–556 (2013). - PMC - PubMed
    1. Leman, J. K. et al. Macromolecular modeling and design in Rosetta: recent methods and frameworks. Nat. Methods17, 665–680 (2020). - PMC - PubMed
    1. Jumper, J. et al. Highly accurate protein structure prediction with AlphaFold. Nature596, 583–589 (2021). - PMC - PubMed
    1. Huang, B. et al. A backbone-centred energy function of neural networks for protein design. Nature602, 523–528 (2022). - PubMed

LinkOut - more resources