. 2024 Jun 19;23(1):125.
doi: 10.1186/s12939-024-02212-5.

Global, regional, and national health inequalities of Alzheimer's disease and Parkinson's disease in 204 countries, 1990-2019

Affiliations

Global, regional, and national health inequalities of Alzheimer's disease and Parkinson's disease in 204 countries, 1990-2019

Zixiang Ji et al. Int J Equity Health. .

Abstract

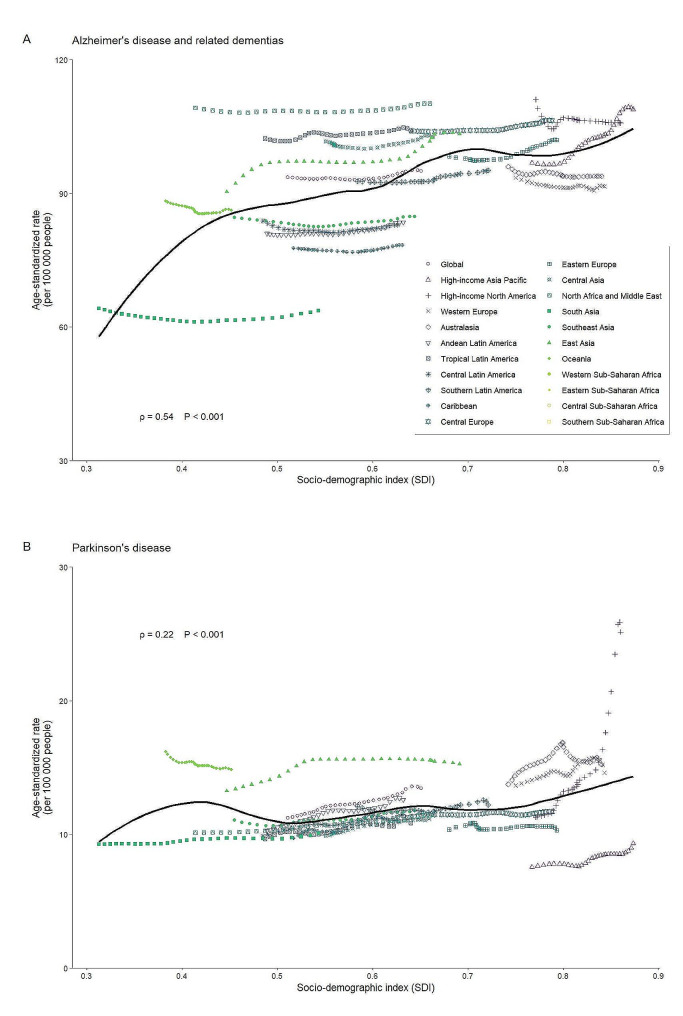
Background: Alzheimer's disease and related dementias (ADRD) and Parkinson's disease (PD), pose growing global health challenges. Socio-demographic and economic development acts paradoxically, complicating the process that determines how governments worldwide designate policies and allocate resources for healthcare.

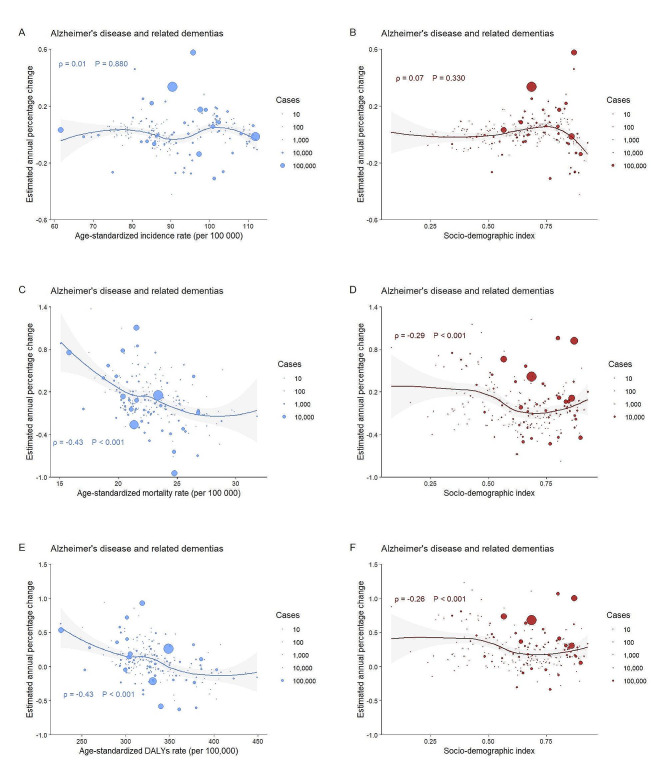
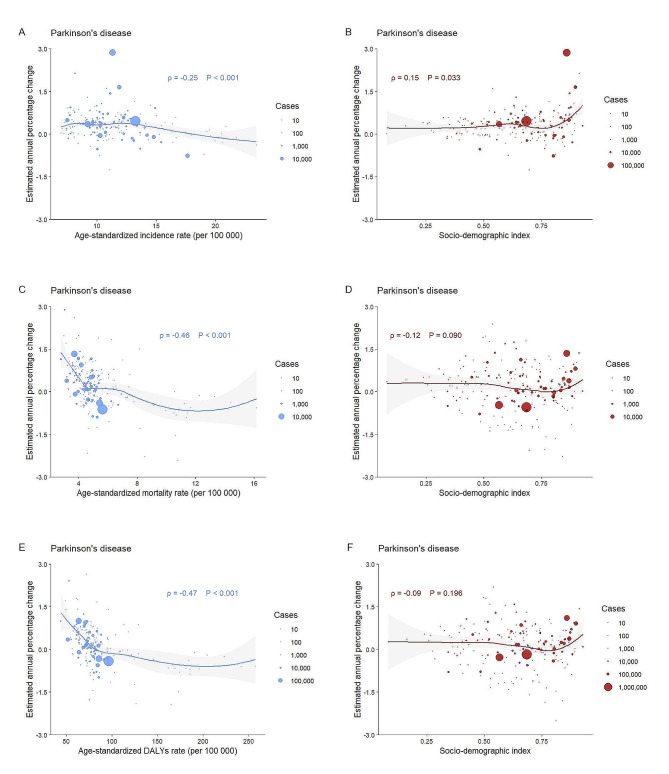
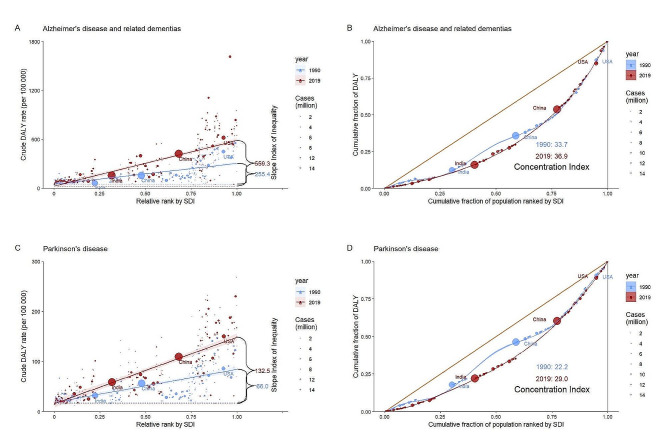
Methods: We extracted data on ADRD and PD in 204 countries from the Global Burden of Disease 2019 database. Health disparities were estimated using the slope index of inequality (SII), and concentration index (CIX) based on the socio-demographic index. Estimated annual percentage changes (EAPCs) were employed to evaluate temporal trends.

Results: Globally, the SII increased from 255.4 [95% confidence interval (CI), 215.2 to 295.5)] in 1990 to 559.3 (95% CI, 497.2 to 621.3) in 2019 for ADRD, and grew from 66.0 (95% CI, 54.9 to 77.2) in 1990 to 132.5 (95% CI, 118.1 to 147.0) in 2019 for PD; CIX rose from 33.7 (95% CI, 25.8 to 41.6) in 1990 to 36.9 (95% CI, 27.8 to 46.1) in 2019 for ADRD, and expanded from 22.2 (95% CI, 21.3 to 23.0) in 1990 to 29.0 (95% CI, 27.8 to 30.3) in 2019 for PD. Age-standardized disability-adjusted life years displayed considerable upward trends for ADRD [EAPC = 0.43 (95% CI, 0.27 to 0.59)] and PD [0.34 (95% CI, 0.29 to 0.38)].

Conclusions: Globally, the burden of ADRD and PD continues to increase with growing health disparities. Variations in health inequalities and the impact of socioeconomic development on disease trends underscored the need for targeted policies and strategies, with heightened awareness, preventive measures, and active management of risk factors.

Keywords: “Alzheimer Disease/epidemiology“[Mesh]; “Disability-Adjusted Life Years /trends“[Mesh]; “Global Burden of Disease/trends“[Mesh]; “Health Inequities“[Mesh]; “Incidence/trends“[Mesh]; “Parkinson Disease/epidemiology“[Mesh]; “Prevalence/trends“[Mesh].


Conflict of interest statement

None reported.

Figures

Fig. 1
Fig. 1
The global maps for age-standardized rates per 100,000 people of incidence, deaths, and DALYs in 2019 for Alzheimer’s disease and related dementias and Parkinson’s disease Abbreviations: DALYs, disability-adjusted life-years; Figures A, B, and C represent age-standardized rates of incidence, deaths, and disability-adjusted life years for Alzheimer’s disease and related dementias, and Figures D, E, and F represent age-standardized rates of incidence, deaths, and disability-adjusted life years for Parkinson’s disease Darker colors in the figures indicate higher age-standardized rates
Fig. 2
Fig. 2
Association between age-standardized incidence rates and socio-demographic index for Alzheimer’s disease and related dementias and Parkinson’s disease The black solid curves coordinate with the overall trend in age-standardized incidence rates, with Pearson correlation coefficients (ρ index) and P values indicating the magnitude and statistical significance of the correlation
Fig. 3
Fig. 3
Association between age-standardized rates, socio-demographic index and estimated annual percentage changes, individually, for Alzheimer’s disease and related dementias Circles represent the cases of absolute incidence, deaths, and DALYs, the larger the circle the greater the number of cases. EAPCs are 30-year trends in age-standardized incidence, deaths, and disability-adjusted life year rates per 100 000 people. Pearson correlation coefficients (ρ index) and P values indicate the magnitude and statistical significance of the correlation. Figures A and B denote age-standardized rates, socio-demographic index and estimated annual percentage changes for incidence, individually; Figures C and D denote age-standardized rates, socio-demographic index and estimated annual percentage changes for deaths, individually; Figures E and F denote age-standardized rates, socio-demographic index and estimated annual percentage changes for DALYs, individually
Fig. 4
Fig. 4
Association between age-standardized incidence rates, socio-demographic index and estimated annual percentage changes, individually, for Parkinson’s disease Circles represent the cases of absolute incidence, deaths, and DALYs, the larger the circle the greater the number of cases. EAPCs are 30-year trends in age-standardized incidence, deaths, and disability-adjusted life year rates per 100 000 people. Pearson correlation coefficients (ρ index) and P values indicate the magnitude and statistical significance of the correlation. Figures A and B denote age-standardized rates, socio-demographic index and estimated annual percentage changes for incidence, individually; Figures C and D denote age-standardized rates, socio-demographic index and estimated annual percentage changes for deaths, individually; Figures E and F denote age-standardized rates, socio-demographic index and estimated annual percentage changes for DALYs, individually
Fig. 5
Fig. 5
Cross-country slope index of inequality and concentration index in 1990 and 2019 for Alzheimer’s disease and related dementias and Parkinson’s disease among the whole population Circles represent the cases of absolute incidence, deaths, and DALYs, the larger the circle the greater the number of cases. Red lines and circles represent data for 2019, while the blue ones indicate data for 1990. Figures A and C denote the slope index of inequality for AD and PD, respectively, and Figures B and D denote the concentration index for AD and PD, respectively

References

    1. Wilson DM, Cookson MR, Van Den Bosch L, Zetterberg H, Holtzman DM, Dewachter I. Hallmarks of neurodegenerative diseases. Cell. 2023;186:693–714. doi: 10.1016/j.cell.2022.12.032. - DOI - PubMed
    1. Cox D, Raeburn C, Sui X, Hatters DM. Protein aggregation in cell biology: an aggregomics perspective of health and disease. Semin Cell Dev Biol. 2020;99:40–54. doi: 10.1016/j.semcdb.2018.05.003. - DOI - PubMed
    1. Pan Y, Nicolazzo JA. Impact of aging, Alzheimer’s disease and Parkinson’s disease on the blood-brain barrier transport of therapeutics. Adv Drug Deliv Rev. 2018;135:62–74. doi: 10.1016/j.addr.2018.04.009. - DOI - PubMed
    1. Global burden Of 369 diseases and injuries in 204 countries and territories, 1990–2019: a systematic analysis for the global burden of Disease Study 2019. Lancet. 2020;396:1204–22. doi: 10.1016/S0140-6736(20)30925-9. - DOI - PMC - PubMed
    1. Ding C, Wu Y, Chen X, Chen Y, Wu Z, Lin Z, Kang D, Fang W, Chen F. Global, regional, and national burden and attributable risk factors of neurological disorders: The Global Burden of Disease study 1990–2019. Front Public Health. 2022;10:952161. doi: 10.3389/fpubh.2022.952161. - DOI - PMC - PubMed