. 2024 Jun 19;25(1):161.
doi: 10.1186/s13059-024-03309-4.

An integrated single-cell RNA-seq map of human neuroblastoma tumors and preclinical models uncovers divergent mesenchymal-like gene expression programs

Affiliations

An integrated single-cell RNA-seq map of human neuroblastoma tumors and preclinical models uncovers divergent mesenchymal-like gene expression programs

Richard H Chapple et al. Genome Biol. .

Abstract

Background: Neuroblastoma is a common pediatric cancer, where preclinical studies suggest that a mesenchymal-like gene expression program contributes to chemotherapy resistance. However, clinical outcomes remain poor, implying we need a better understanding of the relationship between patient tumor heterogeneity and preclinical models.

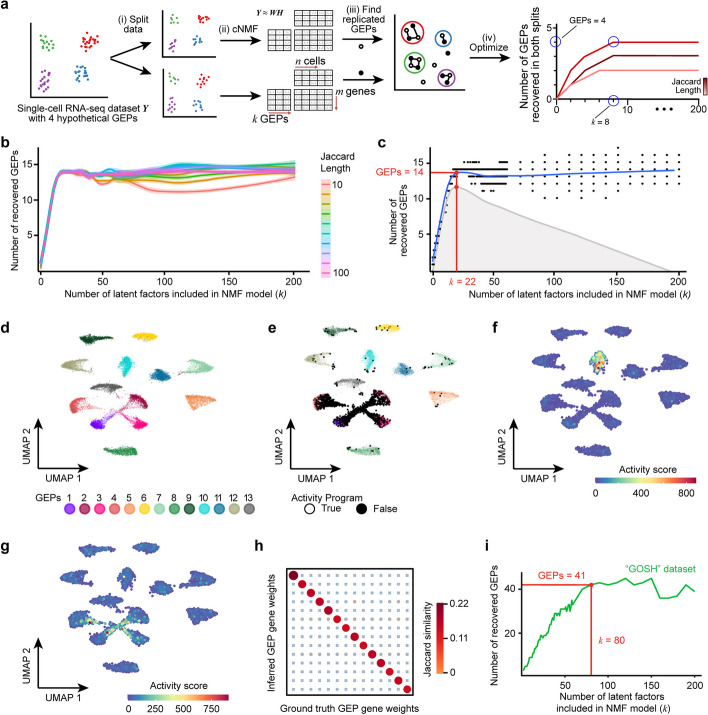
Results: Here, we generate single-cell RNA-seq maps of neuroblastoma cell lines, patient-derived xenograft models (PDX), and a genetically engineered mouse model (GEMM). We develop an unsupervised machine learning approach ("automatic consensus nonnegative matrix factorization" (acNMF)) to compare the gene expression programs found in preclinical models to a large cohort of patient tumors. We confirm a weakly expressed, mesenchymal-like program in otherwise adrenergic cancer cells in some pre-treated high-risk patient tumors, but this appears distinct from the presumptive drug-resistance mesenchymal programs evident in cell lines. Surprisingly, however, this weak-mesenchymal-like program is maintained in PDX and could be chemotherapy-induced in our GEMM after only 24 h, suggesting an uncharacterized therapy-escape mechanism.

Conclusions: Collectively, our findings improve the understanding of how neuroblastoma patient tumor heterogeneity is reflected in preclinical models, provides a comprehensive integrated resource, and a generalizable set of computational methodologies for the joint analysis of clinical and pre-clinical single-cell RNA-seq datasets.


Conflict of interest statement

The authors declare that they have no competing interests.

Figures

Fig. 1
Fig. 1
Overview of acNMF methodology and performance in simulated data. a Schematic representation of acNMF approach for recovering gene expression programs in a single-cell RNA-seq dataset denoted Y. The dataset is (i) randomly split 50/50, then (ii) each split is factorized independently into a basis matrix of gene expression programs (GEPs) W and a GEP activity matrix H using cNMF at a range of values of k (e.g., 5–200). At each k the redundant GEPs from each split are (iii) reaggregated by a community detection algorithm. This community number is then (iv) determined for a range of values of k and a range of Jaccard length values, parameters which are chosen to maximize the number of GEP communities replicated in each split. Critically, the number of ground truth GEPs is typically smaller than the value of k (GEPs < k, hypothetical example highlighted in blue). b The number of GEPs reproducibly recovered in both splits of the simulated dataset (y-axis) plotted against the value of k from NMF (x-axis), over a range of values of the Jaccard length (color scale). The approach is repeated 200 times for each pair of values of k and Jaccard length and a loess regression curve is fit through these points, with 95% confidence intervals shown. c Optimal rank k (x-axis) is determined by calculating the inflection point (i.e., maximum residual value (gray profile)) of smoothed data in b (blue line). d UMAP plot of simulated scRNA-seq data, where each dot is a cell colored by the thirteen ground-truth simulated cell types. e Like d, but with black dots highlighting cells expressing the activity program, which (akin to a biological process/pathway) is expressed across multiple simulated cell types. f UMAP plot showing a representative example of a recovered ground truth cell identity GEP by acNMF in the simulated single-cell RNA-seq dataset. Dots are colored by the activity score of the recovered gene expression program. g Like f but showing the successful recovery of the activity program. Similar plots for all other recovered programs are shown in Additional file 1: Fig. S1e–r. h Dot plot comparing Jaccard similarity index values of 14 inferred acNMF GEPs with the 14 ground truth GEPs after multiple testing correction (blue X’s represent non-significant comparisons). Both the size and color of the points are scaled by Jaccard similarity. i Like b, but for the GOSH dataset. Data shown for a Jaccard length of 20, which was optimized using acNMF. 41 GEPs were reproducibly recovered in independent splits of the data, at a k = 80 (highlighted by the red lines). Similar plots for all datasets in this paper are shown in Additional file 1: Fig. S1t. GEP; Gene expression program
Fig. 2
Fig. 2
Gene expression programs recovered by acNMF in the GOSH neuroblastoma single-cell RNA-seq dataset. a Heatmap showing the activity scores (color scale) for the 41 recovered programs (y-axis) across each single cell (x-axis) in the GOSH dataset. The final consensus annotation for each gene expression program is shown on the right, colored by the type of program. Tick marks indicate whether the two blinded annotators agreed or not, and the far-right column indicates whether the annotators reached a high, middle, or low level of confidence in the final annotation
Fig. 3
Fig. 3
Cells expressing multiple adrenergic and mesenchymal-like gene expression programs are evident in neuroblastoma tumors. a Boxplots showing the mean expression (y-axis) of the genes from the classical Van Groningen mesenchymal (MES; orange box) or adrenergic (ADRM; purple box) signature, in cells that are highly expressing (activity h > 50) the acNMF-identified “Adrenergic I (sympathoblast-like)” program in the GOSH dataset. The yellow box shows the mean expression of all other genes in these cells. b Like a but for the “Adrenergic II (pre-neuronal-like)” program. c Like a but for the “Neuroblastoma-MYC” program. d Boxplots showing the mean gene expression (y-axis) of sympathoblast marker genes (curated from Kameneva et al.) in cells highly expressing (activity h > 50) each of the 3 acNMF recovered adrenergic programs, or in normal sympathoblasts (obtained from the Descartes Cell Atlas). e QQ-plot showing the gene weights (loading scores) (y-axis) for the “Adrenergic I (sympathoblast-like)” program. Key sympathoblast marker genes have been highlighted in green, and key neuronal marker genes in blue. f Like d but for the “Chromaffin and progenitors” marker gene set, curated from Jansky et al. g UMAP plot of the GOSH dataset; each point represents a single-cell, colored by the activity of the “Adrenergic I (sympathoblast-like)” program. h Like e but for the “Adrenergic II (pre-neuronal-like)” program. i Like g but for the “Adrenergic II (pre-neuronal-like)” program. j Boxplot showing the mean gene expression of “Chromaffin and progenitors” marker genes (curated from Jansky et al.) in the cancer cells of the 4 neuroblastoma samples profiled in the GOSH dataset. Boxes are colored by tumor risk classification. k Like j but for the “Neuroblast” marker gene set curated from Hanemaaijer et al. l Representative H&E stains of low, intermediate, and high-risk human neuroblastoma tumors, illustrating varying degrees of differentiated features. m Boxplots showing the mean expression (y-axis) of the genes from the classical Van Groningen mesenchymal (MES; orange box) or adrenergic (ADRM; purple box) signature, in cells that are highly expressing (activity h > 50) the acNMF-identified “Normal fibroblasts” program in the GOSH dataset. The yellow box shows the mean expression of all other genes in these cells. n QQ-plot showing the gene loading scores (y-axis) for the “Normal fibroblasts” program. A subset of genes classically used as markers of mesenchymal-like neuroblastoma cells are highlighted in red. o Like m but for the “IGF1 + myofibroblasts” program. p Like m but for the “POSTN + myofibroblasts” program. q Like m but for the “Inflammatory fibroblasts” program. r A schematic diagram overlaying the acNMF-recovered programs on normal sympathoadrenal differentiation [30]
Fig. 4
Fig. 4
The fidelity of neuroblastoma gene expression programs across human tumors and preclinical models. a A graph of gene expression programs identified by acNMF across eight neuroblastoma single-cell RNA-seq datasets, from humans, PDX, GEMM, and cell lines. Nodes represent a single program’s gene weights (i.e., loading scores), and node size is determined by the degree (i.e., number of connections). Edges connect similar nodes by a Jaccard similarity test. The colors highlight related communities of nodes. The black boxes highlight regions of interest, which are shown in detail in panels bd. Note: unconnected nodes are not included in this figure but can be explored online at http://pscb.stjude.org. b Inset showing a detailed view of region b from panel a. This region has connected adrenergic I and adrenergic II programs. In this inset, nodes have been colored by dataset, rather than community (as in panel a). c Like b but for a dense interconnected community of “Neuroblastoma MYC” programs. d Like b but showing a region for a community of gene expression programs expressed in cancer-associated fibroblasts. A neuroblastoma program, exclusive to the GIMEN cell line, is connected to this community of nodes. e QQ-plot showing the gene weights (loading scores) (y-axis) for the “Adrenergic I (sympathoblast-like)” program recovered in the PMC dataset. Similar to Fig. 3e from the GOSH dataset key sympathoblast marker genes have been highlighted in green, and key neuronal marker genes in blue. f Like e but for the “Adrenergic II (pre-neuronal-like)” program. g Like e but for program 24 “Adrenergic I (sympathoblast-like)” in the Dong et al. dataset. h Like e but for program 19 “Adrenergic II (pre-neuronal-like)” in the Dong et al. dataset. i Like e but showing the “Neuroblastoma MYC” program from Dong et al. Top marker genes, similar to those identified in the GOSH dataset, have been highlighted in red. Note: An interactive version of the graph plot (panel a), and QQ-plots (panels ei) for every program in every dataset are available in our web platform
Fig. 5
Fig. 5
The cancer/normal status of ambiguous mesenchymal-like cells in neuroblastoma tumors. a Violin plots comparing the balanced accuracy (y-axis) for prediction of cancer/normal status of known cancer or immune cells for the 3 different initial models (x-axis) across 13 different tumor samples (shown for both “InferCNV” and “manual” features (see the “Methods” section)). GLM, generalized linear model; RF, random forest; SVM, support vector machine. b Boxplots showing the predicted probability of each cell being a cancer cell from the GLM model (y-axis) for the ambiguous-mesenchymal cells (light blue), for high confidence cancer cells held out from the initial model fitting (green), and for normal endothelial cells held out from the initial model fitting (dark blue). The predictions are shown for models using features defined based on InferCNV (left 3 boxes) or from manual bins of 50 adjacent genes (right 3 boxes). The contingency tables (right panels) estimate whether the number of mesenchymal-like cells classified as cancer cells differs statistically from the misclassification rate of normal endothelial cells, calculated by Fisher’s exact test. This panel shows a representative sample PD46693 from the GOSH dataset. c Like b but for the Dong sample T200, all other samples are in Additional file 1: Fig. S5 and 8. d QQ-plot showing the Jaccard Similarity (y-axis) of other programs with Program #37 (Myofibroblastic CAF) in our GEMM dataset. e Representative RNA ISH image of CAF markers in GEMM tumors. Neuroblastoma markers (human MYCN, and Ddc) were used to define cancer cells. DAPI counterstaining confirmed the presence of cells located in regions that lack MYCN expression. The co-expression of CAF markers was identified within the MYCN-absent stromal regions (NB831 shown). f H&E staining of mouse tumors identifies regions of densely packed dark-stained neuroblastoma cells, and pink-staining stromal cells in our GEMM, which resemble the MYCN-absent regions of mesenchymal marker expression in our RNA ISH experiments. g Bar plot showing the co-expression of CAF markers in GEMM tumors (y-axis). All combinations of CAF marker expression were quantified in stromal cells (x-axis), and they are represented as proportions of the total cell numbers identified in each sample. h Representative image of GEMM tumors stained with MYCN and the Schwann cell marker Plp1 in NB839. Plp1 expression was restricted to MYCN-absent regions in these tumors. i Boxplot showing the mean expression (y-axis) of genes in neuroblastoma cancer cells from the sample NB14 from Jansky et al. [19]. Boxes are genes from the classical Van Groningen mesenchymal (MES; orange box) or adrenergic (ADRN; purple box) signatures, with the yellow box showing the expression of all other genes. The middle panel shows our PDX sample SJNBL063820 and the right panel shows the predominantly mesenchymal neuroblastoma cell line GIMEN. j Immunohistochemical staining for the mesenchymal-marker gene COL1A1 in our SJNBL063820 PDX sample (#1, left) and in two other PDX samples SJNBL046145 (#2, middle) and SJNBL047443 (#3, right). The upper panel shows a UMAP plot colored by the expression of COL1A1 in our PDX cohort, with the numbers indicating the UMAP clusters corresponding to the 3 stained PDX samples
Fig. 6
Fig. 6
An acute chemotherapy-treated neuroblastoma genetic mouse model strongly overexpresses a mesenchymal-like program in cancer cells. a UMAP plot of single-cell RNA-seq data obtained from the tumors of all 11 mice. Each point represents a single cell, colored by whether it was obtained from a cisplatin-treated or a vehicle-treated mouse. Brighter colored chroma indicates cisplatin-treated animals. b Heatmap of normalized gene expression values highlighting differentially expressed genes identified using DESeq2. c Dot plot showing GSEA enrichment scores for the top mSigDB “Hallmark” gene sets. Expression in pseudobulk cancer cells was compared between (n = 6) cisplatin-treated mice and (n = 5) vehicle-treated mice. A negative enrichment score implies the gene set was more highly expressed in drug-treated mice. d GSEA plots summarizing key induced and repressed gene sets. The colored tick marks show the rank of the genes in the gene set of interest and the colored curves show the running enrichment score. e Statistical enrichment of Van Groningen mesenchymal (MES) signature (y-axis) in gene expression programs (x-axis) expressed in high-confidence cancer cells in our GEMM. P-values were calculated using a Wilcoxon rank sum test (rank of MES genes vs all other genes). f Boxplot showing the pseudobulk expression in cancer cells from all 11 mice for genes in the Hallmark gene set “MYC targets V1.” Order of samples is NB831, NB837, NB855, NB856, NB864 (vehicle treated, blue); NB839, NB847, NB849, NB853, NB883, and NB887 (cisplatin treated, red). The red line indicates the median of vehicle-treated samples. g Like f but for Hallmark gene set “Epithelial to mesenchymal transition”. h Like f but for the Van Groningen mesenchymal signature (MES) genes. i Like f but for the Hallmark gene set “Apoptosis”. j Like f but for the Van Groningen adrenergic (ADRN) signature. k Boxplots showing the mean expression (y-axis) of the genes from the classical Van Groningen mesenchymal (MES; orange box) or adrenergic (ADRM; purple box) signature, in cells that are highly expressing (activity h > 50) the acNMF-identified program 36, which has characteristics consistent with cancer cells and is expressed primarily in cisplatin-treated mouse NB847. The yellow box shows the mean expression of all other genes in these cells. l UMAP plot showing RNA-velocity analysis of mouse NB853. The cellular trajectory, inferred from splicing dynamics, shown by the arrows, is consistent with cancer cells actively transitioning to a mesenchymal state, which is marked by the expression of the mesenchymal-cancer Program 39 (color scale). m Detailed view of the box in l. n Like l but for the sample NB847 and mesenchymal Program 36. o Representative RNA ISH images for co-localization of Twist1 with human MYCN in vehicle-treated (top panels, NB855) and drug-treated samples (bottom panels, NB887). p Bar plot showing the percentage of Twist1+ cells in each of our sampled mouse slides (y-axis), quantified using the HALO software. (*, P < 0.05 by t-test, error bars represent SEM). q Bar plot showing the percentage of Twist1+ cells (y-axis) in either vehicle-treated or cisplatin-treated tumors that do or do not co-express MYCN (colors). (*, P < 0.05; **, P < 0.01 by t-test). r Schematic representation of the distinct mesenchymal-like gene expression programs that can be identified across neuroblastoma datasets and preclinical models. These programs have a varying statistical resemblance to the classical cell line derived Van Groningen mesenchymal signature (MES), but despite this, may capture qualitatively different aspects of neuroblastoma cell biology

Update of

References

    1. Johnsen JI, Dyberg C, Wickström M. Neuroblastoma—a neural crest derived embryonal malignancy. Front Mol Neurosci. 2019;12:9. - PMC - PubMed
    1. Armstrong GT, et al. Reduction in late mortality among 5-year survivors of childhood cancer. N Engl J Med. 2016;374:833–842. - PMC - PubMed
    1. Moreno L, et al. Accelerating drug development for neuroblastoma: summary of the second neuroblastoma drug development strategy forum from innovative therapies for children with cancer and International Society of Paediatric Oncology Europe Neuroblastoma. Eur J Cancer. 2020;136:52–68. - PubMed
    1. Ma X, et al. Pan-cancer genome and transcriptome analyses of 1,699 paediatric leukaemias and solid tumours. Nature. 2018;555:371–376. - PMC - PubMed
    1. Oren Y, et al. Cycling cancer persister cells arise from lineages with distinct programs. Nature. 2021;596:576–582. - PMC - PubMed

Publication types