

Identification of novel therapeutic targets for chronic kidney disease and kidney function by integrating multi-omics proteome with transcriptome
- PMID: 38898508
- PMCID: PMC11186236
- DOI: 10.1186/s13073-024-01356-x
Identification of novel therapeutic targets for chronic kidney disease and kidney function by integrating multi-omics proteome with transcriptome
Abstract
Background: Chronic kidney disease (CKD) is a progressive disease for which there is no effective cure. We aimed to identify potential drug targets for CKD and kidney function by integrating plasma proteome and transcriptome.
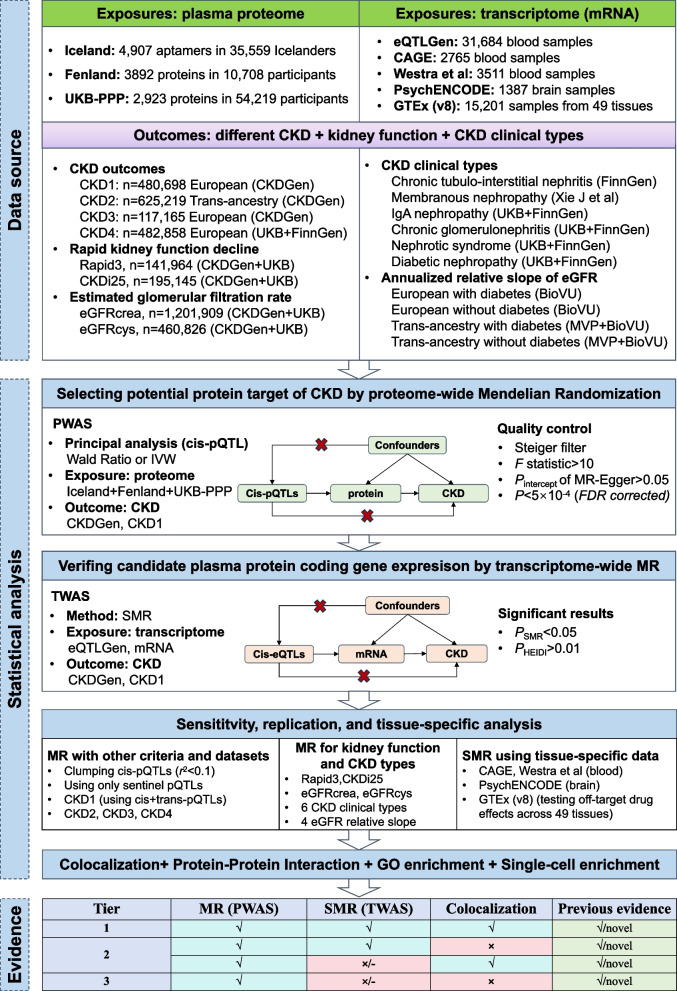
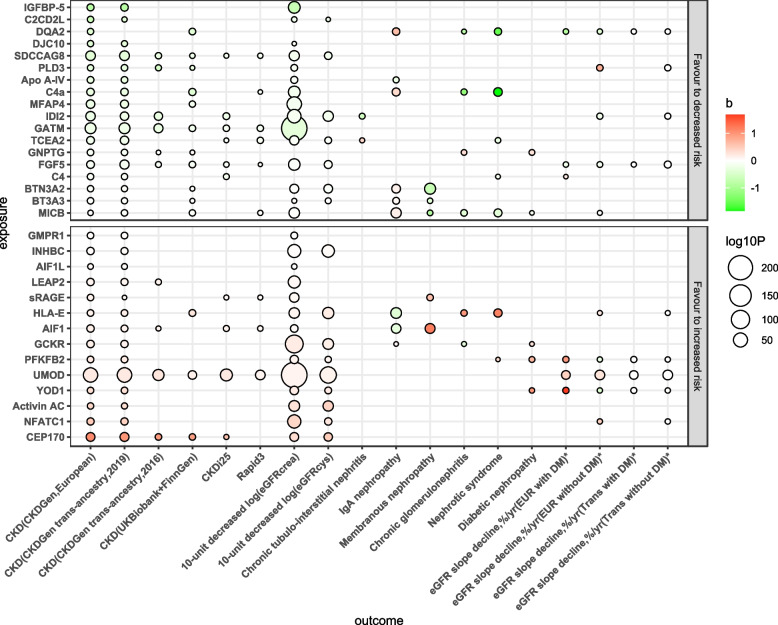
Methods: We designed a comprehensive analysis pipeline involving two-sample Mendelian randomization (MR) (for proteins), summary-based MR (SMR) (for mRNA), and colocalization (for coding genes) to identify potential multi-omics biomarkers for CKD and combined the protein-protein interaction, Gene Ontology (GO), and single-cell annotation to explore the potential biological roles. The outcomes included CKD, extensive kidney function phenotypes, and different CKD clinical types (IgA nephropathy, chronic glomerulonephritis, chronic tubulointerstitial nephritis, membranous nephropathy, nephrotic syndrome, and diabetic nephropathy).
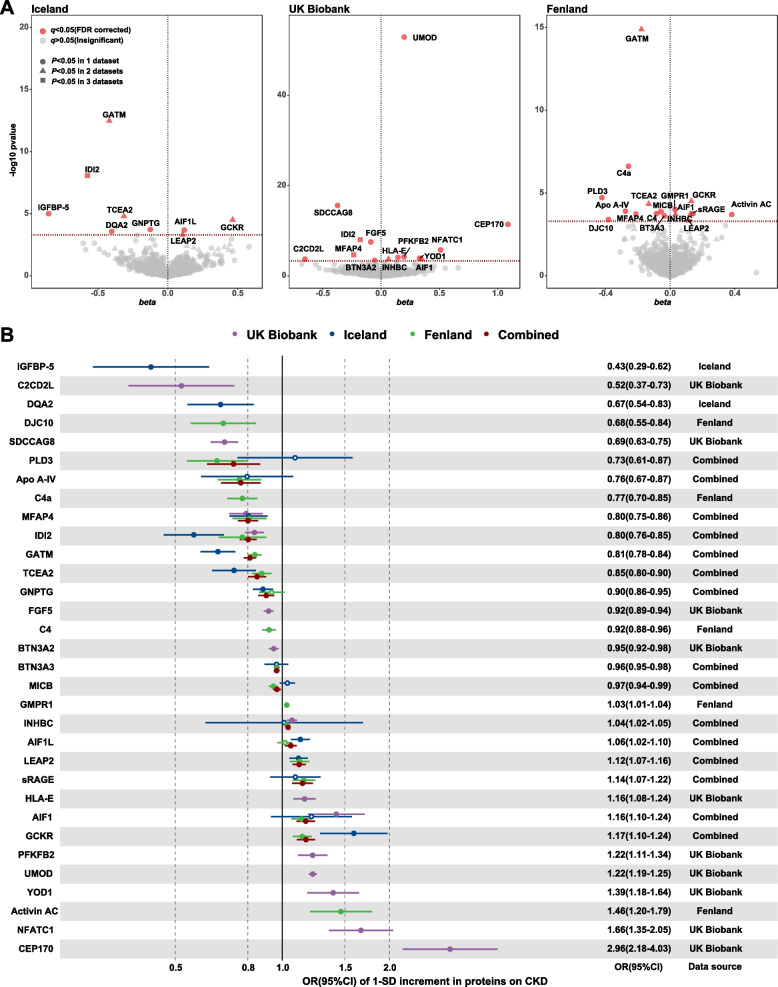
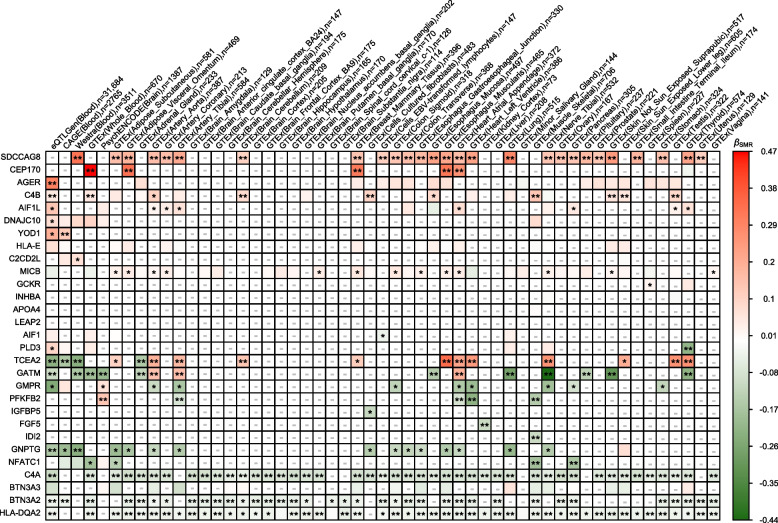
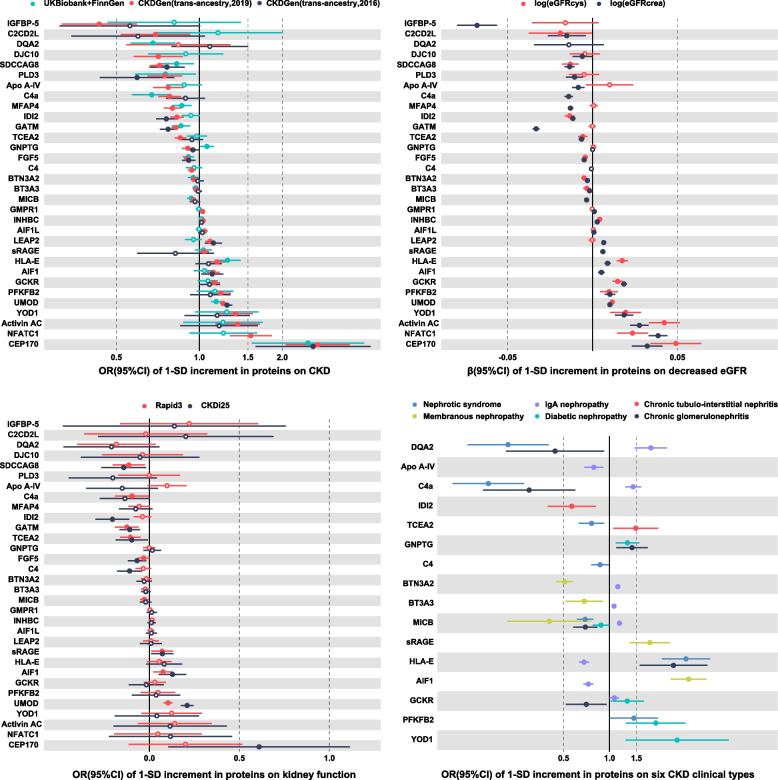
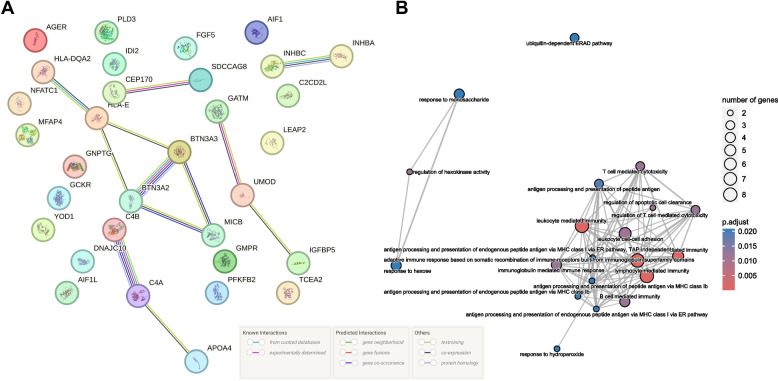
Results: Leveraging pQTLs of 3032 proteins from 3 large-scale GWASs and corresponding blood- and tissue-specific eQTLs, we identified 32 proteins associated with CKD, which were validated across diverse CKD datasets, kidney function indicators, and clinical types. Notably, 12 proteins with prior MR support, including fibroblast growth factor 5 (FGF5), isopentenyl-diphosphate delta-isomerase 2 (IDI2), inhibin beta C chain (INHBC), butyrophilin subfamily 3 member A2 (BTN3A2), BTN3A3, uromodulin (UMOD), complement component 4A (C4a), C4b, centrosomal protein of 170 kDa (CEP170), serologically defined colon cancer antigen 8 (SDCCAG8), MHC class I polypeptide-related sequence B (MICB), and liver-expressed antimicrobial peptide 2 (LEAP2), were confirmed. To our knowledge, 20 novel causal proteins have not been previously reported. Five novel proteins, namely, GCKR (OR 1.17, 95% CI 1.10-1.24), IGFBP-5 (OR 0.43, 95% CI 0.29-0.62), sRAGE (OR 1.14, 95% CI 1.07-1.22), GNPTG (OR 0.90, 95% CI 0.86-0.95), and YOD1 (OR 1.39, 95% CI 1.18-1.64,) passed the MR, SMR, and colocalization analysis. The other 15 proteins were also candidate targets (GATM, AIF1L, DQA2, PFKFB2, NFATC1, activin AC, Apo A-IV, MFAP4, DJC10, C2CD2L, TCEA2, HLA-E, PLD3, AIF1, and GMPR1). These proteins interact with each other, and their coding genes were mainly enrichment in immunity-related pathways or presented specificity across tissues, kidney-related tissue cells, and kidney single cells.
Conclusions: Our integrated analysis of plasma proteome and transcriptome data identifies 32 potential therapeutic targets for CKD, kidney function, and specific CKD clinical types, offering potential targets for the development of novel immunotherapies, combination therapies, or targeted interventions.
Keywords: Chronic kidney disease; Kidney function; Mendelian randomization; Proteome; Therapeutic targets; Transcriptome.
© 2024. The Author(s).
Conflict of interest statement
The authors declare that they have no competing interests.
Figures
Similar articles
-
Multi-Omic Analysis Reveals Genetic Determinants and Therapeutic Targets of Chronic Kidney Disease and Kidney Function.Int J Mol Sci. 2024 May 30;25(11):6033. doi: 10.3390/ijms25116033. Int J Mol Sci. 2024. PMID: 38892221 Free PMC article.
-
Multi-omic biomarkers associated with multiple sclerosis: from Mendelian randomization to drug prediction.Sci Rep. 2025 Mar 19;15(1):9421. doi: 10.1038/s41598-025-94303-8. Sci Rep. 2025. PMID: 40108295 Free PMC article.
-
Exploring new drug treatment targets for immune related bone diseases using a multi omics joint analysis strategy.Sci Rep. 2025 Mar 27;15(1):10618. doi: 10.1038/s41598-025-94053-7. Sci Rep. 2025. PMID: 40148470 Free PMC article.
-
The UMOD Locus: Insights into the Pathogenesis and Prognosis of Kidney Disease.J Am Soc Nephrol. 2018 Mar;29(3):713-726. doi: 10.1681/ASN.2017070716. Epub 2017 Nov 27. J Am Soc Nephrol. 2018. PMID: 29180396 Free PMC article. Review.
-
From 'Omics to Multi-omics Technologies: the Discovery of Novel Causal Mediators.Curr Atheroscler Rep. 2023 Feb;25(2):55-65. doi: 10.1007/s11883-022-01078-8. Epub 2023 Jan 3. Curr Atheroscler Rep. 2023. PMID: 36595202 Free PMC article. Review.
Cited by
-
SREBF1, a target gene of multiple sclerosis and coronary heart disease: based on mendelian randomization study.Hereditas. 2025 Feb 14;162(1):22. doi: 10.1186/s41065-025-00388-6. Hereditas. 2025. PMID: 39953634 Free PMC article.
-
Microfibrillar-associated protein 4 as a predictive biomarker of treatment response in patients with chronic inflammatory diseases initiating biologics: secondary analyses based on the prospective BELIEVE cohort study.Rheumatol Int. 2024 Dec;44(12):2935-2947. doi: 10.1007/s00296-024-05744-9. Epub 2024 Oct 28. Rheumatol Int. 2024. PMID: 39465398 Free PMC article.
-
Bioinformatics analysis and experimental validation of potential targets and pathways in chronic kidney disease associated with renal fibrosis.J Transl Med. 2025 Apr 2;23(1):387. doi: 10.1186/s12967-024-06058-x. J Transl Med. 2025. PMID: 40176090 Free PMC article.
-
Lessons from national biobank projects utilizing whole-genome sequencing for population-scale genomics.Genomics Inform. 2025 Mar 6;23(1):8. doi: 10.1186/s44342-025-00040-9. Genomics Inform. 2025. PMID: 40050991 Free PMC article. Review.
-
Identification of potential novel targets for treating inflammatory bowel disease using Mendelian randomization analysis.Int J Colorectal Dis. 2024 Oct 16;39(1):165. doi: 10.1007/s00384-024-04744-2. Int J Colorectal Dis. 2024. PMID: 39414629 Free PMC article.
References
Publication types
MeSH terms
Substances
Grants and funding
LinkOut - more resources
Full Text Sources
Medical
Research Materials
Miscellaneous
