

Mapping and quantifying unique branching structures in lentil (Lens culinaris Medik.)
- PMID: 38898527
- PMCID: PMC11188192
- DOI: 10.1186/s13007-024-01223-1
Mapping and quantifying unique branching structures in lentil (Lens culinaris Medik.)
Abstract
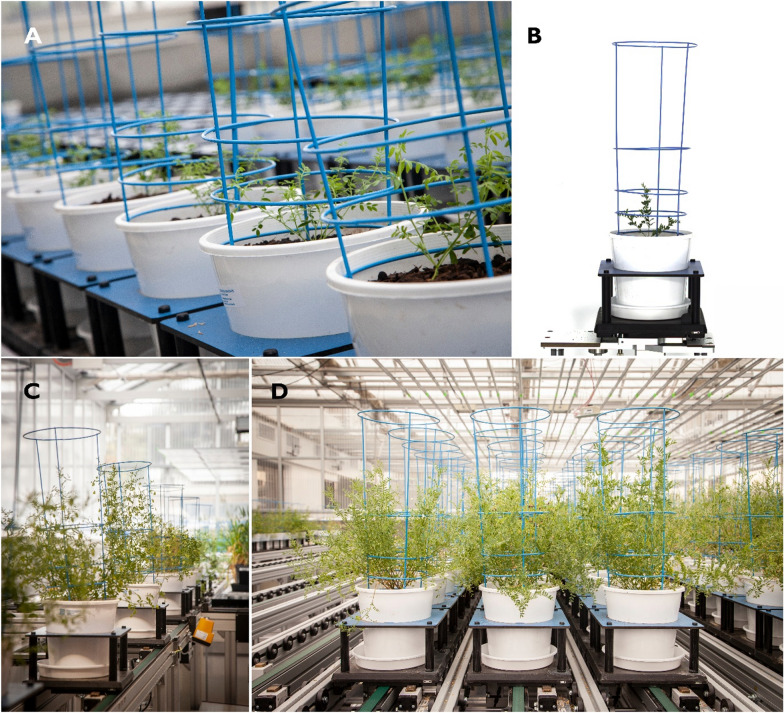
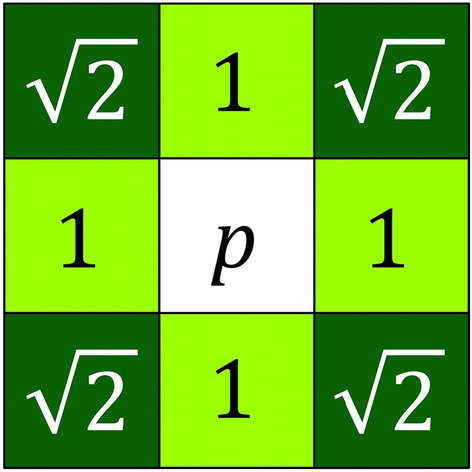
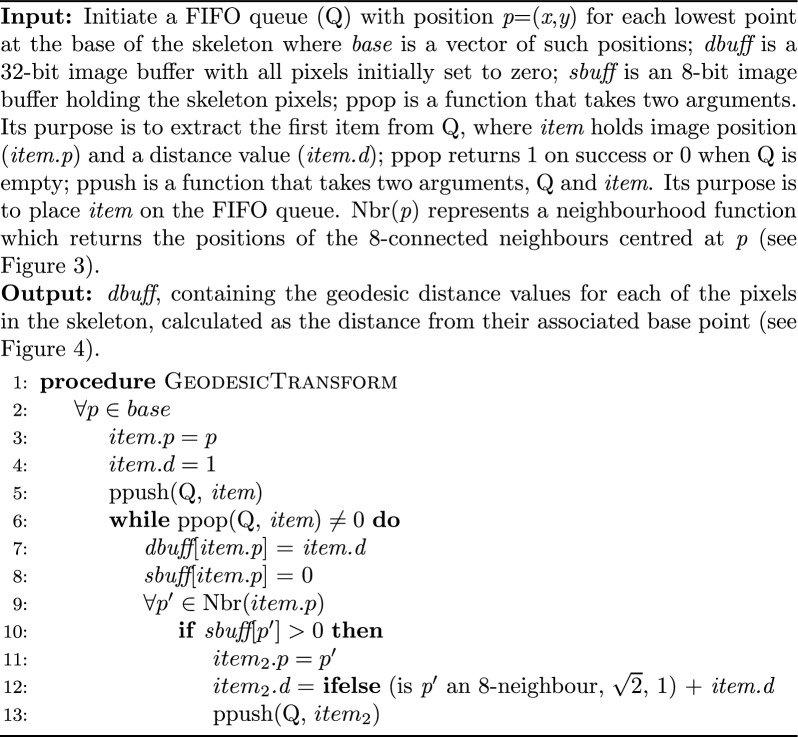
Background: Lentil (Lens culinaris Medik.) is a globally-significant agricultural crop used to feed millions of people. Lentils have been cultivated in the Australian states of Victoria and South Australia for several decades, but efforts are now being made to expand their cultivation into Western Australia and New South Wales. Plant architecture plays a pivotal role in adaptation, leading to improved and stable yields especially in new expansion regions. Image-based high-throughput phenomics technologies provide opportunities for an improved understanding of plant development, architecture, and trait genetics. This paper describes a novel method for mapping and quantifying individual branch structures on immature glasshouse-grown lentil plants grown using a LemnaTec Scanalyser 3D high-throughput phenomics platform, which collected side-view RGB images at regular intervals under controlled photographic conditions throughout the experiment. A queue and distance-based algorithm that analysed morphological skeletons generated from images of lentil plants was developed in Python. This code was incorporated into an image analysis pipeline using open-source software (PlantCV) to measure the number, angle, and length of individual branches on lentil plants.
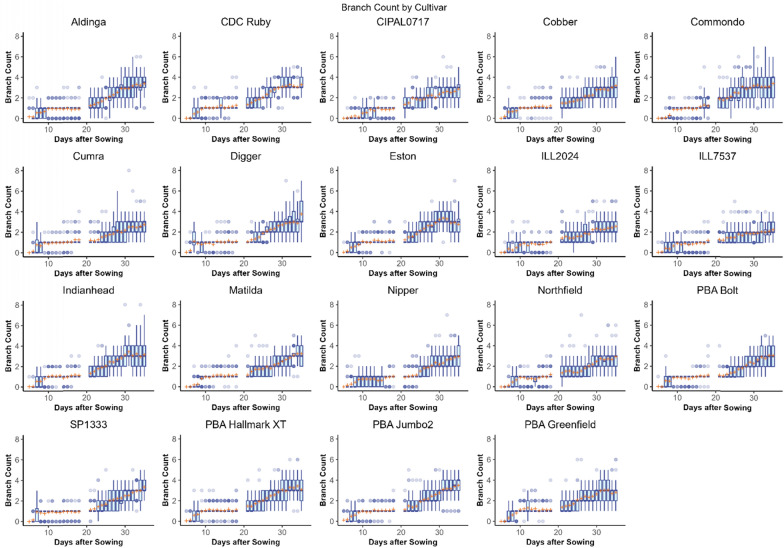
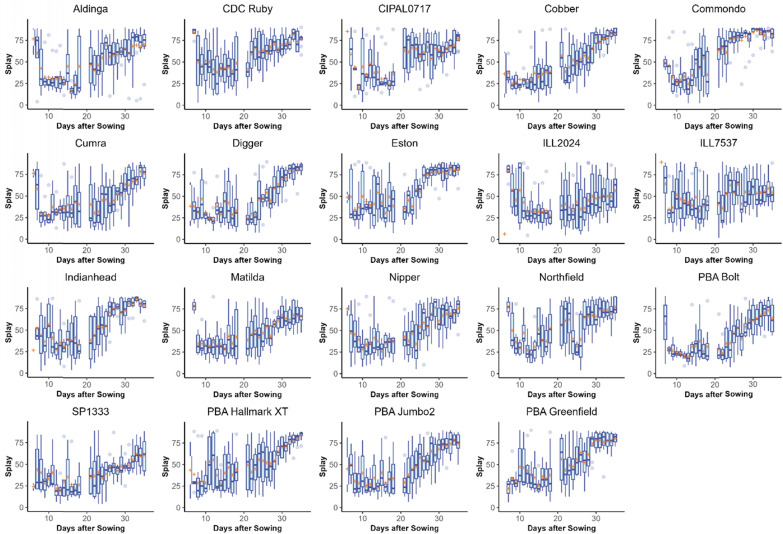
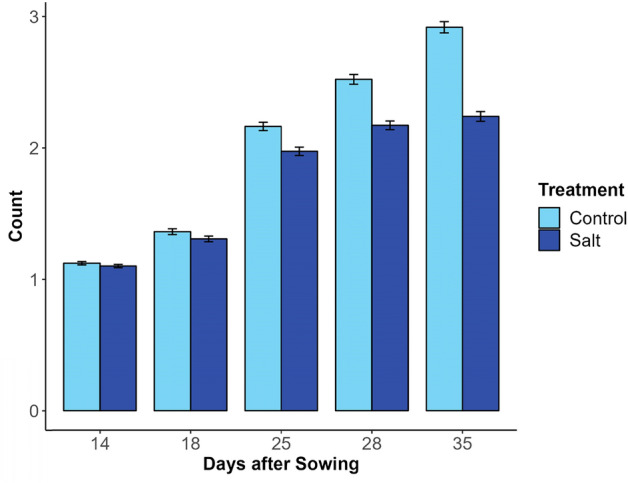
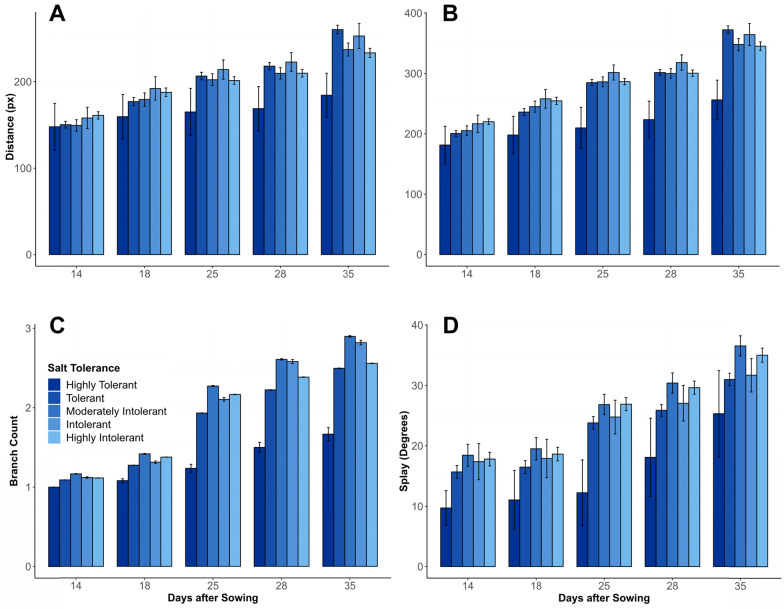
Results: Branching structures could be accurately identified and quantified in immature plants, which is sufficient for calculating early vigour traits, however the accuracy declined as the plants matured. Absolute accuracy for branch counts was 77.9% for plants at 22 days after sowing (DAS), 57.9% at 29 DAS and 51.9% at 36 DAS. Allowing for an error of ± 1 branch, the associated accuracies for the same time periods were 97.6%, 90.8% and 79.2% respectively. Occlusion in more mature plants made the mapping of branches less accurate, but the information collected could still be useful for trait estimation. For branch length calculations, the amount of variance explained by linear mixed-effects models was 82% for geodesic length and 87% for Euclidean branch lengths. Within these models, both the mean geodesic and Euclidean distance measurements of branches were found to be significantly affected by genotype, DAS and their interaction. Two informative metrices were derived from the calculations of branch angle; 'splay' is a measure of how far a branch angle deviates from being fully upright whilst 'angle-difference' is the difference between the smallest and largest recorded branch angle on each plant. The amount of variance explained by linear mixed-effects models was 38% for splay and 50% for angle difference. These lower R2 values are likely due to the inherent difficulties in measuring these parameters, nevertheless both splay and angle difference were found to be significantly affected by cultivar, DAS and their interaction. When 276 diverse lentil genotypes with varying degrees of salt tolerance were grown in a glasshouse-based experiment where a portion were subjected to a salt treatment, the branching algorithm was able to distinguish between salt-treated and untreated lentil lines based on differences in branch counts. Likewise, the mean geodesic and Euclidean distance measurements of branches were both found to be significantly affected by cultivar, DAS and salt treatment. The amount of variance explained by the linear mixed-effects models was 57.8% for geodesic branch length and 46.5% for Euclidean branch length.
Conclusion: The methodology enabled the accurate quantification of the number, angle, and length of individual branches on glasshouse-grown lentil plants. This methodology could be applied to other dicotyledonous species.
Keywords: Image analysis; LemnaTec; Lentil; Morphology; Phenotyping; PlantCV; Python; Structure.
© 2024. The Author(s).
Conflict of interest statement
The authors declare no conflict of interest.
Figures


Similar articles
-
An image dataset of diverse safflower (Carthamus tinctorius L.) genotypes for salt response phenotyping.Data Brief. 2022 Nov 29;46:108787. doi: 10.1016/j.dib.2022.108787. eCollection 2023 Feb. Data Brief. 2022. PMID: 36506801 Free PMC article.
-
Exogenously applied 5-aminolevulinic acid modulates growth, yield, and physiological parameters in lentil (Lens culinaris Medik.) under rain-fed and supplemental irrigation conditions.Sci Rep. 2023 Dec 3;13(1):21312. doi: 10.1038/s41598-023-48732-y. Sci Rep. 2023. PMID: 38042953 Free PMC article.
-
Root Traits, Nodulation and Root Distribution in Soil for Five Wild Lentil Species and Lens culinaris (Medik.) Grown under Well-Watered Conditions.Front Plant Sci. 2017 Sep 25;8:1632. doi: 10.3389/fpls.2017.01632. eCollection 2017. Front Plant Sci. 2017. PMID: 28993782 Free PMC article.
-
Lentil adaptation to drought stress: response, tolerance, and breeding approaches.Front Plant Sci. 2024 Aug 20;15:1403922. doi: 10.3389/fpls.2024.1403922. eCollection 2024. Front Plant Sci. 2024. PMID: 39228838 Free PMC article. Review.
-
Conventional and new-breeding technologies for improving disease resistance in lentil (Lens culinaris Medik).Front Plant Sci. 2023 Jan 20;13:1001682. doi: 10.3389/fpls.2022.1001682. eCollection 2022. Front Plant Sci. 2023. PMID: 36743558 Free PMC article.
References
-
- Food and Agriculture Organisation of the United Nations. FAOSTAT. 2022. https://www.fao.org/faostat/en/. Accessed 1 Mar 2024.
-
- Australian Bureau of Agricultural and Resource Economics and Sciences. Australian crop report data. 2023. https://daff.ent.sirsidynix.net.au/client/en_AU/search/asset/1035301/2.
LinkOut - more resources
Full Text Sources
