. 2024 Aug;15(4):1528-1538.
doi: 10.1002/jcsm.13511. Epub 2024 Jun 19.

Creatinine, cystatin C, muscle mass, and mortality: Findings from a primary and replication population-based cohort

Affiliations

Creatinine, cystatin C, muscle mass, and mortality: Findings from a primary and replication population-based cohort

Dion Groothof et al. J Cachexia Sarcopenia Muscle. 2024 Aug.

Abstract

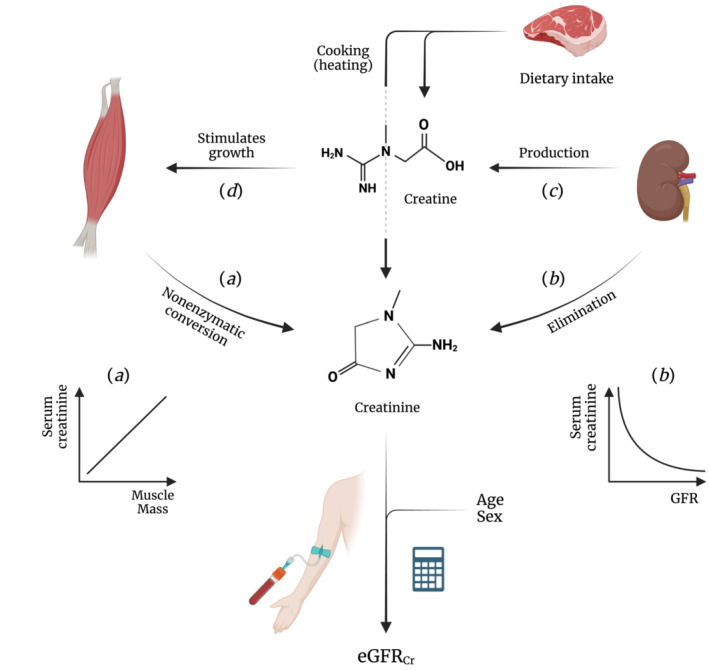
Background: Serum creatinine is used as initial test to derive eGFR and confirmatory testing with serum cystatin C is recommended when creatinine-based eGFR is considered less accurate due to deviant muscle mass. Low muscle mass is associated with increased risk of premature mortality. However, the associations of serum creatinine and cystatin C with muscle mass and mortality remain unclear and require further investigation to better inform clinical decision-making.

Methods: We included 8437 community-dwelling adults enrolled in the Dutch PREVEND study and 5033 in the US NHANES replication cohort. Associations of serum creatinine and/or cystatin C with muscle mass surrogates and mortality were quantified with linear and Cox proportional hazards regression, respectively. Missing observations in covariates were multiply imputed using Substantive Model Compatible Fully Conditional Specification.

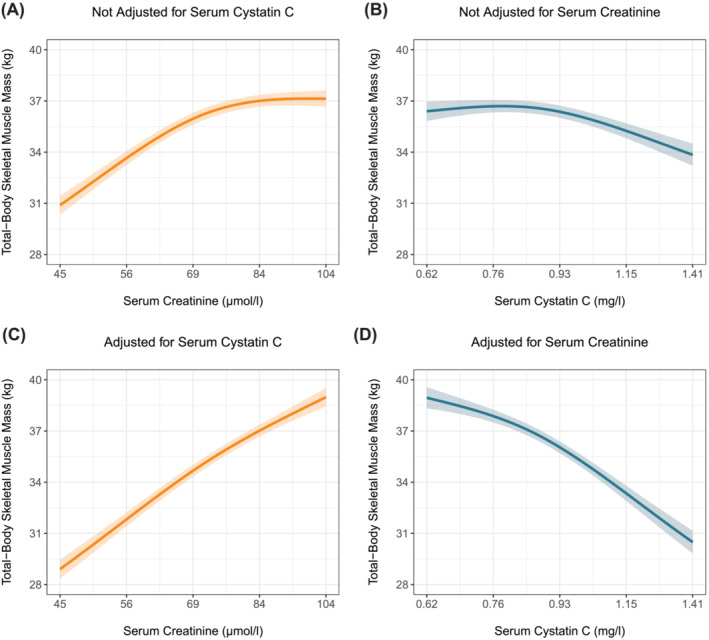
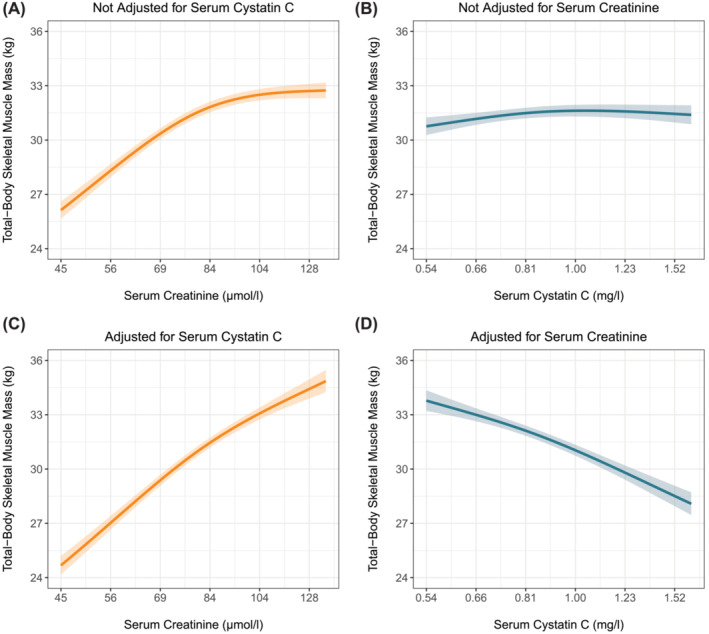
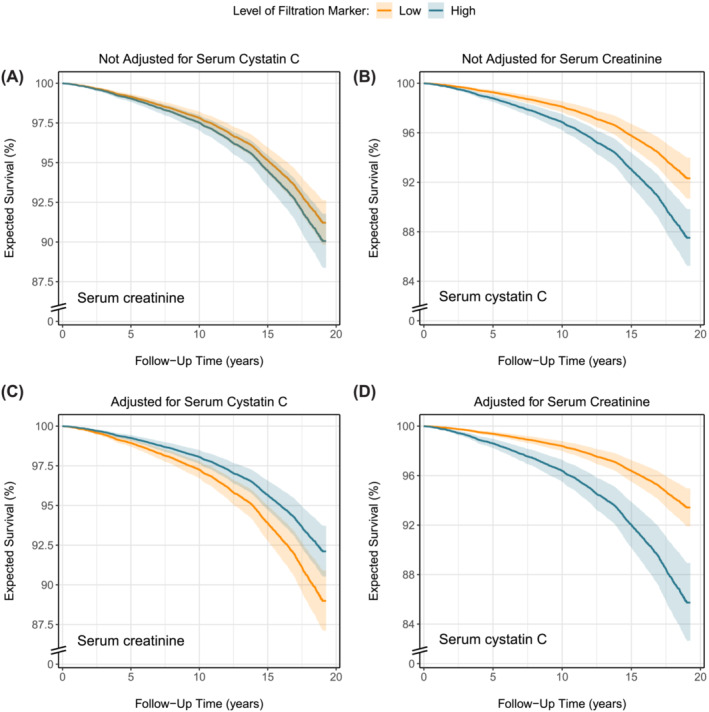
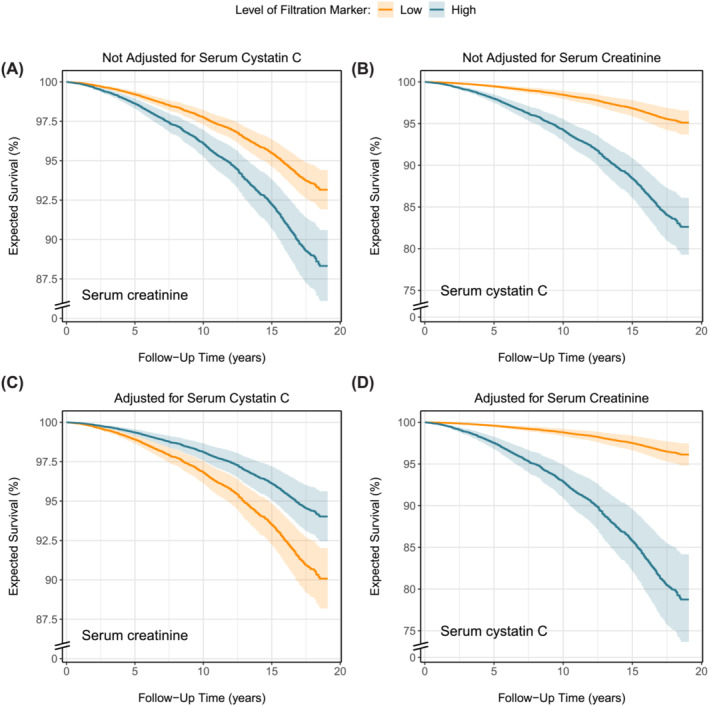
Results: Mean (SD) age of PREVEND and NHANES participants (50% and 48% male) were 49.8 (12.6) and 48.7 (18.7) years, respectively. Median (Q1-Q3) serum creatinine and cystatin C were 71 (61-80) and 80 (62-88) μmol/L and 0.87 (0.78-0.98) and 0.91 (0.80-1.10) mg/L, respectively. Higher serum creatinine was associated with greater muscle mass, while serum cystatin C was not associated with muscle mass. Adjusting both markers for each other strengthened the positive relationship between serum creatinine and muscle mass and revealed an inverse association between serum cystatin C and muscle mass. In the PREVEND cohort, 1636 (19%) deaths were registered over a median follow-up of 12.9 (5.8-16.3) years with a 10-year mortality rate (95% CI) of 7.6% (7.1-8.2%). In the NHANES, 1273 (25%) deaths were registered over a median follow-up of 17.9 (17.3-18.5) years with a 10-year mortality rate of 13.8% (12.8-14.7%). Both markers were associated with increased mortality. Notably, when adjusted for each other, higher serum creatinine was associated with decreased mortality, while the association between serum cystatin C and increased mortality strengthened. The shapes of the associations in the PREVEND study and NHANES were almost identical.

Conclusions: The strong association between serum creatinine and muscle mass challenges its reliability as GFR marker, necessitating a more cautious approach in its clinical use. The minimal association between serum cystatin C and muscle mass supports its increased use as a more reliable alternative in routine clinical practice.

Keywords: Creatinine; Cystatin C; General population; Kidney function; Mortality; Muscle mass.


Conflict of interest statement

The authors declare that they have no conflict of interest.

Figures

Figure 1
Figure 1
Associations of serum creatinine and cystatin C with total‐body skeletal muscle mass with and without adjustment for each other in the primary cohort. Expected total‐body skeletal muscle mass and associated 95% pointwise confidence intervals were derived from linear regression models and were (aside from serum creatinine and/or cystatin C) adjusted for the effects of age, sex, current smoking, alcohol consumption, prevalent malignancy, prevalent type 2 diabetes, history of cardiovascular disease, waist circumference, and urinary albumin excretion.
Figure 2
Figure 2
Associations of serum creatinine and cystatin C with total‐body skeletal muscle mass with and without adjustment for each other in the replication cohort. Expected total‐body skeletal muscle mass and associated 95% pointwise confidence intervals were derived from linear regression models and were (aside from serum creatinine and/or cystatin C) adjusted for the effects of age, sex, current smoking, alcohol consumption, history of malignancy, prevalent type 2 diabetes, history of cardiovascular disease, and waist circumference.
Figure 3
Figure 3
Effects of serum creatinine and cystatin C on the expected probability of survival with and without adjustment for each other in the primary cohort. Expected survival probabilities and associated 95% pointwise confidence intervals were derived from Cox models and were (aside from serum creatinine and/or cystatin C) adjusted for the baseline effects of age, sex, current smoking, alcohol consumption, prevalent malignancy, prevalent type 2 diabetes, history of cardiovascular disease, waist circumference, and urinary albumin excretion. Low and high levels of the filtration markers in the figure legend corresponded to the 2.5th and 97.5th percentile, which were 57 and 112 μmol/L for serum creatinine and 0.67 and 1.35 mg/L for serum cystatin C, respectively.
Figure 4
Figure 4
Effects of serum creatinine and cystatin C on the expected probability of survival with and without adjustment for each other in the replication cohort. Expected survival probabilities and associated 95% pointwise confidence intervals were derived from Cox models and were (aside from serum creatinine and/or cystatin C) adjusted for the baseline effects of age, sex, current smoking, alcohol consumption, history of malignancy, prevalent type 2 diabetes, history of cardiovascular disease, and waist circumference. Low and high levels of the filtration markers in the figure legend corresponded to the 2.5th and 97.5th percentile, which were 62 and 141 μmol/L for serum creatinine and 0.57 and 1.67 mg/L for serum cystatin C, respectively.
Figure 5
Figure 5
Schematic representation of the relationships between kidney function, muscle mass, and serum creatinine. This figure illustrates the complex pathways influencing circulating creatinine levels. Path a depicts the spontaneous, nonenzymatic conversion of creatine and phosphocreatine to creatinine in muscle, establishing a positive relationship between muscle mass and creatinine levels. Path b represents the elimination of creatinine an from the circulation by the kidneys, giving rise to the inverse relationship between GFR and circulating creatinine levels. Path c outlines the role of the kidney in creatine biosynthesis, beginning with the transfer of the amidino group from arginine to glycine to yield L‐ornithine and guanidinoacetate., The amidino group of guanidinoacetate is then methylated in the liver to form creatine (not shown). Path d highlights the role of creatine in stimulating muscle protein synthesis. Both paths c and d reinforce the positive relationship between muscle mass and creatinine levels, highlighting the interconnectedness of kidney function, creatine production, and muscle mass. The calculator symbolizes GFR‐estimating equations that integrate age and sex with circulating creatinine levels to compute eGFRcr, thereby accounting for variability in creatinine related to muscle mass. eGFRcr, creatinine‐based eGFR. Created with BioRender.com

References

    1. Kidney Disease: Improving Global Outcomes (KDIGO) CKD Work Group. KDIGO . Clinical practice guideline for the evaluation and management of chronic kidney disease. Kidney Int Suppl 2012;2013:1–150.
    1. Heymsfield SB, Arteaga C, Mcmanus C, Smith J, Moffltt S. Perspective in nutrition measurement of muscle mass in humans: validity of the 24‐hour urinary creatinine method. Am J Clin Nutr 1983;37:478–494. - PubMed
    1. Stevens LA, Coresh J, Greene T, Levey AS. Assessing kidney function‐measured and estimated glomerular filtration rate. N Engl J Med 2006;354:2473–2483. - PubMed
    1. Inker LA, Eneanya ND, Coresh J, Tighiouart H, Wang D, Sang Y, et al. New creatinine‐ and cystatin C–based equations to estimate GFR without race. N Engl J Med 2021;385:1737–1749. - PMC - PubMed
    1. Wang XH, Mitch WE, Price SR. Pathophysiological mechanisms leading to muscle loss in chronic kidney disease. Nat Rev Nephrol 2022;18:138–152. - PubMed