

Visualizing set relationships: EVenn's comprehensive approach to Venn diagrams
- PMID: 38898979
- PMCID: PMC11183158
- DOI: 10.1002/imt2.184
Visualizing set relationships: EVenn's comprehensive approach to Venn diagrams
Abstract
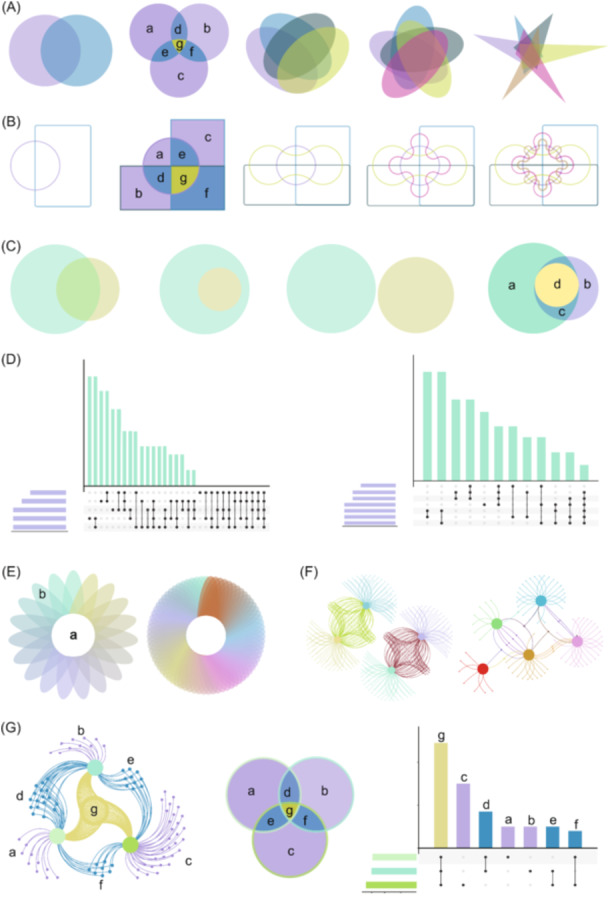
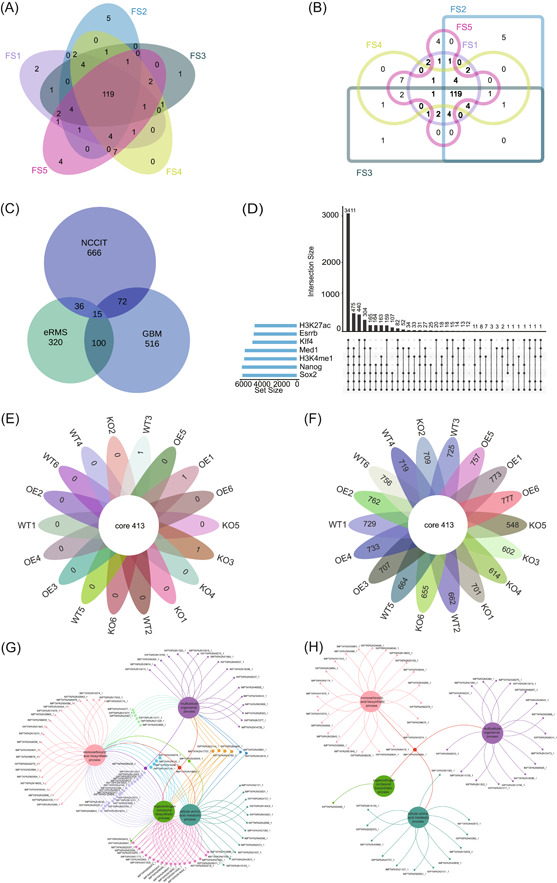
Venn diagrams serve as invaluable tools for visualizing set relationships due to their ease of interpretation. Widely applied across diverse disciplines such as metabolomics, genomics, transcriptomics, and proteomics, their utility is undeniable. However, the operational complexity has been compounded by the absence of standardized data formats and the need to switch between various platforms for generating different Venn diagrams. To address these challenges, we introduce the EVenn platform, a versatile tool offering a unified interface for efficient data exploration and visualization of diverse Venn diagrams. EVenn (http://www.ehbio.com/test/venn) streamlines the data upload process with a standardized format, enhancing the capabilities for multimodule analysis. This comprehensive protocol outlines various applications of EVenn, featuring representative results of multiple Venn diagrams, data uploads in the centralized data center, and step-by-step case demonstrations. Through these functionalities, EVenn emerges as a valuable and user-friendly tool for the in-depth exploration of multiomics data.
Keywords: Euler diagram; UpSet plot; Venn network diagram; flower plot; interactive Venn diagram; multiomics data visualization; standardized data formats.
© 2024 The Authors. iMeta published by John Wiley & Sons Australia, Ltd on behalf of iMeta Science.
Conflict of interest statement
The authors declare no conflict of interest.
Figures
Similar articles
-
Venn diagrams in bioinformatics.Brief Bioinform. 2021 Sep 2;22(5):bbab108. doi: 10.1093/bib/bbab108. Brief Bioinform. 2021. PMID: 33839742 Review.
-
VennDIS: a JavaFX-based Venn and Euler diagram software to generate publication quality figures.Proteomics. 2015 Apr;15(7):1239-44. doi: 10.1002/pmic.201400320. Epub 2015 Jan 23. Proteomics. 2015. PMID: 25545689
-
VennPainter: A Tool for the Comparison and Identification of Candidate Genes Based on Venn Diagrams.PLoS One. 2016 Apr 27;11(4):e0154315. doi: 10.1371/journal.pone.0154315. eCollection 2016. PLoS One. 2016. PMID: 27120465 Free PMC article.
-
VennDiagramWeb: a web application for the generation of highly customizable Venn and Euler diagrams.BMC Bioinformatics. 2016 Oct 3;17(1):401. doi: 10.1186/s12859-016-1281-5. BMC Bioinformatics. 2016. PMID: 27716034 Free PMC article.
-
Beyond the Venn diagram: the hunt for a core microbiome.Environ Microbiol. 2012 Jan;14(1):4-12. doi: 10.1111/j.1462-2920.2011.02585.x. Epub 2011 Oct 18. Environ Microbiol. 2012. PMID: 22004523 Review.
Cited by
-
Wastewater Treatment with Bacterial Representatives of the Thiothrix Morphotype.Int J Mol Sci. 2024 Aug 22;25(16):9093. doi: 10.3390/ijms25169093. Int J Mol Sci. 2024. PMID: 39201777 Free PMC article. Review.
-
Genome-wide survey of the bipartite structure and pathogenesis-related genes of Neostagonosporella sichuanensis, a causal agent of Fishscale bamboo rhombic-spot disease.Front Microbiol. 2024 Sep 18;15:1456993. doi: 10.3389/fmicb.2024.1456993. eCollection 2024. Front Microbiol. 2024. PMID: 39360322 Free PMC article.
-
Unveiling the role of phages in shaping the periodontal microbial ecosystem.mSystems. 2025 Apr 22;10(4):e0020125. doi: 10.1128/msystems.00201-25. Epub 2025 Mar 28. mSystems. 2025. PMID: 40152610 Free PMC article.
-
Identification of a Resistance Exercise-Specific Signaling Pathway that Drives Skeletal Muscle Growth.Res Sq [Preprint]. 2024 Nov 12:rs.3.rs-4997138. doi: 10.21203/rs.3.rs-4997138/v1. Res Sq. 2024. Update in: Nat Metab. 2025 Jul;7(7):1404-1423. doi: 10.1038/s42255-025-01298-7. PMID: 39606434 Free PMC article. Updated. Preprint.
-
TRIB3 mediates vascular calcification by facilitating self-ubiquitination and dissociation of Smurf1 in chronic kidney disease.J Clin Invest. 2025 Apr 1;135(7):e175972. doi: 10.1172/JCI175972. J Clin Invest. 2025. PMID: 39932798 Free PMC article.
References
-
- Ichihashi Yasunori, Date Yasuhiro, Shino Amiu, Shimizu Tomoko, Shibata Arisa, Kumaishi Kie, Funahashi Fumiaki et al. 2020. “Multi‐Omics Analysis on an Agroecosystem Reveals the Significant Role of Organic Nitrogen to Increase Agricultural Crop Yield.” Proceedings of the National Academy of Sciences of the United States of America 117(25): 14552–14560 10.1073/pnas.1917259117 - DOI - PMC - PubMed
-
- Liang, Xinxiu , Miao Zelei, Lu Sha, Ye Meng, Wang Jiali, Zhao Hui, CongmeiXiao , et al. 2023. “Integration of Multiomics with Precision Nutrition for Gestational Diabetes: Study Protocol for the Westlake Precision Birth Cohort.” iMeta 2: e96. 10.1002/imt2.96 - DOI
LinkOut - more resources
Full Text Sources