

Vaginal microbiota are associated with in vitro fertilization during female infertility
- PMID: 38898981
- PMCID: PMC11183179
- DOI: 10.1002/imt2.185
Vaginal microbiota are associated with in vitro fertilization during female infertility
Abstract
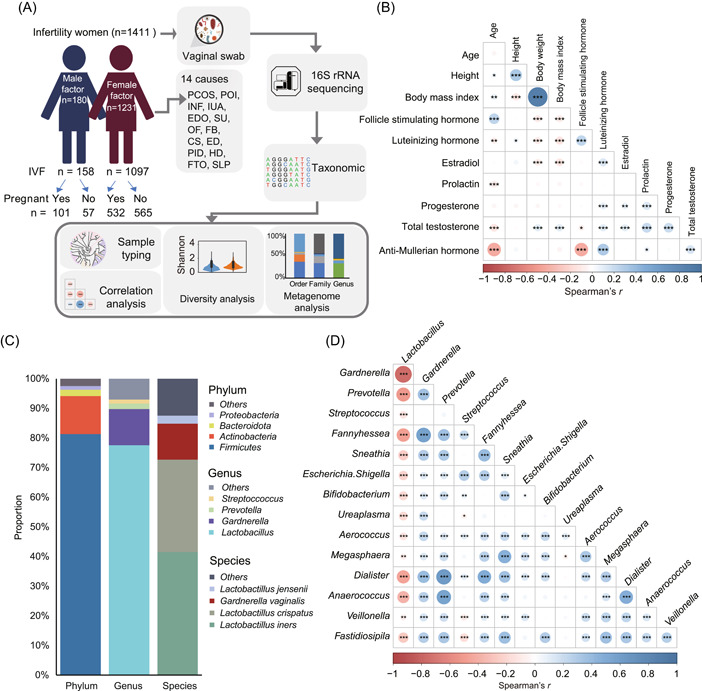
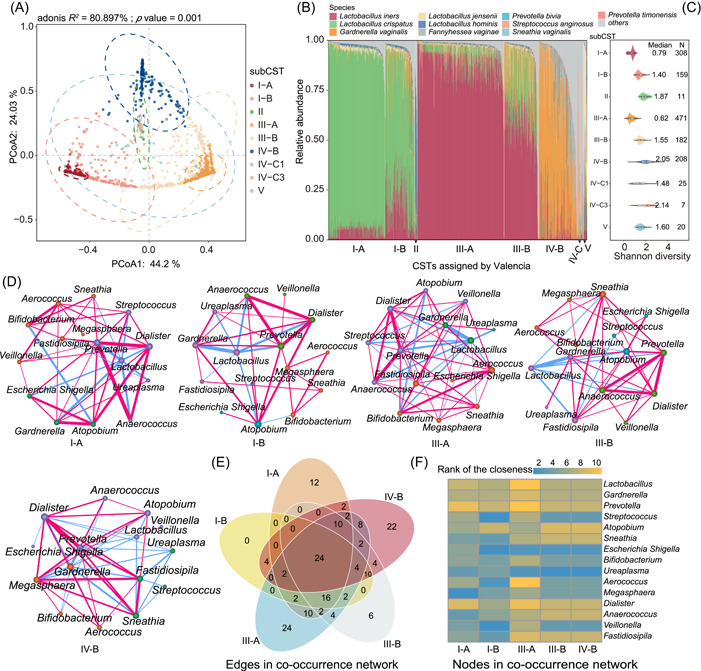
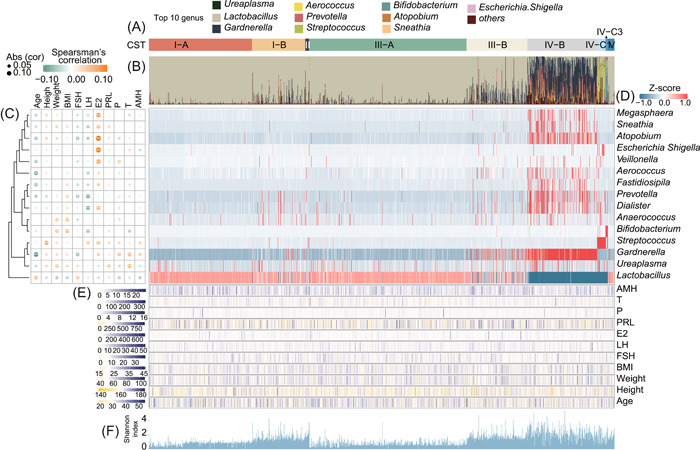
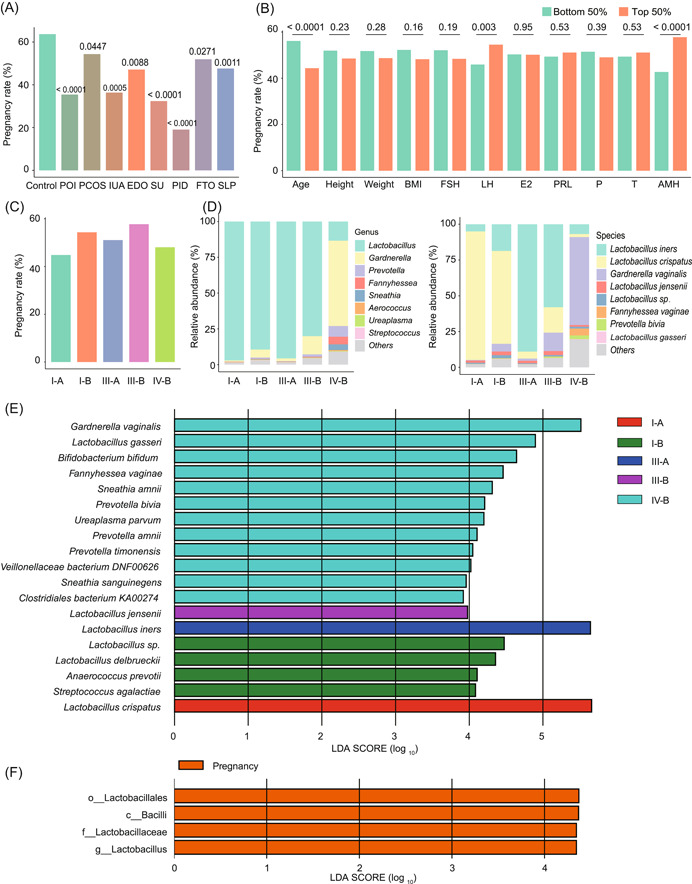
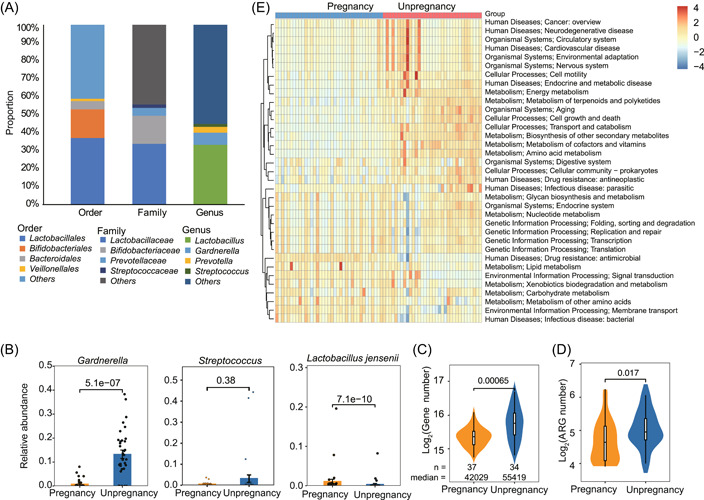
The vaginal microbiome plays an essential role in the reproductive health of human females. As infertility increases worldwide, understanding the roles that the vaginal microbiome may have in infertility and in vitro fertilization (IVF) treatment outcomes is critical. To determine the vaginal microbiome composition of 1411 individuals (1255 undergoing embryo transplantation) and their associations with reproductive outcomes, clinical and biochemical features are measured, and vaginal samples are 16S rRNA sequenced. Our results suggest that both too high and too low abundance of Lactobacillus is not beneficial for pregnancy; a moderate abundance is more beneficial. A moderate abundance of Lactobacillus crispatus and Lactobacillus iners (~80%) (with a pregnancy rate of I-B: 54.35% and III-B: 57.73%) is found beneficial for pregnancy outcomes compared with a higher abundance (>90%) of Lactobacillus (I-A: 44.81% and III-A: 51.06%, respectively). The community state type (CST) IV-B (contains a high to moderate relative abundance of Gardnerella vaginalis) shows a similar pregnant ratio (48.09%) with I-A and III-A, and the pregnant women in this CST have a higher abundance of Lactobacillus species. Metagenome analysis of 71 samples shows that nonpregnant women are detected with more antibiotic-resistance genes, and Proteobacteria and Firmicutes are the main hosts. The inherent differences within and between women in different infertility groups suggest that vaginal microbes might be used to detect infertility and potentially improve IVF outcomes.
Keywords: IVF; community; infertility; vaginal microbiome.
© 2024 The Authors. iMeta published by John Wiley & Sons Australia, Ltd on behalf of iMeta Science.
Conflict of interest statement
The authors declare no conflict of interest.
Figures
Similar articles
-
Effects of vaginal microbiota on in vitro fertilization outcomes in women with different infertility causes.Microbiol Spectr. 2025 Mar 4;13(3):e0125524. doi: 10.1128/spectrum.01255-24. Epub 2025 Jan 27. Microbiol Spectr. 2025. PMID: 39868783 Free PMC article.
-
The vaginal microbiome as a predictor for outcome of in vitro fertilization with or without intracytoplasmic sperm injection: a prospective study.Hum Reprod. 2019 Jun 4;34(6):1042-1054. doi: 10.1093/humrep/dez065. Hum Reprod. 2019. PMID: 31119299
-
An insight into the vaginal microbiome of infertile women in Bangladesh using metagenomic approach.Front Cell Infect Microbiol. 2024 Jul 9;14:1390088. doi: 10.3389/fcimb.2024.1390088. eCollection 2024. Front Cell Infect Microbiol. 2024. PMID: 39040604 Free PMC article.
-
The composition and stability of the vaginal microbiome of healthy women.J Pak Med Assoc. 2021 Aug;71(8):2045-2051. doi: 10.47391/JPMA.1465. J Pak Med Assoc. 2021. PMID: 34418027 Review.
-
[Characteristics and physiologic role of female lower genital microbiome].Orv Hetil. 2023 Jun 18;164(24):923-930. doi: 10.1556/650.2023.32791. Print 2023 Jun 18. Orv Hetil. 2023. PMID: 37330978 Review. Hungarian.
Cited by
-
Transcriptomic and Metabolomic Analysis of the Uterine Tissue of Yaoshan Chicken and Its Crossbreeds to Reveal the Molecular Mechanism Influencing Eggshell Quality.Genes (Basel). 2025 Mar 27;16(4):383. doi: 10.3390/genes16040383. Genes (Basel). 2025. PMID: 40282343 Free PMC article.
-
Effects of vaginal microbiota on in vitro fertilization outcomes in women with different infertility causes.Microbiol Spectr. 2025 Mar 4;13(3):e0125524. doi: 10.1128/spectrum.01255-24. Epub 2025 Jan 27. Microbiol Spectr. 2025. PMID: 39868783 Free PMC article.
-
Integrated multi-omics reveals the impact of ruminal keystone bacteria and microbial metabolites on average daily gain in Xuzhou cattle.Microbiol Spectr. 2025 Aug 5;13(8):e0076925. doi: 10.1128/spectrum.00769-25. Epub 2025 Jun 30. Microbiol Spectr. 2025. PMID: 40586571 Free PMC article.
-
ggClusterNet 2: An R package for microbial co-occurrence networks and associated indicator correlation patterns.Imeta. 2025 Apr 25;4(3):e70041. doi: 10.1002/imt2.70041. eCollection 2025 Jun. Imeta. 2025. PMID: 40469522 Free PMC article.
-
Characterization of vaginal microbiomes in clinician-collected bacterial vaginosis diagnosed samples.Microbiol Spectr. 2025 Apr;13(4):e0258224. doi: 10.1128/spectrum.02582-24. Epub 2025 Feb 25. Microbiol Spectr. 2025. PMID: 39998243 Free PMC article.
References
-
- Mascarenhas, Maya N. , Flaxman Seth R., Boerma Ties, Vanderpoel Sheryl, and Stevens Gretchen A.. 2012. “National, Regional, and Global Trends in Infertility Prevalence Since 1990: A Systematic Analysis of 277 Health Surveys.” PLoS Medicine 9: e1001356. 10.1371/journal.pmed.1001356 - DOI - PMC - PubMed
-
- Sahana Devi, K. J. , and Yendapalli Vamsidhar. 2022. “Women Infertility: A Systematic Review of Effects and Causes.” SN Computer Science 4: 103. 10.1007/s42979-022-01510-5 - DOI
-
- Borumandnia, Nasrin , Alavi Majd Hamid, Khadembashi Naghmeh, and Alaii Hojat. 2022. “Worldwide Trend Analysis of Primary and Secondary Infertility Rates Over Past Decades: A Cross‐Sectional Study.” International Journal of Reproductive BioMedicine 20: 37. 10.18502/ijrm.v20i1.10407 - DOI - PMC - PubMed
LinkOut - more resources
Full Text Sources
Research Materials