. 2024 Mar 13;9(6):1817-1835.
doi: 10.1016/j.ekir.2024.03.014. eCollection 2024 Jun.

Interferon and B-cell Signatures Inform Precision Medicine in Lupus Nephritis

Collaborators, Affiliations

Interferon and B-cell Signatures Inform Precision Medicine in Lupus Nephritis

Ioannis Parodis et al. Kidney Int Rep. .

Abstract

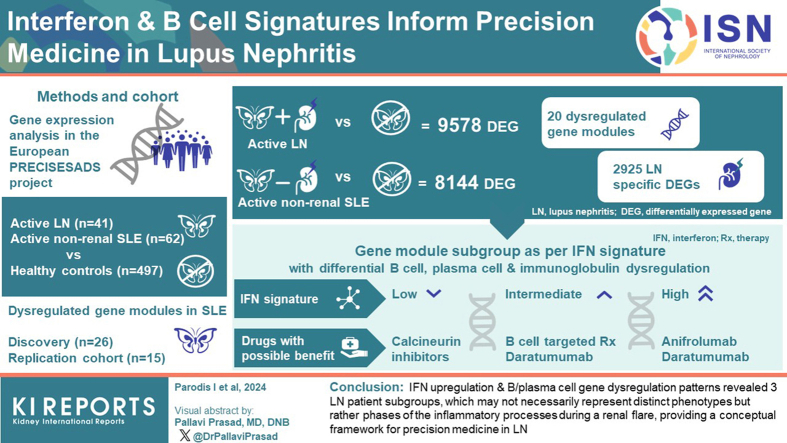
Introduction: Current therapeutic management of lupus nephritis (LN) fails to induce long-term remission in over 50% of patients, highlighting the urgent need for additional options.

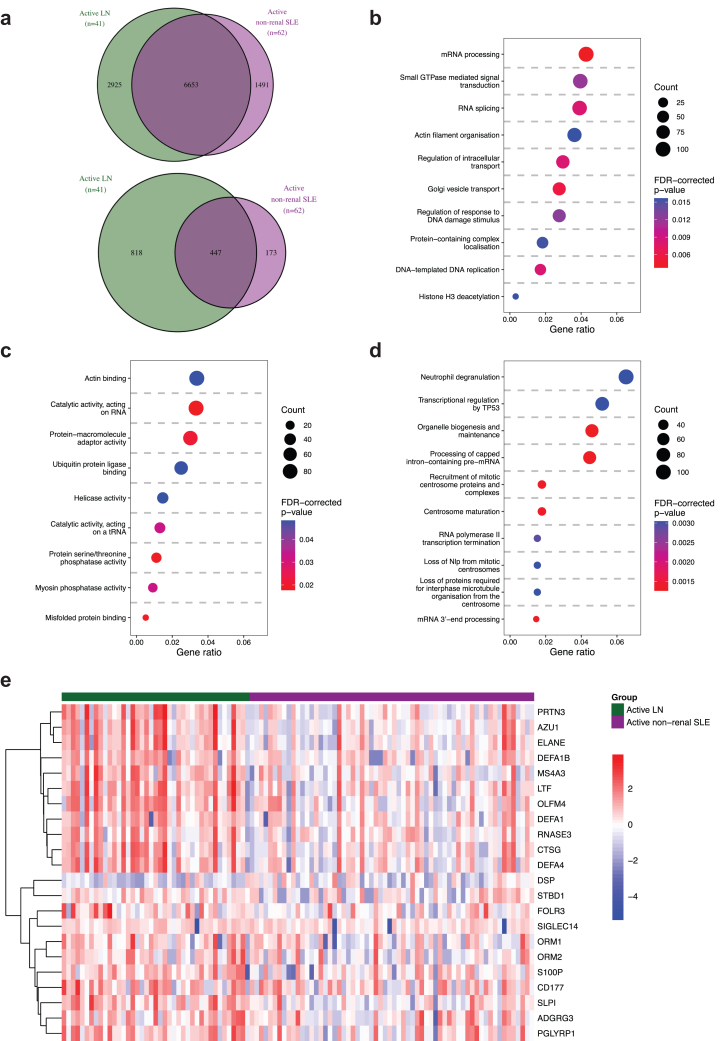
Methods: We analyzed differentially expressed genes (DEGs) in peripheral blood from patients with active LN (n = 41) and active nonrenal lupus (n = 62) versus healthy controls (HCs) (n = 497) from the European PRECISESADS project (NTC02890121), and dysregulated gene modules in a discovery (n = 26) and a replication (n = 15) set of active LN cases.

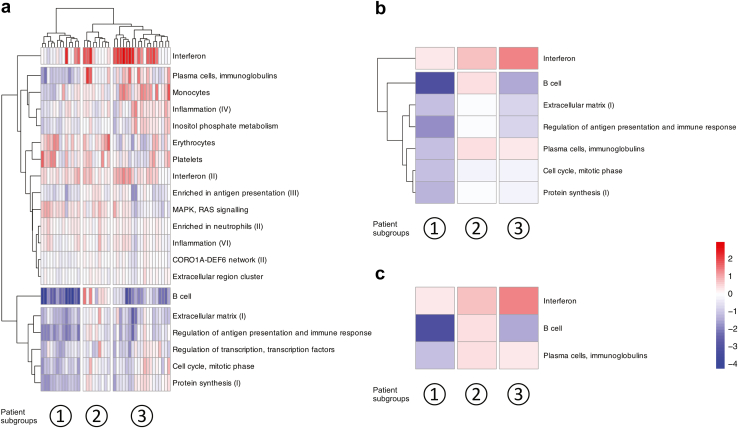
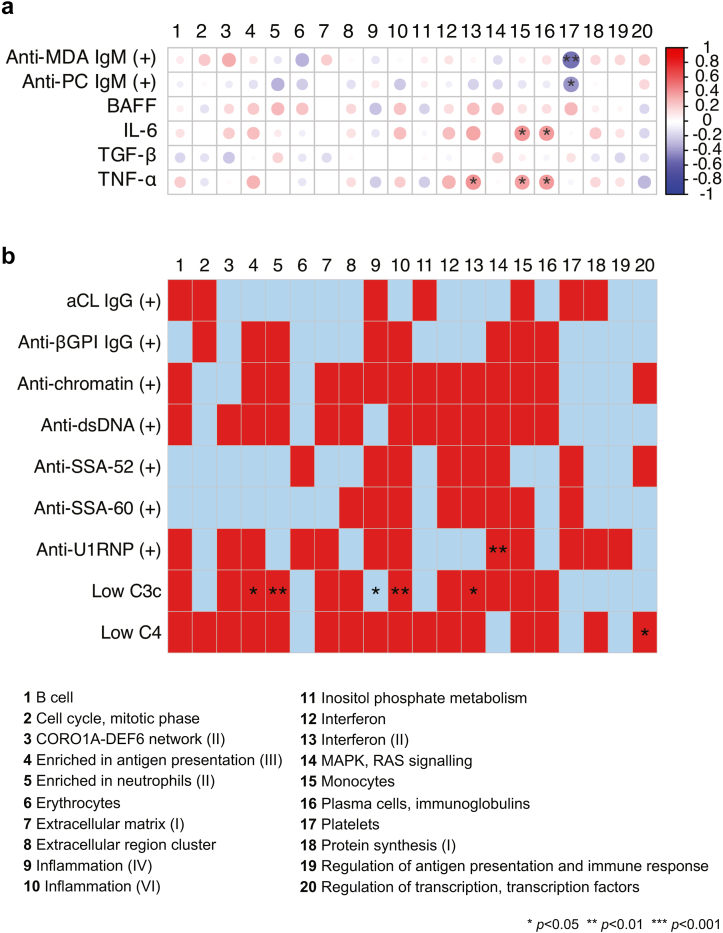
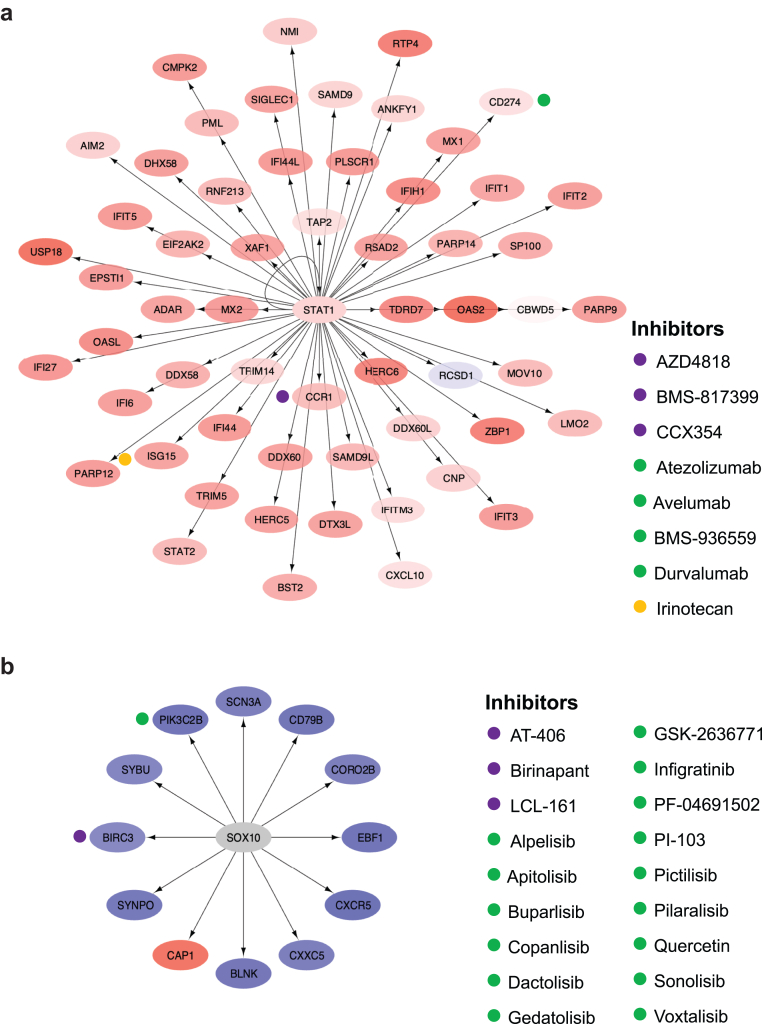
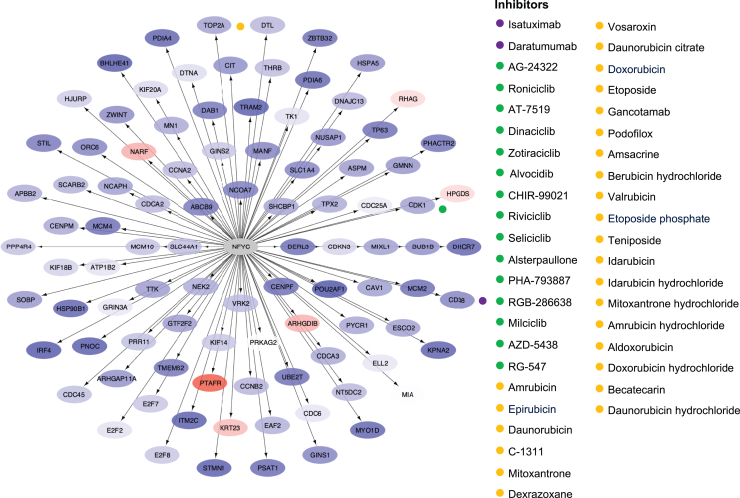
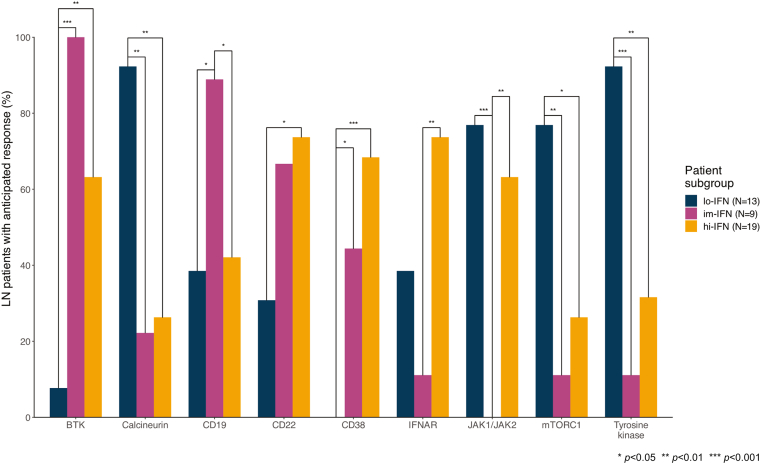
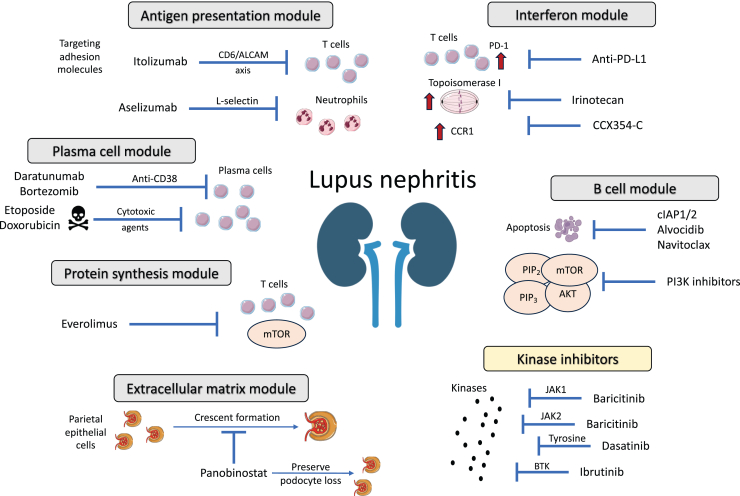
Results: Replicated gene modules qualified for correlation analyses with serologic markers, and regulatory network and druggability analysis. Unsupervised coexpression network analysis revealed 20 dysregulated gene modules and stratified the active LN population into 3 distinct subgroups. These subgroups were characterized by low, intermediate, and high interferon (IFN) signatures, with differential dysregulation of the "B cell" and "plasma cells/Ig" modules. Drugs annotated to the IFN network included CC-motif chemokine receptor 1 (CCR1) inhibitors, programmed death-ligand 1 (PD-L1) inhibitors, and irinotecan; whereas the anti-CD38 daratumumab and proteasome inhibitor bortezomib showed potential for counteracting the "plasma cells/Ig" signature. In silico analysis demonstrated the low-IFN subgroup to benefit from calcineurin inhibition and the intermediate-IFN subgroup from B-cell targeted therapies. High-IFN patients exhibited greater anticipated response to anifrolumab whereas daratumumab appeared beneficial to the intermediate-IFN and high-IFN subgroups.

Conclusion: IFN upregulation and B and plasma cell gene dysregulation patterns revealed 3 subgroups of LN, which may not necessarily represent distinct disease phenotypes but rather phases of the inflammatory processes during a renal flare, providing a conceptual framework for precision medicine in LN.

Keywords: biologics; druggability; lupus nephritis; precision medicine; systemic lupus erythematosus; trancriptomics; transcriptome.


Figures

None
Graphical abstract
Figure 1
Figure 1
DEGs in patients with active LN and active nonrenal SLE versus HC. (a) The Venn diagrams show DEGs (top) and the subset of DEGs that exceeded the |log2 FC| > 0.58 threshold (bottom) in patients with active LN versus HCs (in green), and in patients with active nonrenal SLE versus HC (in purple). The most enriched (b) BP GO terms, (c) MF GO terms, and (d) Reactome pathways from overrepresentation analysis are plotted, based on LN-specific DEGs in patients with active LN versus HCs (panel A, n = 2925). The size of the dots represents the gene count, and the gene ratio at the bottom of each dot plot represents the ratio between the gene count and the total number of DEGs included in the GO or Reactome library. The color of the dots corresponds to the FDR-corrected P-value from the pathway enrichment analysis. (e) The heatmap shows gene expression patterns in patients with active LN (green) or active nonrenal SLE (purple) from the Reactome “neutrophil degranulation” pathway. Only DEGs that exceeded the |log2 FC| > 0.58 threshold in the DEG analysis in patients with active LN versus HCs are included in the heatmap. Columns denote SLE patients, and rows denote LN-specific DEGs, clustered using hierarchical clustering with the Ward method. BP, biological process; CPM, counts per million; DEGs, differentially expressed genes; FC, fold change; FDR, false discovery rate; GO, gene ontology; HCs, healthy controls; LN, lupus nephritis; MF, molecular function; SLE, systemic lupus erythematosus.
Figure 2
Figure 2
Dysregulated gene modules in patients with active LN. (a) The heatmap shows replicated gene modules and their dysregulation in relation to the gene expression of HCs, as measured by the z-score, in patients with LN. Columns denote patients with LN, and rows denote gene modules, clustered using hierarchical clustering with the Ward method. (b) The heatmap displays gene modules with a mean |z-score| >1 in at least 1 patient subgroup, represented in each column. (c) The heatmap displays the most discriminative gene modules, categorizing the patients into a lo-IFN, im-IFN, and high hi-IFN subgroup. Red and blue colors denote higher and lower z-scores compared to the HC, respectively. CORO1A-DEF6, coronin 1A-differentially expressed in FDCP 6 homolog; HCs, healthy controls; hi, high; IFN, interferon; im, intermediate; lo, low; LN, lupus nephritis; MAPK, mitogen-activated protein kinase.
Figure 3
Figure 3
Dysregulated gene modules in relation to serologic markers in patients with active lupus nephritis. (a) The correlation heatmap shows Spearman’s rank correlation coefficients for correlations between levels of selected autoantibodies or cytokines and dysregulation of gene modules as measured by the z-score. (b) Dysregulation of gene modules in relation to autoantibody positivity or low levels of C3c or C4. The group without autoantibody positivity or low levels of C3c or C4 for each comparison was considered the reference group. Red and blue colors denote higher and lower z-scores compared with the reference group, respectively. P-values are derived from Mann-Whitney U tests. Asterisks denote statistically significant correlations or differences. aCL, anticardiolipin; BAFF, B-cell activating factor belonging to the tumor necrosis factor family; βGPI, β2 glycoprotein I; C3c, complement component 3c; C4, complement component 4; CORO1A-DEF6, coronin 1A - differentially expressed in FDCP 6 homolog; IL-6, interleukin 6; MAPK, mitogen-activated protein kinase; MDA, malondialdehyde; PC, phosphorylcholine; TGF-β, transforming growth factor β; TNF-α, transforming growth factor α.
Figure 4
Figure 4
The STAT1 and SOX10 signaling molecule networks and annotated drug targets in patients with active lupus nephritis. (a) Genes in the interferon gene module were imputed in iRegulon through Cytoscape to generate signaling molecule networks and identify their chief regulators. One of the most enriched signaling molecule networks, based on normalized enrichment score, is plotted, with the chief regulator STAT1 in the central node. The color of the nodes ranges from light blue (downregulated genes) to increasing intensities of red (upregulated genes) based on the gene dysregulation (z-scores) in the hi-IFN patient subgroup. (b) One of the most enriched signaling molecule networks, based on genes in the B-cell gene module, is plotted, with the chief regulator SOX10 in the central node. The color of the nodes ranges from light blue (downregulated genes) to increasing intensities of red (upregulated genes) based on the gene dysregulation (z-scores) in the lo-IFN and hi-IFN patient subgroups. Hi, high; IFN, interferon; lo; low; STAT1: signal transducer and activator of transcription 1.
Figure 5
Figure 5
The NFYC signaling molecule network and annotated drug targets in patients with active lupus nephritis. Genes in the plasma cells, Ig gene module were imputed in iRegulon through Cytoscape to generate signaling molecule networks and identify their chief regulators. One of the most enriched signaling molecule networks, based on normalized enrichment score, is plotted, with the chief regulator NFYC in the central node. The color of the nodes ranges from light blue (downregulated genes) to increasing intensities of red (upregulated genes) based on the gene dysregulation (z-scores) in the lo-IFN patient subgroup. Inhibiting drugs and their upregulated targets are indicated by colored dots. IFN, interferon; lo, low; NFYC, nuclear transcription factor Y subunit gamma.
Figure 6
Figure 6
Anticipated response to inhibition of selected drug targets in patients with active lupus nephritis (LN). Bars depict proportions of patients with an anticipated benefit from inhibition of selected drug targets across LN patient subgroups. BTK, Bruton’s tyrosine kinase; hi, high; IFN, interferon; IFNAR, interferon-α/β receptor; im, intermediate; JAK, Janus kinase; LN, lupus nephritis; lo, low; mTORC1, mammalian target of rapamycin complex 1.
Figure 7
Figure 7
Overview of major mechanisms and effector pathways implicated in lupus nephritis pathogenesis emerging as targets of future therapies. Molecular network analysis followed by druggability assessment suggested key dysregulated gene modules involving “interferon”, “B cells”, “plasma cells”, “antigen presentation”, “protein synthesis”, and “extracellular matrix”. Aberrant transcriptomic signatures could be reversed by specific drugs, as schematically depicted. ALCAM, activated leukocyte cell adhesion molecule; Anti-PD-L1, antiprogrammed death-ligand 1; BTK, Bruton’s tyrosine kinase; CCR1, CC-motif chemokine receptor 1; cIAP1/2, cellular inhibitors of apoptosis 1/2; JAK2, Janus kinase 2; PI3K, phosphoinositide 3-kinase; TYK2, tyrosine kinase 2.

References

    1. Hanly J.G., O’Keeffe A.G., Su L., et al. The frequency and outcome of lupus nephritis: results from an international inception cohort study. Rheumatol (Oxf Engl) 2016;55:252–262. doi: 10.1093/rheumatology/kev311. - DOI - PMC - PubMed
    1. Anders H.J., Saxena R., Zhao M.H., Parodis I., Salmon J.E., Mohan C. Lupus nephritis. Nat Rev Dis Primers. 2020;6:7. doi: 10.1038/s41572-019-0141-9. - DOI - PubMed
    1. Tektonidou M.G., Dasgupta A., Ward M.M. Risk of end-stage renal disease in patients with lupus nephritis, 1971–2015: a systematic review and Bayesian meta-analysis. Arthritis Rheumatol. 2016;68:1432–1441. doi: 10.1002/art.39594. - DOI - PMC - PubMed
    1. Tektonidou M.G., Lewandowski L.B., Hu J., Dasgupta A., Ward M.M. Survival in adults and children with systemic lupus erythematosus: a systematic review and Bayesian meta-analysis of studies from 1950 to 2016. Ann Rheum Dis. 2017;76:2009–2016. doi: 10.1136/annrheumdis-2017-211663. - DOI - PubMed
    1. Fanouriakis A., Kostopoulou M., Cheema K., et al. 2019 Update of the Joint European League Against Rheumatism and European Renal Association-European Dialysis and Transplant Association (EULAR/ERA-EDTA) recommendations for the management of lupus nephritis. Ann Rheum Dis. 2020;79:713–723. doi: 10.1136/annrheumdis-2020-216924. - DOI - PubMed