

Competing Risks Analysis of Kidney Transplant Waitlist Outcomes: Two Important Statistical Perspectives
- PMID: 38899174
- PMCID: PMC11184382
- DOI: 10.1016/j.ekir.2024.01.050
Competing Risks Analysis of Kidney Transplant Waitlist Outcomes: Two Important Statistical Perspectives
Abstract
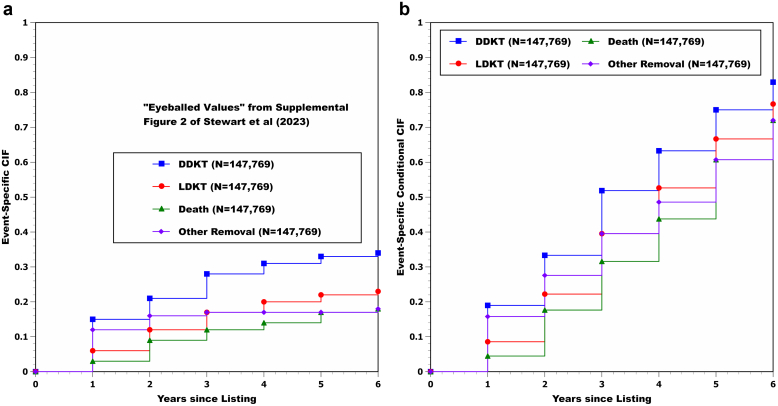
Modern competing risks analysis has 2 primary goals in clinical epidemiology as follows: (i) to maximize the clinician's knowledge of etiologic associations existing between potential predictor variables and various cause-specific outcomes via cause-specific hazard models, and (ii) to maximize the clinician's knowledge of noteworthy differences existing in cause-specific patient risk via cause-specific subdistribution hazard models (cumulative incidence functions [CIFs]). A perfect application exists in analyzing the following 4 distinct outcomes after listing for a deceased donor kidney transplant (DDKT): (i) receiving a DDKT, (ii) receiving a living donor kidney transplant (LDKT), (iii) waitlist removal due to patient mortality or a deteriorating medical condition, and (iv) waitlist removal due to other reasons. It is important to realize that obtaining a complete understanding of subdistribution hazard ratios (HRs) is simply not possible without first having knowledge of the multivariable relationships existing between the potential predictor variables and the cause-specific hazards (perspective #1), because the cause-specific hazards form the "building blocks" of CIFs. In addition, though we believe that a worthy and practical alternative to estimating the median waiting-time-to DDKT is to ask, "what is the conditional probability of the patient receiving a DDKT, given that he or she would not previously experience one of the competing events (known as the cause-specific conditional failure probability)," only an appropriate estimator of this conditional type of cumulative incidence should be used (perspective #2). One suggested estimator, the well-known "one minus Kaplan-Meier" approach (censoring competing events), simply does not represent any probability in the presence of competing risks and will almost always produce biased estimates (thus, it should never be used).
Keywords: cause-specific hazard rates; cause-specific waiting time-to-event distributions following kidney transplant waitlisting; conditional cumulative incidence; cumulative incidence; modern competing risks analysis.
© 2024 International Society of Nephrology. Published by Elsevier Inc.
Figures

References
-
- Cox D.R. Regression models and life tables. J R Stat Soc B. 1972;34:187–220. doi: 10.1111/j.2517-6161.1972.tb00899.x. - DOI
-
- Kalbfleisch J.D., Prentice R.L. 1st ed. John Wiley & Sons, Inc; New York, NY: 1980. The Statistical Analysis of Failure Time Data.
-
- Lawless J.F. 1st ed. John Wiley & Sons, Inc; New York, NY: 1982. Statistical Models and Methods for Lifetime Data.
-
- Gaynor J.J., Feuer E.J., Tan C.C., et al. On the use of cause-specific failure and conditional failure probabilities: examples from clinical oncology data. J Am Stat Assoc. 1993;88:400–409. doi: 10.1080/01621459.1993.10476289. - DOI
Publication types
LinkOut - more resources
Full Text Sources
