

Citrate-Buffered, Magnesium-Enriched Dialysate on Calcification Propensity in Hemodialysis Patients - The CitMag Study
- PMID: 38899177
- PMCID: PMC11184245
- DOI: 10.1016/j.ekir.2024.03.023
Citrate-Buffered, Magnesium-Enriched Dialysate on Calcification Propensity in Hemodialysis Patients - The CitMag Study
Abstract
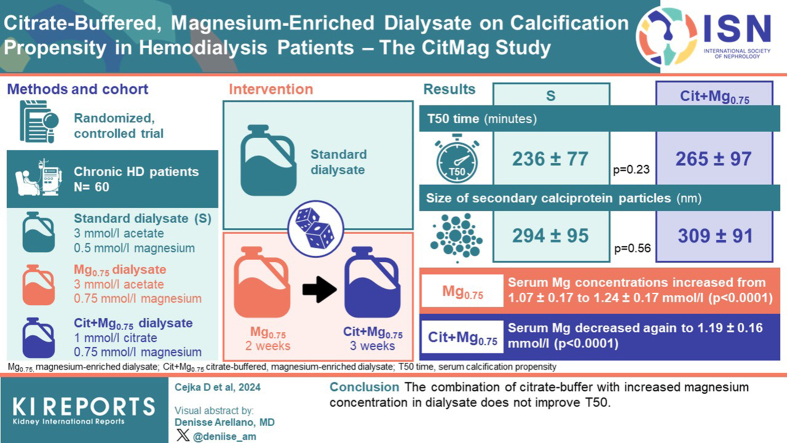
Introduction: Serum calcification propensity (T50 time) is associated with mortality in patients on dialysis. Several solitary interventions improve T50. However, whether a combination of interventions yields further increases in T50 is unknown. We hypothesized that a combination of 2 interventions, namely increasing magnesium concentration while simultaneously substituting acetate for citrate in the dialysis fluid, leads to increases in T50 values.
Methods: In a randomized controlled trial, 60 patients on chronic hemodialysis were allocated to either continue on standard (S) dialysate (3 mmol/l acetate, 0.5 mmol/l magnesium) or a sequence of magnesium-enriched (Mg0.75) dialysate (3 mmol/l acetate, 0.75 mmol/l magnesium) for 2 weeks followed by combination treatment using citrate-buffered, magnesium-enriched (Cit+Mg0.75) dialysate (1 mmol/l citrate, 0.75 mmol/l magnesium) for 3 weeks. The primary end point was the difference in T50 times between the S group and the Cit+Mg0.75 group.
Results: There was no significant difference in T50 time between the S group and the Cit+Mg0.75 group (236 ± 77 vs. 265 ± 97 min, P = 0.23). The size (hydrodynamic radius) of secondary calciprotein particles did not differ between the S group and the Cit+Mg0.75 group (294 ± 95 vs. 309 ± 91 nm, P = 0.56). In longitudinal analyses, serum magnesium concentrations increased from 1.07 ± 0.17 to 1.24 ± 0.17 mmol/l with the Mg0.75 dialysate (P < 0.0001) but decreased again to 1.19 ± 0.16 mmol/l with the Cit+Mg0.75 dialysate (P < 0.0001).
Conclusion: The combination of citrate buffer with increased magnesium concentration in dialysate does not improve T50.
Keywords: calcification propensity; citrate; dialysis; magnesiumT50.
© 2024 International Society of Nephrology. Published by Elsevier Inc.
Figures


References
-
- Kidney Disease: Improving Global Outcomes (KDIGO) CKD-MBD Update Work Group KDIGO 2017 clinical practice guideline update for the diagnosis, evaluation, prevention, and treatment of chronic kidney disease-mineral and bone disorder (CKD-MBD) Kidney Int Suppl. 2017;7:1–59. doi: 10.1016/j.kisu.2017.04.001. Kidney Int Suppl. 2017;7:e1. - DOI - PMC - PubMed
Grants and funding
LinkOut - more resources
Full Text Sources
