. 2024 Oct;20(10):2275-2296.
doi: 10.1080/15548627.2024.2366122. Epub 2024 Jun 20.

An initial HOPS-mediated fusion event is critical for autophagosome transport initiation from the axon terminal

Affiliations

An initial HOPS-mediated fusion event is critical for autophagosome transport initiation from the axon terminal

Serena R Wisner et al. Autophagy. 2024 Oct.

Abstract

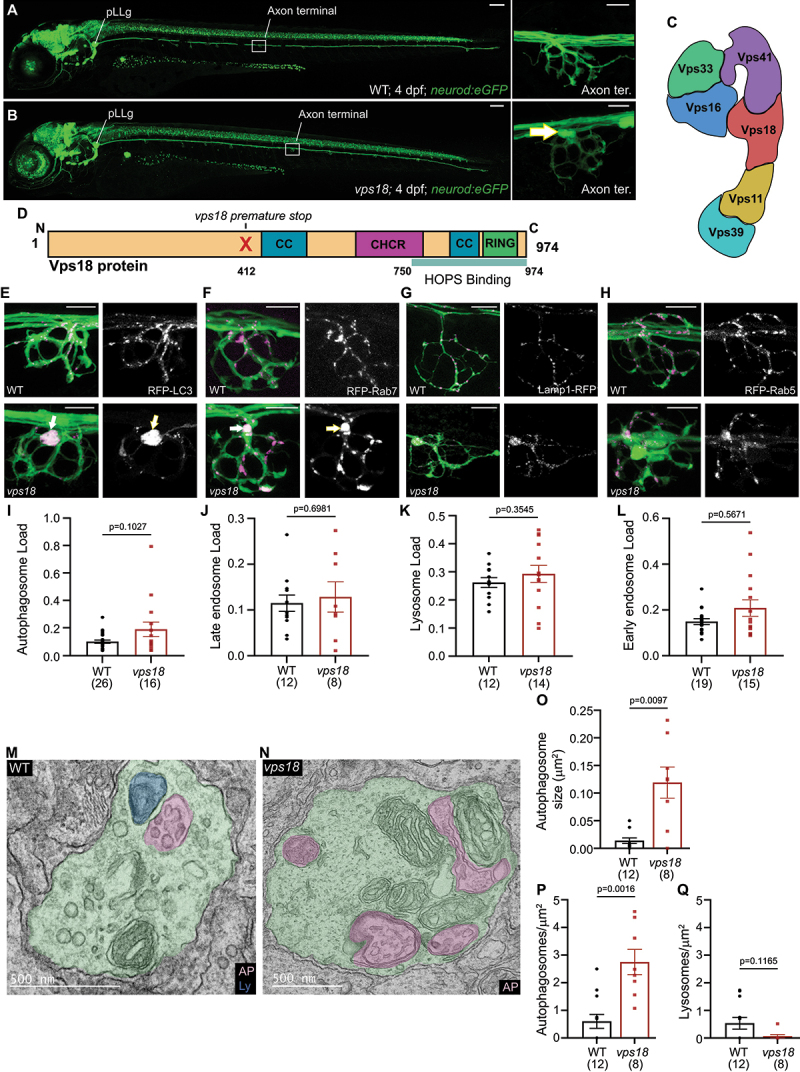
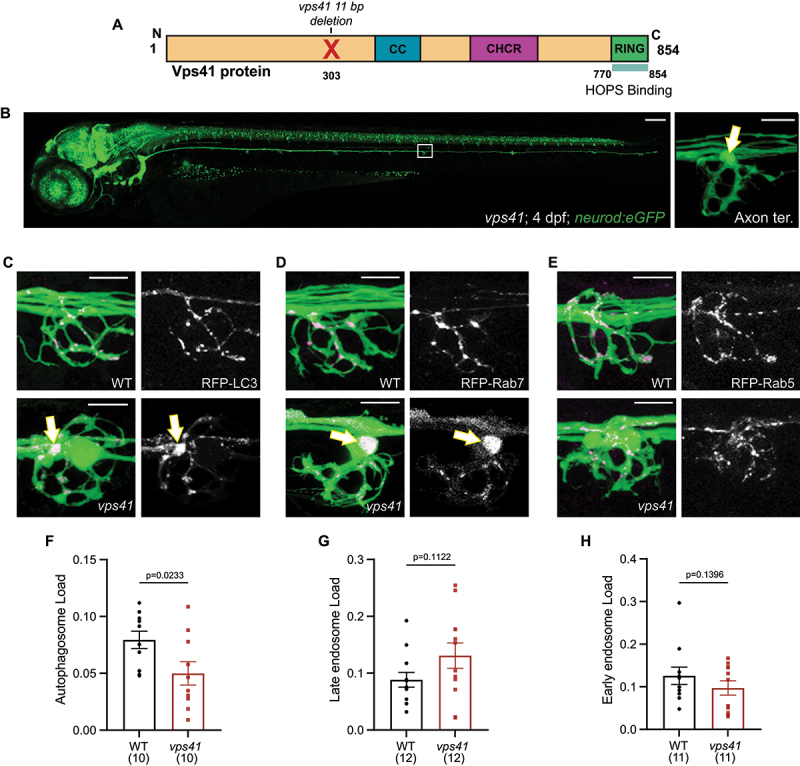
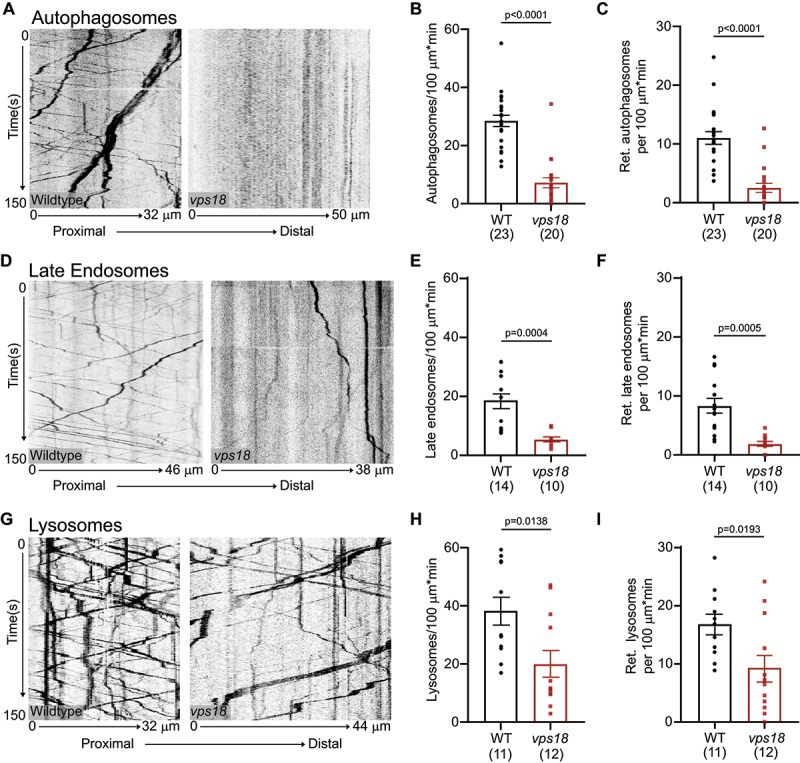
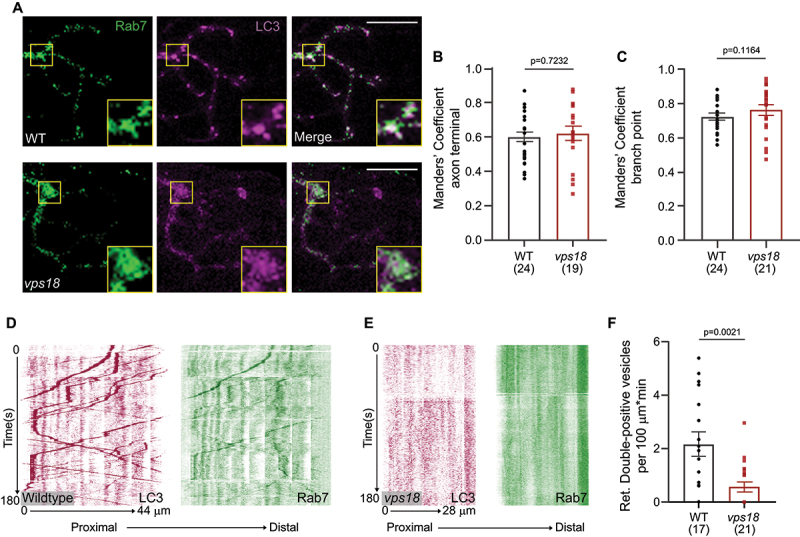
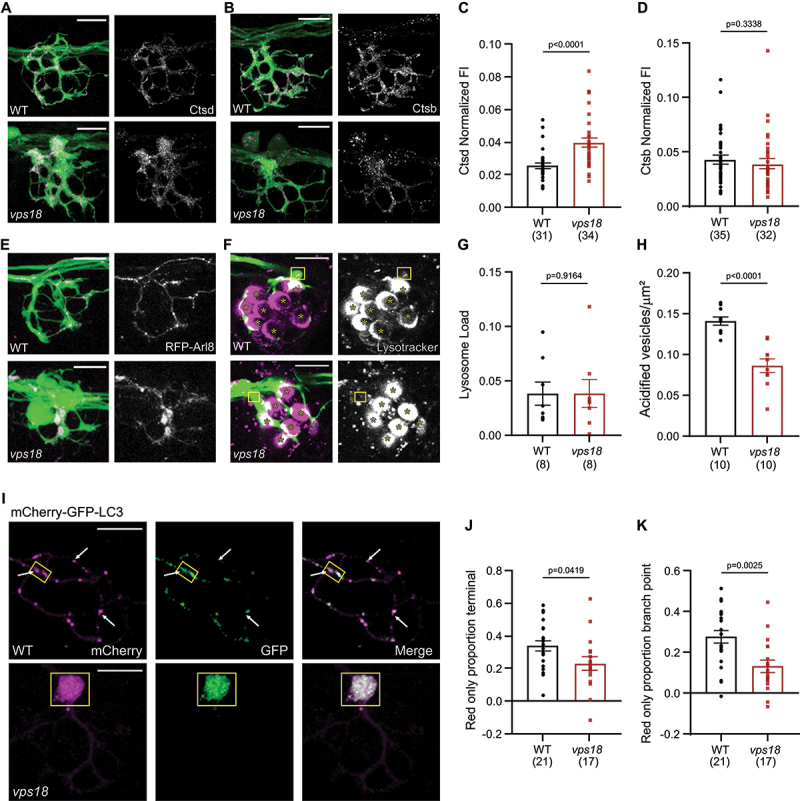
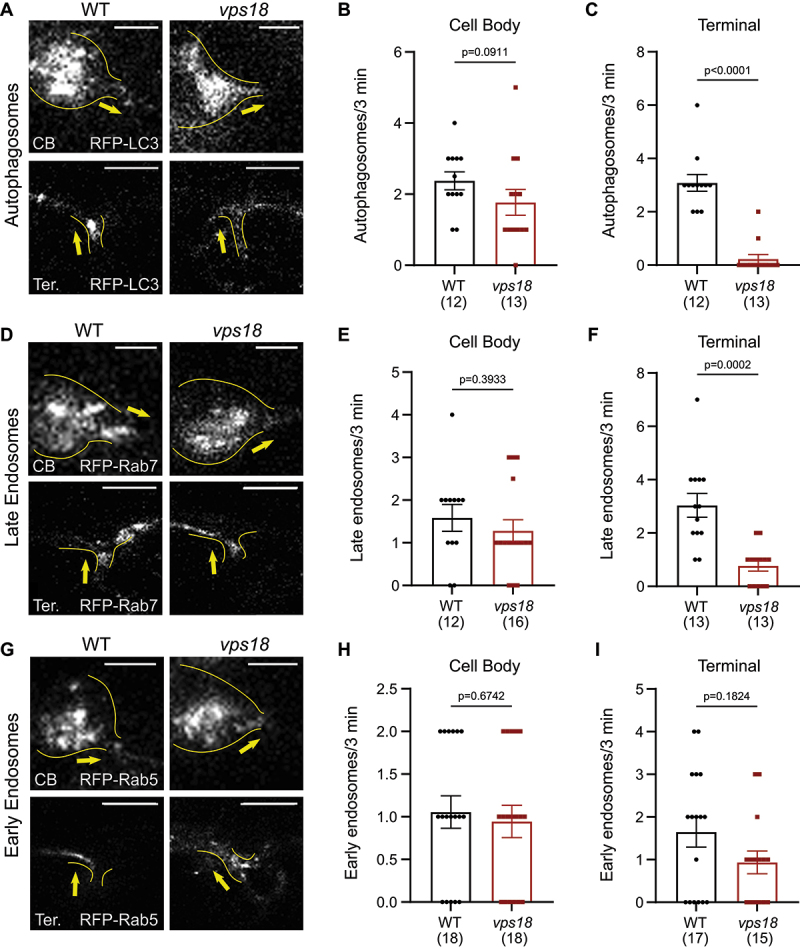
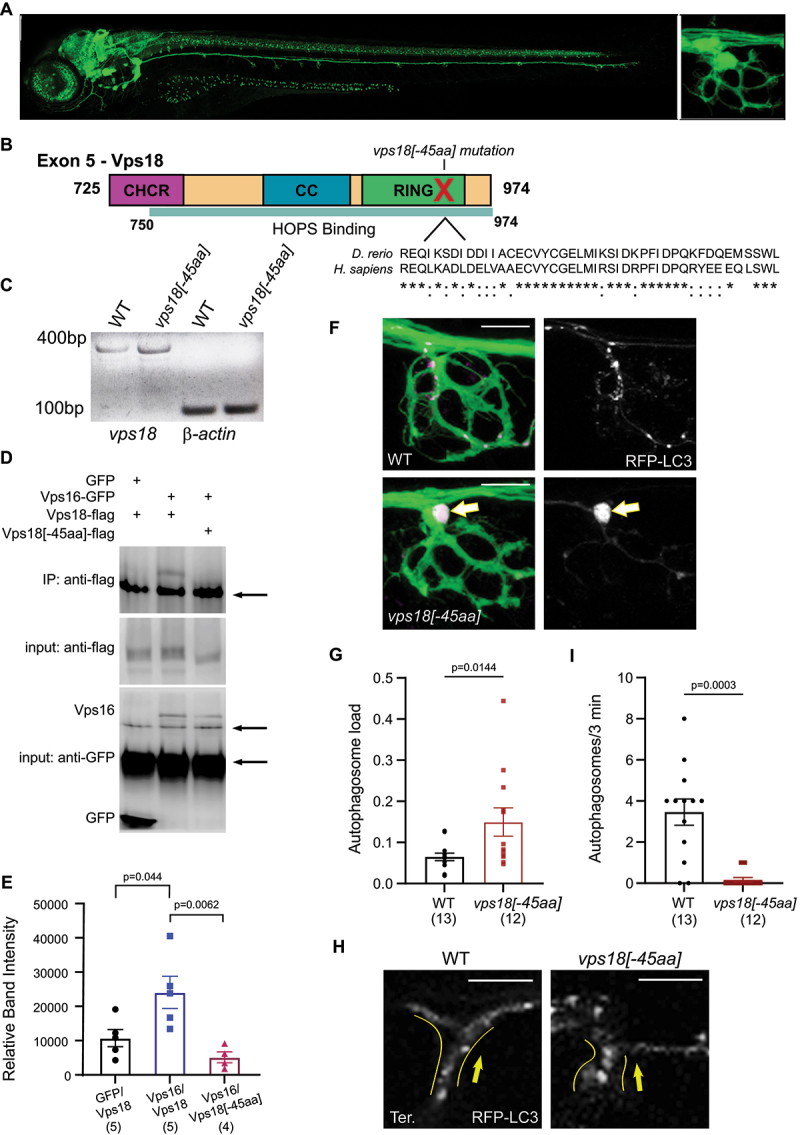
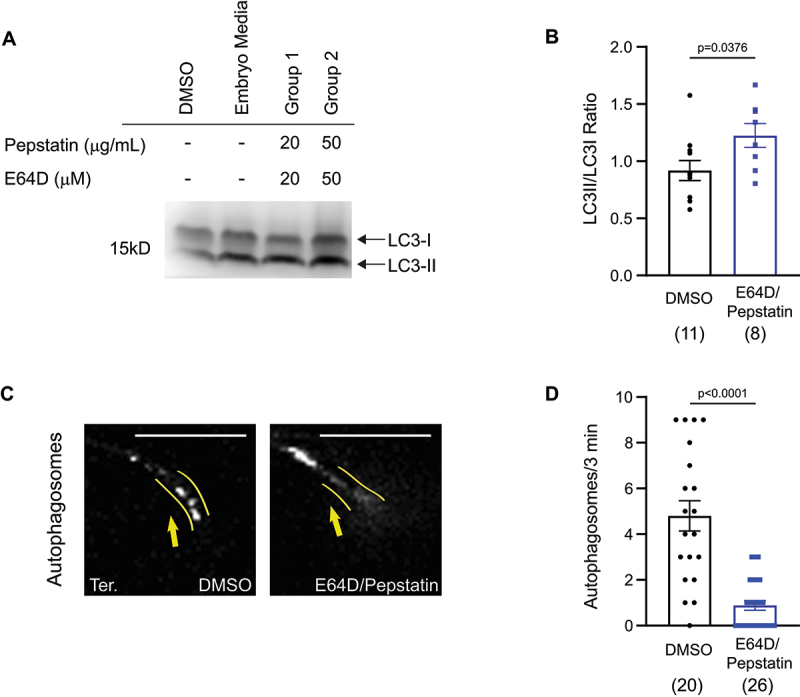
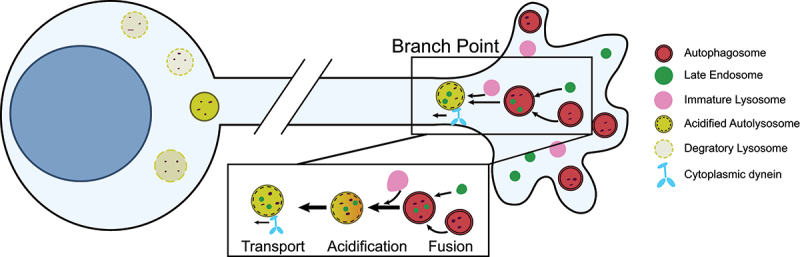
In neurons, macroautophagy/autophagy is a frequent and critical process. In the axon, autophagy begins in the axon terminal, where most nascent autophagosomes form. After formation, autophagosomes must initiate transport to exit the axon terminal and move toward the cell body via retrograde transport. During retrograde transport these autophagosomes mature through repetitive fusion events. Complete lysosomal cargo degradation occurs largely in the cell body. The precipitating events to stimulate retrograde autophagosome transport have been debated but their importance is clear: disrupting neuronal autophagy or autophagosome transport is detrimental to neuronal health and function. We have identified the HOPS complex as essential for early autophagosome maturation and consequent initiation of retrograde transport from the axon terminal. In yeast and mammalian cells, HOPS controls fusion between autophagosomes and late endosomes with lysosomes. Using zebrafish strains with loss-of-function mutations in vps18 and vps41, core components of the HOPS complex, we found that disruption of HOPS eliminates autophagosome maturation and disrupts retrograde autophagosome transport initiation from the axon terminal. We confirmed this phenotype was due to loss of HOPS complex formation using an endogenous deletion of the HOPS binding domain in Vps18. Finally, using pharmacological inhibition of lysosomal proteases, we show that initiation of autophagosome retrograde transport requires autophagosome maturation. Together, our data demonstrate that HOPS-mediated fusion events are critical for retrograde autophagosome transport initiation through promoting autophagosome maturation. This reveals critical roles for the HOPS complex in neuronal autophagy which deepens our understanding of the cellular pathology of HOPS-complex linked neurodegenerative diseases.Abbreviations: CORVET: Class C core vacuole/endosome tethering; gRNA: guide RNA; HOPS: homotypic fusion and protein sorting; pLL: posterior lateral line; Vps18: VPS18 core subunit of CORVET and HOPS complexes; Vps41: VPS41 subunit of HOPS complex.

Keywords: Axon terminal; Vps18; autophagy; axonal transport; lysosome; neuron.


Conflict of interest statement

No potential conflict of interest was reported by the author(s).

Figures

Figure 1.
Figure 1.
Loss of Vps18 causes axon terminal swellings and accumulation of autophagosomes and late endosomes. (A) Image of a 4 day post fertilization (dpf) TgBAC(neurod:egfp)nl1 zebrafish larva expressing eGFP in the central and peripheral nervous system. The ganglion of the posterior lateral line (pLlg) is indicated. An axon terminal is boxed and shown in a higher magnification (right). (B) Image of a 4 dpf vps18[uwd1] (vps18 hereafter) mutant with large swellings at the branch point of pLL axons as they leave the nerve to innervate sensory organs (right, arrow). (C) Schematic of the HOPS complex. Vps18 is a core component of the complex (in red). (D) Schematic of the Vps18 protein. Red X indicates vps18 mutation site. Previously identified HOPS binding domain shown by teal line. Domains: CC- Coiled Coil; CHCR- Clathrin Heavy Chain Repeat; RING- Really Interesting New Gene. (E-H) Representative images of axon terminals of 4 dpf wild-type (top) and vps18 (bottom) zebrafish expressing RFP-LC3 (autophagosomes; E), RFP-Rab7 (late endosomes; F), Lamp1-RFP (lysosomes; G) and RFP-Rab5 (early endosomes; H). Arrows indicate aggregates in axonal swellings. GFP labels the axon area. Organelles are shown in magenta on left, white on right. (I-L) Quantification of organelle load (total organelle area/cytosolic area) in axon terminals. LC3, Lamp1 and Rab5: Wilcoxon. Rab7: ANOVA. (M,N) Representative transmission electron microscopy (TEM) images of axon terminals in wild-type (M) and vps18 (N) zebrafish. Green indicates axon terminals. Pink and blue label autophagosomes (AP) and lysosomes (Ly) respectively. (O-Q) Quantification of autophagosome size (O), number of autophagosomes per μm2 (P), and lysosomes per μm2 (Q) as observed in TEM images (Wilcoxon). Sample size indicates number of axon terminals from 2 wild-type and 5 vps18 mutant sensory organs. Data represented as mean ± SEM. Scale bar: 100 μm for whole larvae in A,B. Scale bar: 10 μm for E-H. Number of larvae analyzed indicated.
Figure 2.
Figure 2.
Loss of Vps41 recapitulates the vps18 mutant phenotype. (A) Schematic of the Vps41 protein and location of the frame shift mutation that generates the protein truncation. HOPS binding domain shown by teal line. (B) vps41[uwd2] mutant (vps41 hereafter) TgBAC(neurod:egfp)nl1 zebrafish larvae at 4 dpf. Box indicates axon terminal. Arrow indicates swelling at axon branch point (right). (C-E) Representative images of axon terminals of 4 dpf wild-type (top) and vps41 (bottom) zebrafish expressing RFP-LC3 (autophagosomes; C), RFP-Rab7 (late endosomes; D), and RFP-Rab5 (early endosomes; E). Arrows indicate aggregates in swellings. GFP labels the axon area. Organelles are shown in magenta on left, white on right. (F-H) Quantification of organelle load (total organelle area/cytosolic area) in terminals. LC3 and Rab7: Wilcoxon. Rab5: ANOVA. Data represented as mean ± SEM. Scale bar: 100 μm for A,B. Scale bar: 10 μm for all other images. Number of larvae analyzed indicated.
Figure 3.
Figure 3.
Autophagosome, late endosome, and lysosome axonal transport are disrupted in vps18 mutants. (A,D,G) Representative kymographs from wild type (left) and vps18 (right) of autophagosome (A), late endosome (D) and lysosome (G) transport in pLL axons (see Videos S1 and S2). Proximal distal location relative to the cell body is indicated. (B,E,H) Total number of autophagosomes, late endosomes and lysosomes in the axon is reduced in vps18 mutants (Wilcoxon). (C,F,I) Total number of autophagosomes, late endosomes and lysosomes moving in the retrograde direction is reduced in vps18 mutants (Wilcoxon).
Figure 4.
Figure 4.
Autophagosomes and late endosomes colocalize in vps18 mutant axon terminals but fail to co-transport suggesting failed fusion. (A) Images of wild type (top) and vps18 mutant (bottom) late endosome (GFP-Rab7) and autophagosome (RFP-LC3) colocalization in pLL axon terminals. Box indicates axon terminal branch point. (B,C) Quantification of Mander’s colocalization coefficient for the axon terminal (B) and the branch point (C), where these organelle populations are enriched (ANOVA). (D,E) Kymographs of autophagosome and late endosome co-transport in pLL axons of the wild type (D) and vps18 mutants (E). (F) Quantification of retrograde co-transport frequency in pLL axons (Wilcoxon). Data represented as mean ± SEM. Number of larvae analyzed indicated.
Figure 5.
Figure 5.
vps18 mutants have reduced autophagosome acidification in axon terminals. (A,B) Images of axon terminals of the wild type (top) and vps18 mutant (bottom) immunolabeled for Ctsd (cathepsin D; A) and Ctsb (cathepsin B; B). Immunofluorescence is shown in magenta on left, white on the right. Non-neuronal signal was removed using a binary mask for clarity. (C,D) Quantification of fluorescence intensity of Ctsd (C) and Ctsb (D) signal in axon terminals normalized to non-neuronal tissue (Wilcoxon). (E) Images of axon terminals in the wild type (top) and vps18 mutant (bottom) expressing RFP-Arl8. Arl8-positive lysosomes are magenta (left) or white (right). (F) Single plane images of LysoTracker-labeled axon terminals in the wild type (top) and vps18 mutant (bottom). GFP labels the axon area. Acidified areas are shown in magenta on left, white on right. Branch point area analyzed indicated by yellow box. Sensory cells in the pLL sensory organs accumulate LysoTracker and are indicated by the asterisks. LysoTracker label is also apparent in non-neuronal tissues (GFP negative). (G) Quantification of lysosome load (organelle area/cytosolic area) shows no change Arl8-positive lysosome presence in axon terminals of vps18 mutants (Wilcoxon). (H) Number of acidified vesicles present in the axon terminal branch point (box) is reduced in vps18 mutants (ANOVA). (I) Representative images of wild-type (top) and vps18 (bottom) axon terminals expressing mCherry-GFP dual tagged LC3. Images presented as mCherry signal only (left), GFP signal only (middle) and merged image (right). Arrows indicate mCherry-only-positive autophagosome area where GFP has been quenched (acidified). Boxed region indicates branch point where autophagosomes accumulate in vps18 mutants. (J,K) Quantification of proportion of red only autophagosomes (acidified autophagosomes) in the entire axon terminal (J) or branch point (K) (ANOVA). Data represented as mean ± SEM. Scale bar: 10 μm. Number of larvae analyzed indicated.
Figure 6.
Figure 6.
Autophagosomes and late endosomes fail to exit from vps18 axon terminals. (A,D,G) Wild-type (left) and vps18 (right) single plane images of cell body (CB, top) and axon terminal (Ter., bottom) of pLL neurons expressing RFP-LC3 (autophagosomes; (A), RFP-Rab7 (late endosomes; (D), or RFP-Rab5 (early endosomes; (G). Yellow lines indicate region analyzed. Arrow shows direction of exit from the area imaged (see Videos S3 and S4). (B,E,H) Number of organelles leaving the cell body is not altered in vps18 mutants (Wilcoxon). (C,F,I) Number of organelles leaving the axon terminal is reduced for both autophagosomes (C) and late endosomes (F) (Wilcoxon). Scale bar: 10 μm. Number of larvae analyzed indicated.
Figure 7.
Figure 7.
Deletion of a minimal HOPS-binding domain in Vps18 causes axon terminal swellings and failed autophagosome exit from axon terminals. (A) vps18[−45aa] mutant larvae at 4 dpf. Box indicates axon terminal. Axon terminal branch points have large swellings (right, arrow). (B) Schematic of exon 5 of the Vps18 protein which contains the previously identified HOPS binding domain. Mutation in vps18[−45aa] is indicated by a red X. Below shows amino acid sequence of lost amino acids in zebrafish (D. rerio) and human (H. sapiens). (C) vps18 mRNA stability is not altered in vps18[−45aa] mutants. Actb/β-actin loading control. (D) Immunoprecipitation of Vps16-GFP with Vps18-flag. Immunoprecipitation (top) and inputs (middle) probed with anti-Flag antibody. Immunoprecipitate reprobed for GFP (bottom). Arrows point to nonspecific background bands. (E) Western blot band intensity normalized to median background. Replicates indicated. (ANOVA with Tukey HSD post-hoc contrasts). (F) Images of axon terminals of 4 dpf wild-type (top) and vps18[−45aa] (bottom) zebrafish expressing RFP-LC3 (autophagosomes). Arrow indicates aggregate in axon terminal swelling. GFP labels the axon area. Autophagosomes are shown in magenta on left, white on right. (G) Quantification of autophagosome load (total organelle area/cytosolic area) in axon terminals (Wilcoxon). (H) Single plane images of axon terminal branch point in the wild type (left) and vps18[−45aa] mutant (right) expressing RFP-LC3. Arrow indicates direction of exit. (I) Number of autophagosomes leaving the axon terminal is reduced in vps18[−45aa] mutants (Wilcoxon). Data represented as mean ± SEM. Scale bar: 100 μm for whole larva in A. Scale bar: 10 μm for F, 5 μm in H. Number of larvae analyzed indicated.
Figure 8.
Figure 8.
Autophagosome maturation is necessary for autophagosome retrograde transport initiation from the axon terminal. (A,B) Representative western blot and quantification of LC3-II:LC3-I levels in extracts from zebrafish larvae treated with 50 µg/mL pepstatin a and 50 µM E64D (ANOVA). (C) Single plane image of a pLL neuron axon terminal branch point from control (left) and drug treated (right) expressing RFP-LC3 to label autophagosomes. (D) Quantification of autophagosome exit frequency demonstrates a strong reduction in autophagosome exit after treatment with lysosomal inhibitors (Wilcoxon). See Videos S5 and S6. Scale bar: 10 μm. Number of larvae analyzed indicated.
Figure 9.
Figure 9.
Model of HOPS complex-mediated initiation of autophagosome retrograde transport. Autophagosomes and late endosomes are produced and potentially fuse in the axon terminal. This fusion is dependent upon the HOPS complex. After fusion, the resulting autophagosome begins to mature in the axon branch point, likely through a second round of fusion with a lysosome. This results in autophagosome acidification and then lysosomal protease activation. After this initial maturation occurs, retrograde transport by the dynein retrograde motor is initiated to move the autophagosome toward the cell body where complete lysosomal degradation of cargo occurs.

Similar articles

References

    1. Maday S, Holzbaur EL.. Autophagosome biogenesis in primary neurons follows an ordered and spatially regulated pathway. Dev Cell. 2014;30(1):71–85. doi: 10.1016/j.devcel.2014.06.001 - DOI - PMC - PubMed
    1. Maday S, Holzbaur EL. Compartment-specific regulation of autophagy in primary neurons. J Neurosci. 2016;36(22):5933–5945. doi: 10.1523/JNEUROSCI.4401-15.2016 - DOI - PMC - PubMed
    1. Maday S, Wallace KE, Holzbaur EL. Autophagosomes initiate distally and mature during transport toward the cell soma in primary neurons. J Cell Bio. 2012;196(4):407–417. doi: 10.1083/jcb.201106120 - DOI - PMC - PubMed
    1. Stavoe AK, Hill SE, Hall DH, et al. KIF1A/UNC-104 transports ATG-9 to regulate neurodevelopment and autophagy at synapses. Dev Cell. 2016;38(2):171–185. doi: 10.1016/j.devcel.2016.06.012 - DOI - PMC - PubMed
    1. Wong YC, Holzbaur EL. The regulation of autophagosome dynamics by huntingtin and HAP1 is disrupted by expression of mutant huntingtin, leading to defective cargo degradation. J Neurosci. 2014;34(4):1293–1305. doi: 10.1523/JNEUROSCI.1870-13.2014 - DOI - PMC - PubMed

Publication types

Substances

LinkOut - more resources